-
Increased spot demand and ETF inflows are driving Bitcoin’s upward momentum and liquidity surge.
-
Reduced supply on exchanges is pushing prices higher, signaling growing institutional interest.
-
Bitcoin’s technical breakout suggests strong bullish momentum, with $100,000 as a key resistance level.
- Looking for actionable trade ideas to navigate the current market volatility? Subscribe here to unlock access to InvestingPro’s AI-selected stock winners.
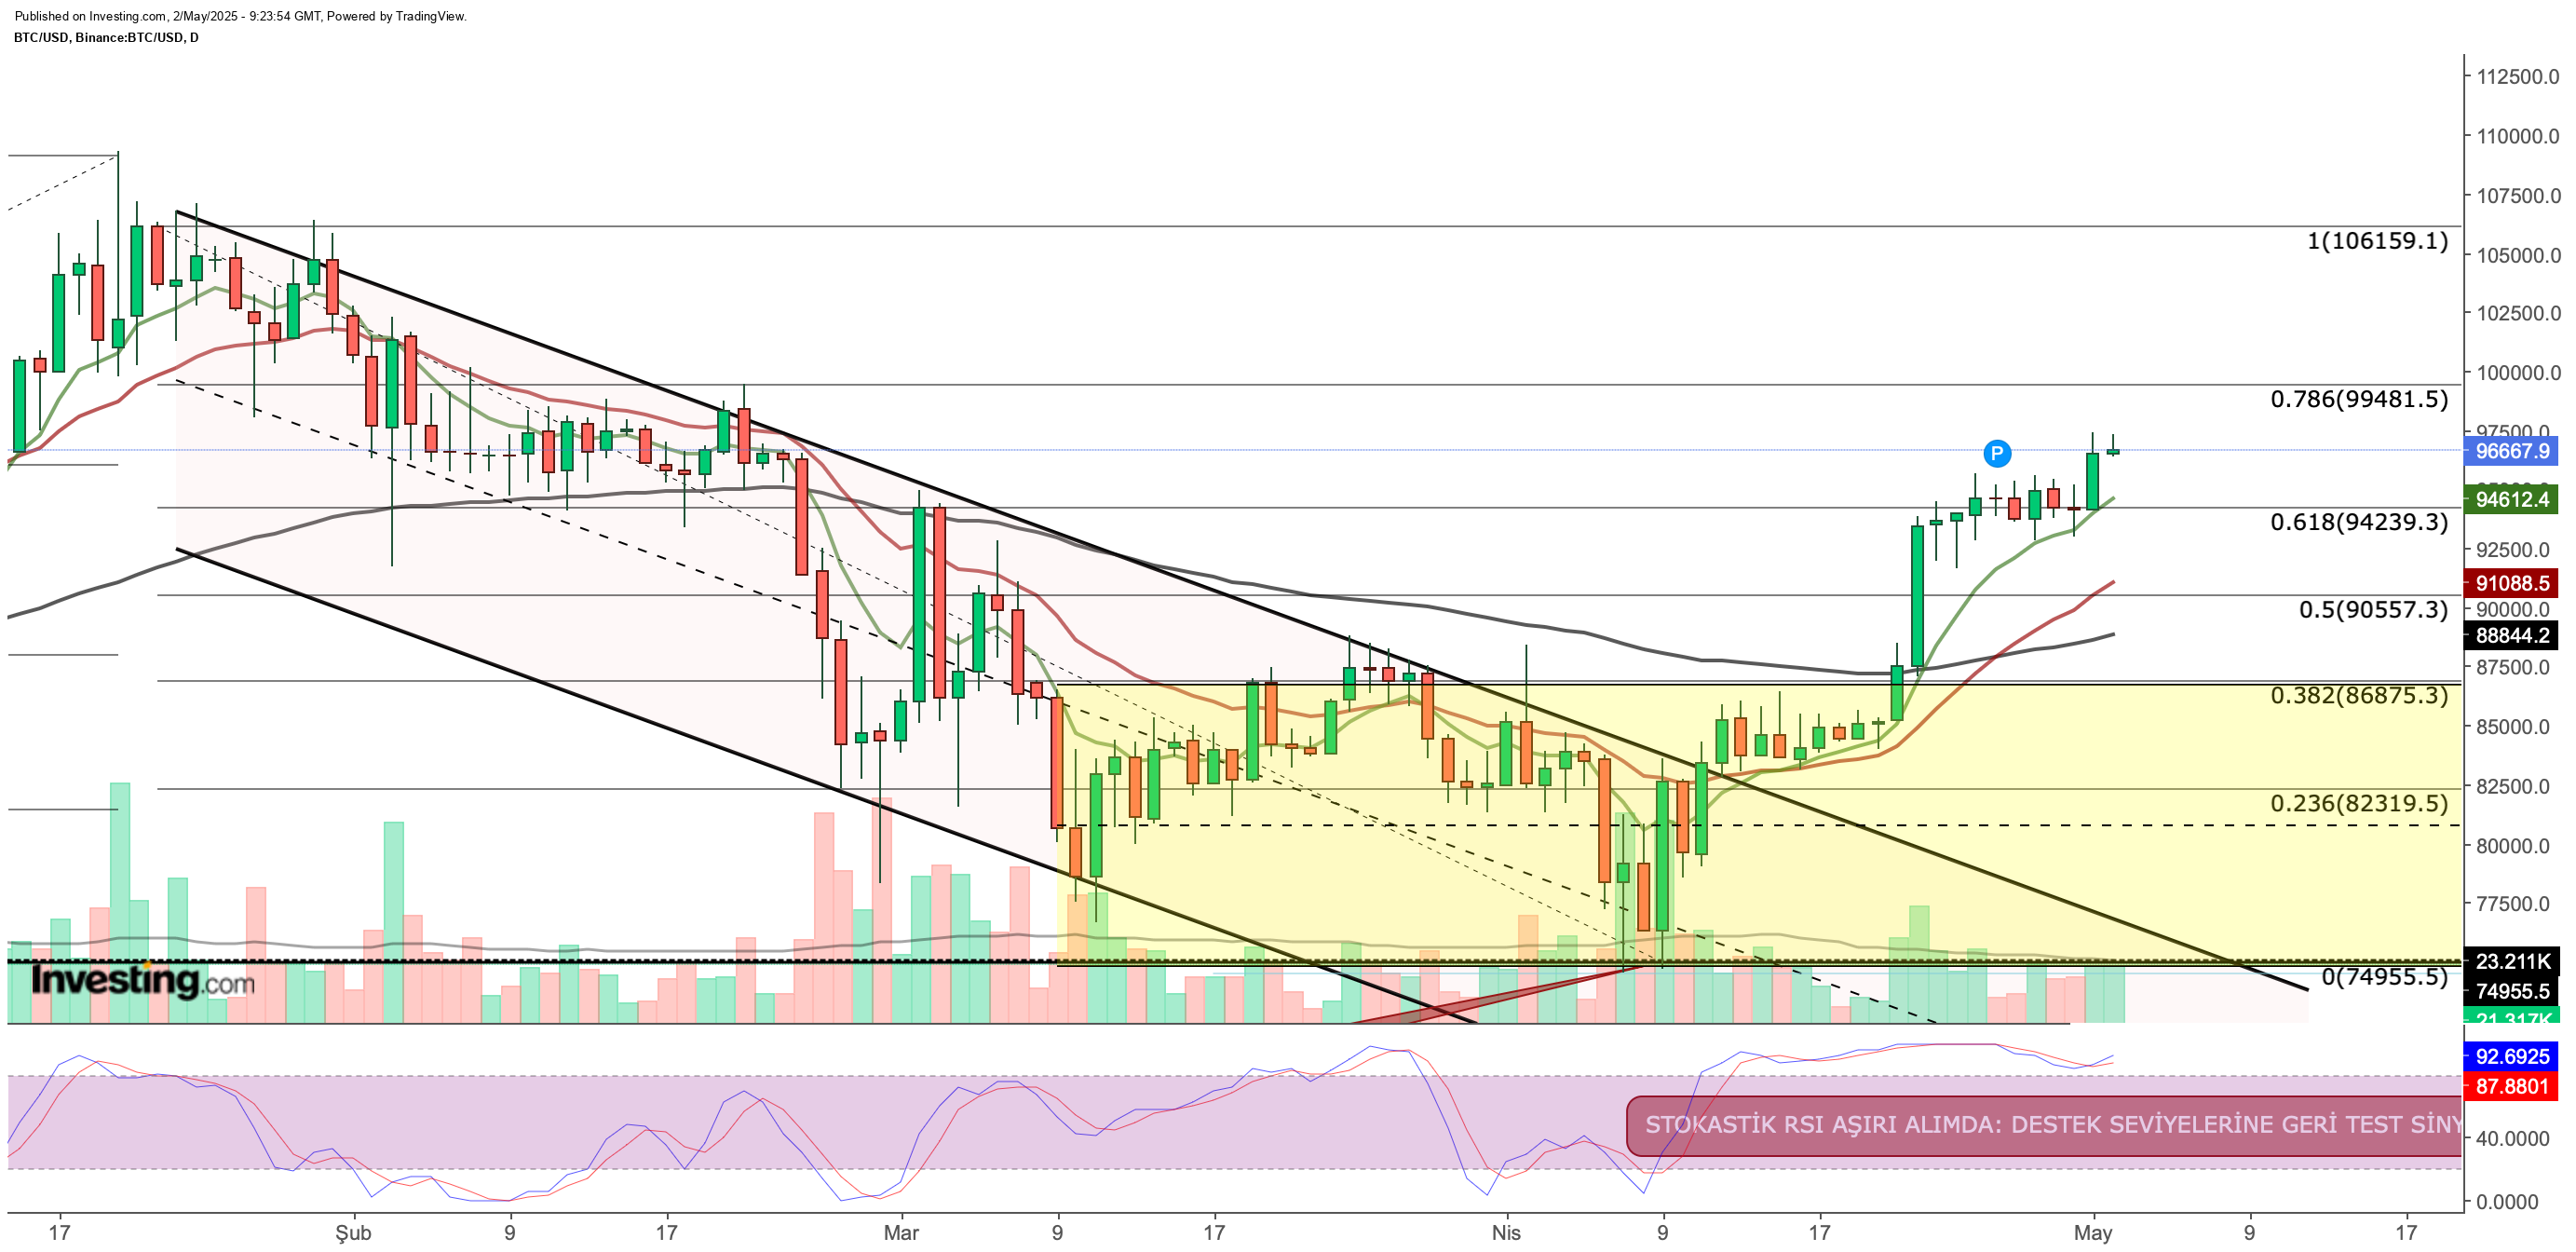
is testing the $97,000 level after a strong rebound from early April declines. Some indicators suggest that this move is more than just a technical bounce; it could signal the beginning of a solid uptrend.
Spot Demand, ETF Inflows Push BTC Price Higher
As we move into the second quarter of 2025, Bitcoin’s spot demand is clearly increasing. Fund inflows into major ETFs like the iShares Bitcoin Trust ETF (NASDAQ:) are a key factor. Last week, IBIT saw $1.5 billion in new funds. This growing institutional interest is boosting liquidity while pulling supply out of the market, which could pressure prices downward.
Unlike the rallies of 2021 and 2023, this surge in spot demand is supported by a more stable, less leveraged market. The focus is now more on direct buying than on derivatives.
At the same time, the amount of Bitcoin on exchanges has fallen to a five-year low. By the end of April, large investors had accumulated over $4 billion worth of BTC, while long-term investors added 150,000 BTC to their holdings. This reduction in supply is driving prices higher.
On the Bitcoin mining front, an important indicator has caught attention. According to Blockware, the average production costs for miners are now close to the current BTC price. Historical data suggests that when this happens, it often signals the start of a bull rally following market bottoms.
Macroeconomics, Global Liquidity Conditions May Also Support Bitcoin
Bitcoin’s long-term price outlook closely follows global liquidity cycles. As 2025 begins, declining risk appetite due to Trump’s trade policies led to selling pressure in the first quarter. However, the tendency of the US and other major central banks to return to loose monetary policies is helping direct capital into alternative investments, such as crypto assets.
Meanwhile, the presence of ETFs is allowing this new capital to impact the BTC price much more quickly than before. In the derivatives markets, there is also significant interest in $100,000 call options. According to data from Coinglass and Deribit, the highest open interest is at this level, indicating that $100,000 is both a strong psychological resistance and a price point investors expect to surpass.
Bitcoin Technical Outlook
These positive developments for Bitcoin also align with the technical outlook. Last week, the cryptocurrency saw a critical breakout, moving away from support levels with strong momentum.
This week, Bitcoin broke an important resistance level in the $93,000–95,000 range. The next resistance point is around $99,500 (Fib 0.786), just below the $100,000 mark.
Breaking the resistance at Fib 0.618, where Bitcoin has been flat since April 23, signals strong positive momentum. A similar pattern occurred in mid-April when the cryptocurrency broke resistance in the $83,000–85,000 range. If the momentum continues, it could enter the $100,000 range and push towards $106,000. This move could trigger the search for new highs. Additionally, the upward shift in short-term moving averages since mid-April is a bullish signal in this scenario.
While technical and fundamental indicators are currently positive for Bitcoin, support levels will be crucial if the market experiences a profit-taking pullback. On the daily chart, the $94,200–94,500 zone is likely to act as the first support in a potential backtest. If this support level is breached, the price may fall further to the $90,500–91,000 area.
Looking at the broader picture, Bitcoin ended its downtrend by breaking through $83,000. Then, with a move to $87,000, it signaled the end of the short-term consolidation phase. These two moves strongly indicated a trend reversal. While the current uptrend remains intact, it is likely to maintain its upward momentum as long as it stays above $95,000 and is supported by positive developments. In the near future, $100,000 is expected to act as a key psychological resistance level.
****
Be sure to check out InvestingPro to stay in sync with the market trend and what it means for your trading. Whether you’re a novice investor or a seasoned trader, leveraging InvestingPro can unlock a world of investment opportunities while minimizing risks amid the challenging market backdrop.
Subscribe now and instantly unlock access to several market-beating features, including:
- ProPicks AI: AI-selected stock winners with a proven track record.
- InvestingPro Fair Value: Instantly find out if a stock is underpriced or overvalued.
- Advanced Stock Screener: Search for the best stocks based on hundreds of selected filters and criteria.
- Top Ideas: See what stocks billionaire investors such as Warren Buffett, Michael Burry, and George Soros are buying.
Disclaimer: This article is written for informational purposes only. It is not intended to encourage the purchase of assets in any way, nor does it constitute a solicitation, offer, recommendation or suggestion to invest. I would like to remind you that all assets are evaluated from multiple perspectives and are highly risky, so any investment decision and the associated risk belongs to the investor. We also do not provide any investment advisory services.


