

Bitcoin’s (BTC) price drop has accelerated, with the cryptocurrency slipping below $60,000 at some point in the last 24 hours, and analysts are projecting further losses.
Technical indicators suggest that the maiden cryptocurrency is flashing a series of concerning signals pointing to a significant decline in value.
In a TradingView post on August 4, crypto trading expert Alan Santana noted that Bitcoin is likely heading for much lower levels before it can expect new highs or significant growth.
One of Santana’s most alarming indicators is the bearish divergence on Bitcoin’s weekly Relative Strength Index (RSI). Bitcoin is exhibiting a striking divergence that has been developing over three years.
Specifically, the RSI made a lower high in 2024 than in 2021, despite Bitcoin’s price showing higher highs during the same period. This discrepancy between price action and RSI is a classic bearish signal, suggesting that the underlying momentum driving Bitcoin’s price upward has weakened considerably.
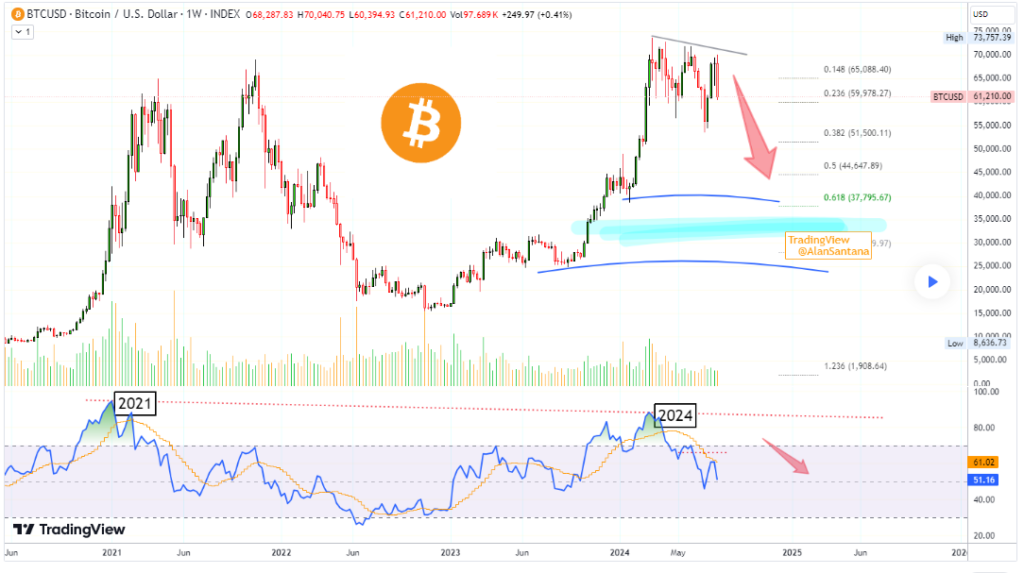
Adding to the bearish outlook, Bitcoin’s weekly RSI is trending downward, with a reading of 50.6. This is significant as it indicates that the long-term RSI is about to turn bearish for the first time since August 2023.
More notably, coming from a major high, this bearish shift in the RSI is the first since November 2021. According to the expert, such a development typically precedes a prolonged downturn, reflecting a loss of bullish momentum and the potential for substantial price declines.
“Doom signal? It is only doom if you are not prepared. On top of the bearish divergence we have Bitcoin’s weekly RSI trending full down with a reading of 50.6. This, and other signals, is telling us that there is room for lower prices; much lower, before we experience new highs and boom growth,” the expert stated.
Bitcoin’s key levels to watch
At the moment, Bitcoin’s price appears to form a descending triangle pattern, a bearish formation that often precedes further declines. Critical support levels to watch include the 0.618 Fibonacci retracement level around $37,795 and the 200-week moving average, which could act as potential downside targets.
Additionally, decreasing volume on upward price movements suggests weakening buying interest, adding to the bearish case.
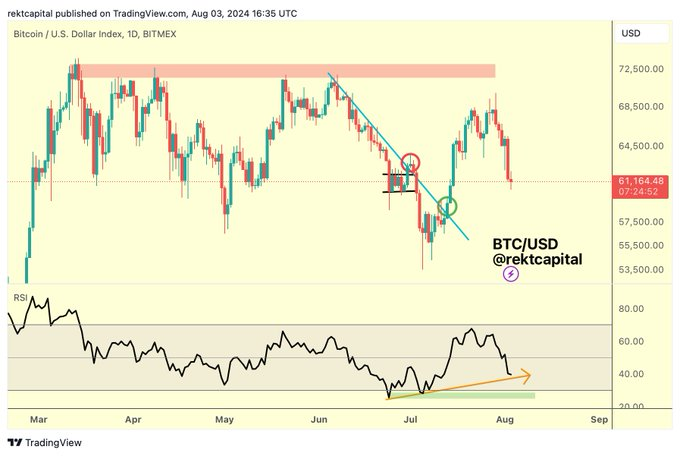
At the same time, another analyst, Rekt Capital, in an X post on August 3, also noted that the current Bitcoin RSI readings will likely dictate the extent of additional downside.
“Bitcoin is getting really close to this RSI Higher Low trendline. It will dictate the extent of additional downside,” the expert said.
It’s worth noting that Bitcoin also took a hit following troubling signs in the United States economy. Indeed, investors will be looking at strategies implemented by the Federal Reserve to rescue the economy, as this will dictate Bitcoin’s trajectory.
Bitcoin price analysis
At press time, Bitcoin was trading at $60,868, having plunged 1.5% in the last 24 hours. On the weekly timeframe, Bitcoin is down over 10%.
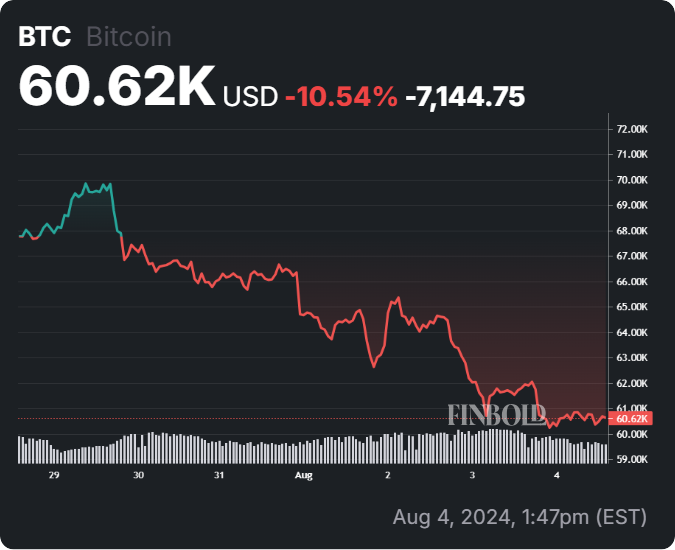
Overall, Bitcoin looks bearish, and the bulls’ ability to sustain the price above the $60,000 support will be key to reducing any further losses.
Disclaimer: The content on this site should not be considered investment advice. Investing is speculative. When investing, your capital is at risk.


