


According to an X post by crypto trader Merlijn The Trader, Bitcoin (BTC) is following the ‘megaphone pattern’, positioning the top cryptocurrency for potential upside momentum. However, BTC must stay above the $72,000 price level for the pattern to play out.
Bitcoin Following Megaphone Pattern – Time To Buy?
Earlier today, BTC tumbled below the critical $80,000 price level, hitting a low of $78,390 on the Binance cryptocurrency exchange. At the time of writing, the flagship digital asset has a total market cap of $1.57 trillion.
Despite the recent slump, crypto analysts remain confident in BTC’s long-term bullish outlook. Sharing a monthly trading chart, Merlijn The Trader highlighted that Bitcoin is following the broadening wedge, also known as the megaphone pattern.
For the uninitiated, the megaphone pattern, or broadening wedge, is a technical chart formation where Bitcoin’s price exhibits higher highs and lower lows, creating an expanding shape. This pattern signals increasing volatility and market indecision, typically preceding a strong breakout or breakdown.
While there is a risk of BTC breaking down from its current range, historical trends suggest that the digital asset is likely to break out to a higher price range. The chart shows how BTC has historically broken to the upside – highlighted in green – from previous market cycle tops, successfully re-tested the breakout, and then entered a parabolic phase.
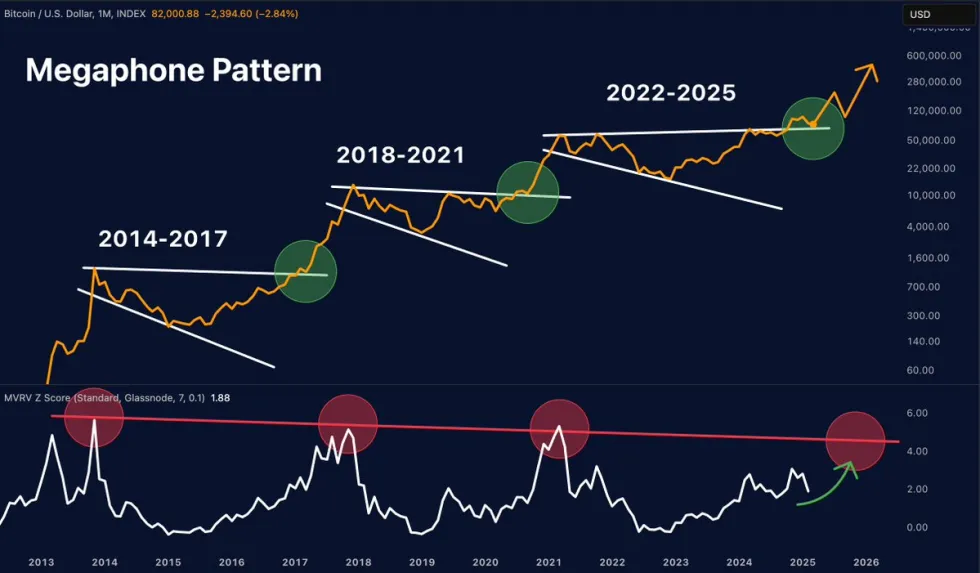
The chart also highlights that market cycle tops have typically coincided with an MVRV Z-Score trendline. Currently, the MVRV Z-Score is well below the red trendline, suggesting that BTC may still have room to rise before any significant correction.
To explain, the MVRV Z Score for Bitcoin is a metric that compares the market value of BTC to its realized value, helping to identify overbought or oversold conditions. A high MVRV Z-score suggests Bitcoin may be overvalued, while a low score indicates it could be undervalued.
According to the chart, BTC’s current MVRV Z-Score is around 2. In the last three market cycles, this score has typically topped slightly above 4.
BTC Remains In Volatile Territory
Despite US President Donald Trump following through on his promises of creating a favorable regulatory environment for cryptocurrencies and establishing a Strategic Bitcoin Reserve (SBR), the digital asset’s price has failed to reflect the positive developments.
Experts believe that escalating tariff tensions and the possibility of a potential economic recession may be negatively affecting BTC’s price action. Coinbase analysts attribute BTC’s recent slump to the “absence of positive catalysts.”
Further, crypto analyst Ali Martinez recently remarked that BTC may face further downside to $75,000 before it finds relief from the ongoing price correction. At press time, BTC trades at $78,500, down 4.5% in the past 24 hours.

Featured Image from Unsplash.com, Charts from X and TradingView.com
Editorial Process for bitcoinist is centered on delivering thoroughly researched, accurate, and unbiased content. We uphold strict sourcing standards, and each page undergoes diligent review by our team of top technology experts and seasoned editors. This process ensures the integrity, relevance, and value of our content for our readers.


