

As Bitcoin (BTC) continues to consolidate in the zone around $60,000, the status quo could potentially extend for another several months, considering that the relative strength index (RSI) of the flagship decentralized finance (DeFi) asset has hit its most oversold level in over 300 days.
Specifically, Bitcoin has just hit the RSI of 30, which last time happened in September 2023, preceding a period of over three months of consolidation just below the key resistance at $30,000, according to the observations shared by pseudonymous cryptocurrency analyst Jelle in an X post on June 27.
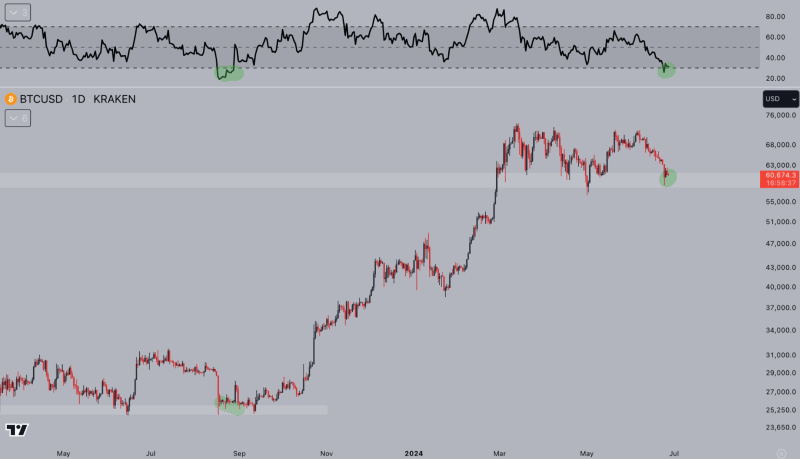
Taking this previous chart pattern into consideration, the crypto market expert pointed out that if history repeats itself this time around, the largest asset in the crypto sector by market capitalization could be looking at more than three months of consolidation below $70,000.
However, after these “months of chop,” followed by a “capitulation into key support,” are over, Jelle argues that “true moon would make sense ngl,” as he added in a comment below his X post, further specifying that the maiden crypto asset was already very near key supports.
Bitcoin price analysis
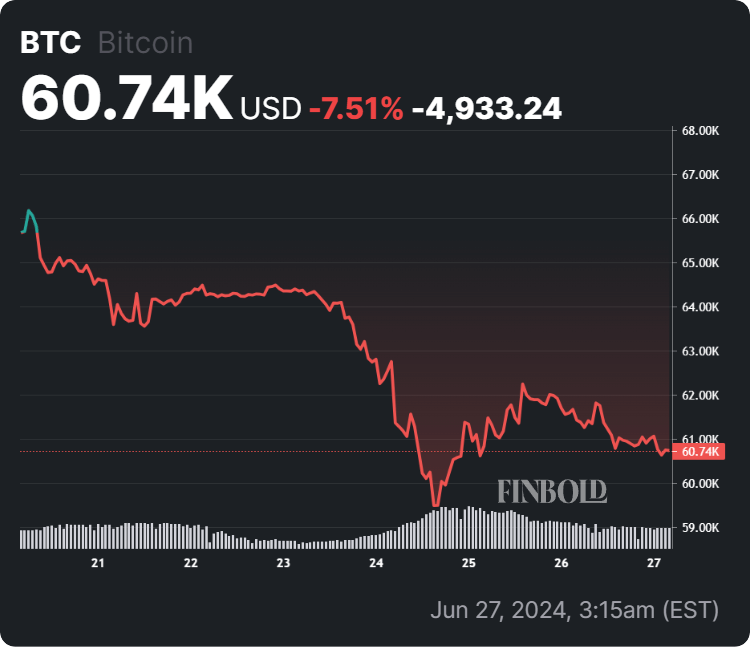
For the moment, Bitcoin is changing hands significantly below the suggested consolidation level, with its price currently standing at $60,740, which indicates a decline of 1.26% in the last 24 hours, a 7.51% drop across the previous seven days, adding up to the accumulated loss of 10.74% on its monthly chart.
Meanwhile, whales and other crypto traders are taking the opportunity to ‘buy the dip’ while the price of Bitcoin is still relatively low before it inevitably booms to the levels predicted by many market experts, ranging from $100,000 this year to millions in the next several years.
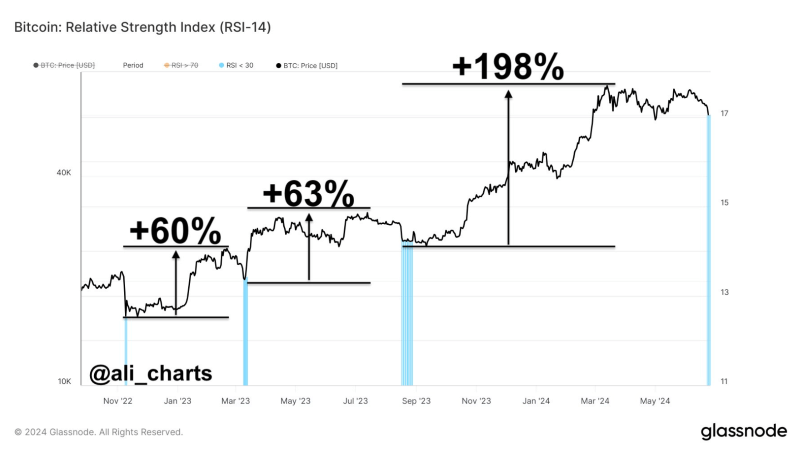
Indeed, one of the predictors for the future price performance of the original cryptocurrency has been none other than the RSI indicator, which professional crypto trader Ali Martinez pointed out was suggesting that now was the ideal time to buy the Bitcoin dip, as Finbold reported on June 26.
That said, the winds in the crypto waters can easily change and push the sails in an unexpected direction, so doing one’s own research and keeping up with any relevant developments is critical when investing in assets like Bitcoin, despite things certainly looking bullish for its future price performance.
Disclaimer: The content on this site should not be considered investment advice. Investing is speculative. When investing, your capital is at risk.


