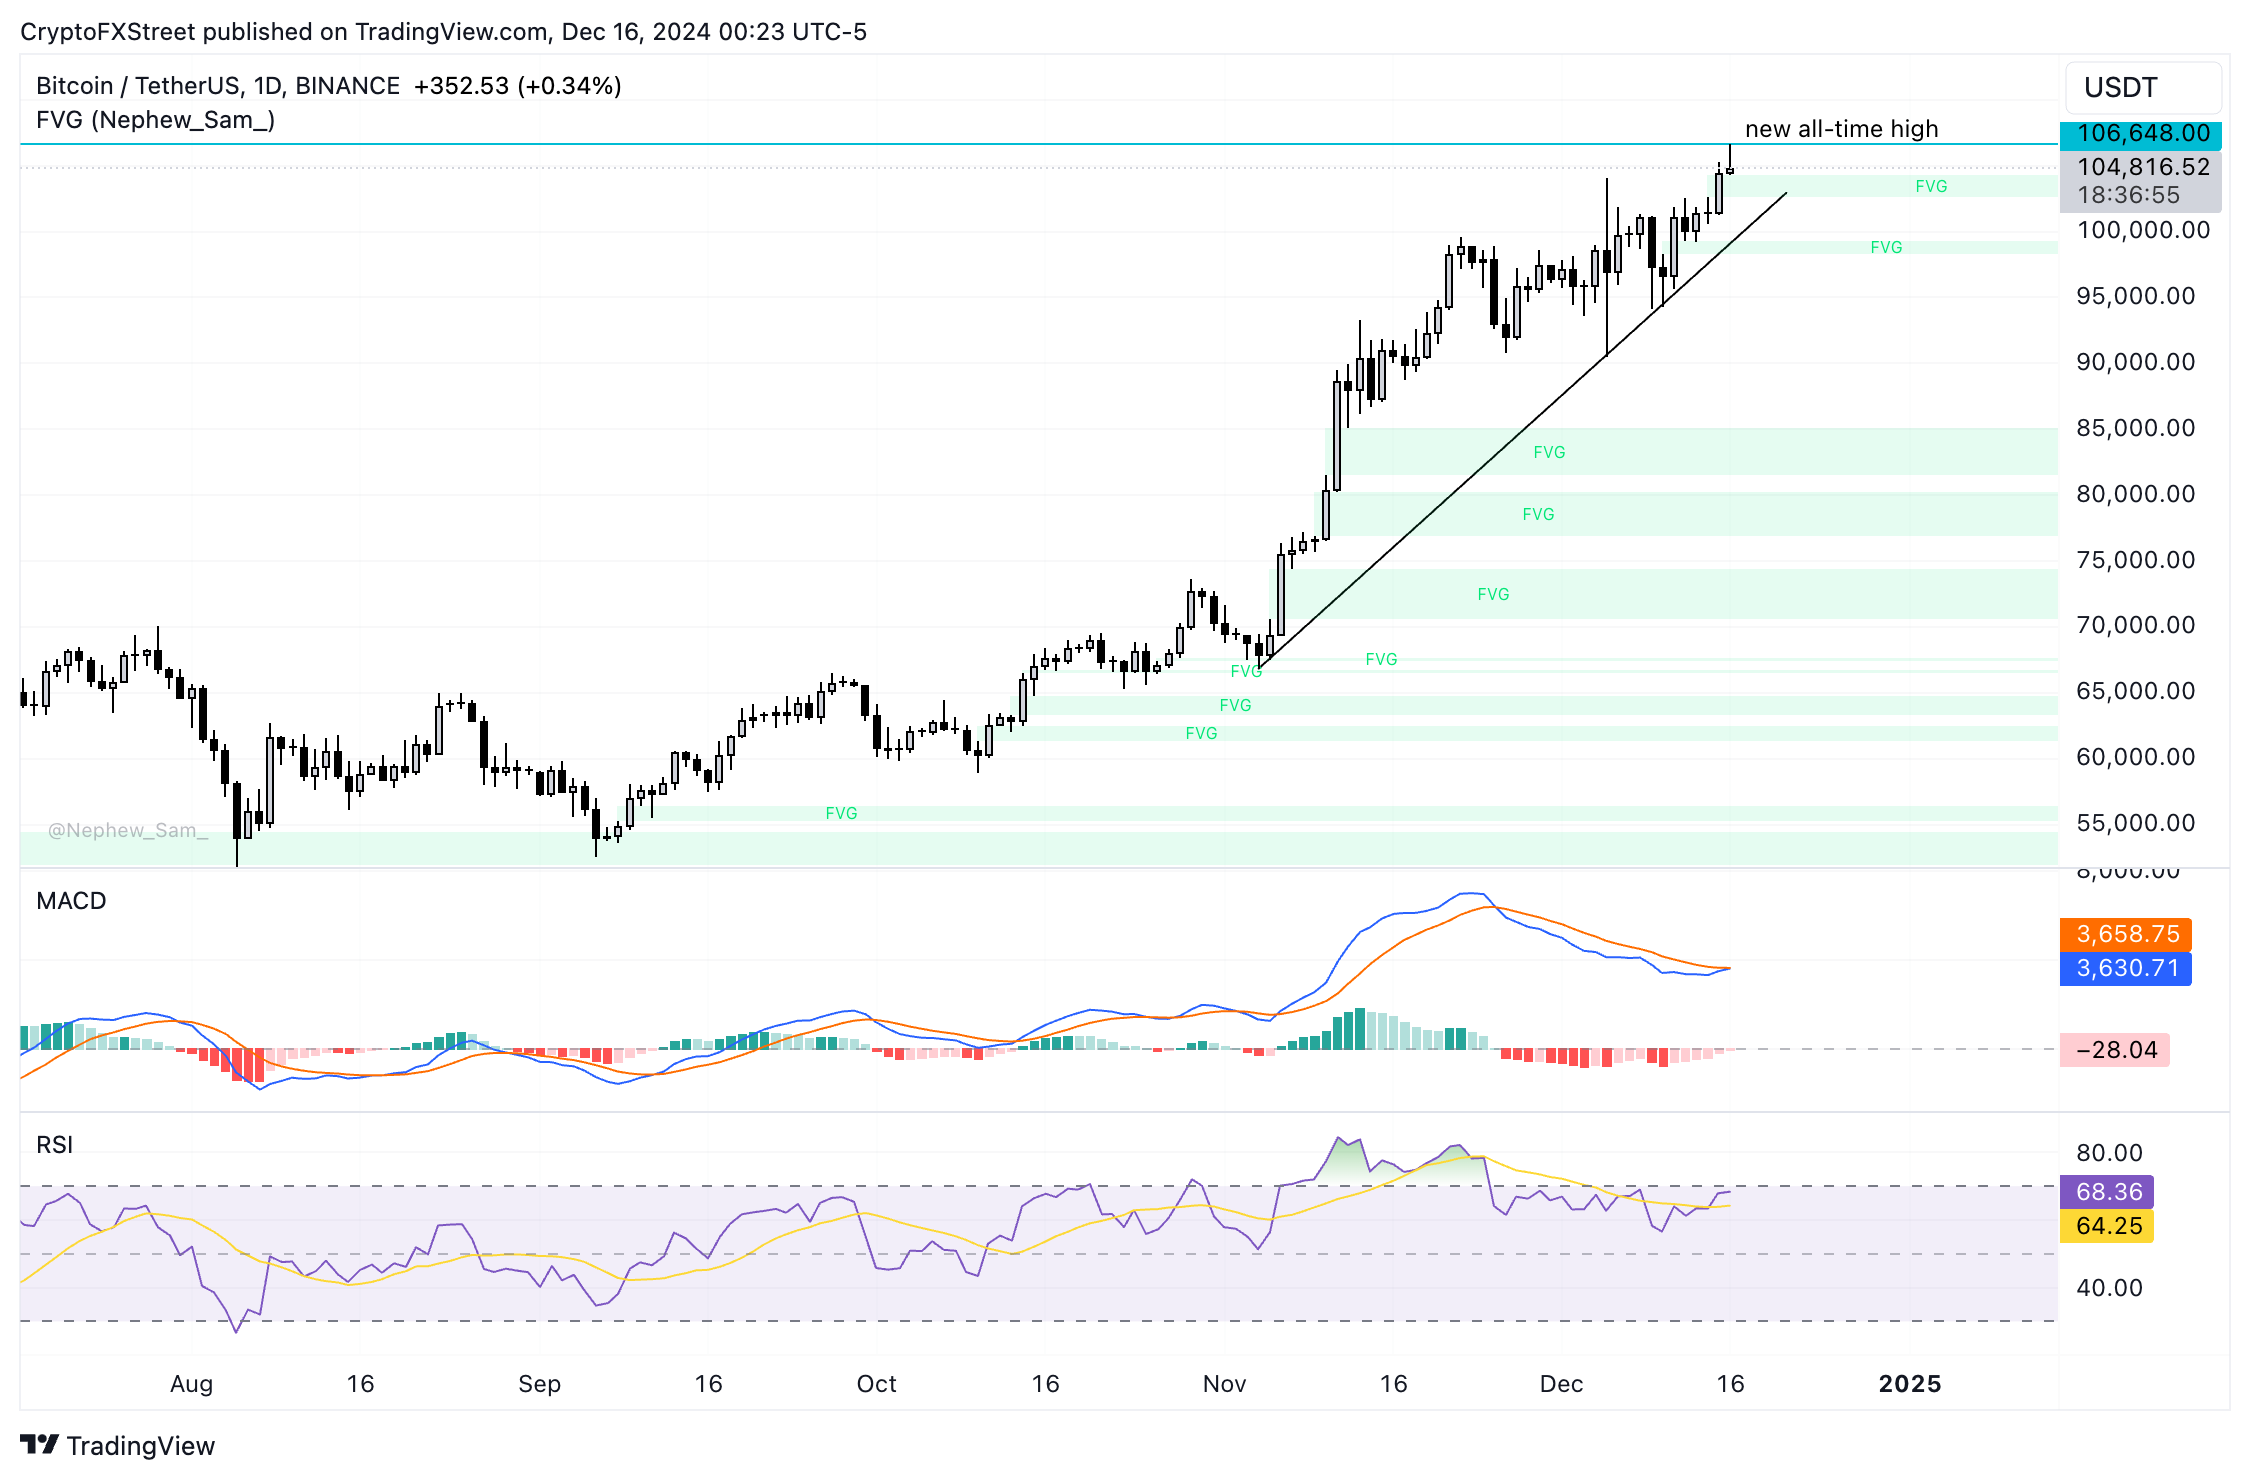
- Bitcoin breaks its previous all-time high on Monday, reaches a high of $106,648.
- Nearly $120 million in derivatives positions were liquidated per Coinglass data.
- Analyst says Bitcoin is in blue-sky territory and BTC’s next target could be $110,000.
Bitcoin hit a record high above $106,000 on Monday, after recent developments on President-elect Donald Trump’s strategic Bitcoin reserve and demand from institutional traders.
The Bitcoin fear and greed index, a gauge for the sentiment among traders reads 83, on a scale from 0 to 100, signaling “extreme greed” among traders. This is consistent with the sentiment last week and last month.
Analysts remain bullish on BTC, set a $110,000 target for the largest cryptocurrency, while it is in the “blue sky” territory, meaning while the token breaks above its previous all-time high.
Bitcoin’s rally to $106,648 ushers nearly $120 million in liquidations
Bitcoin surged a record high of $106,648 in the early hours of Monday. The rally is largely driven by institutional demand, evident from consistent inflows to Bitcoin ETFs all week. President-elect Donald Trump commented on his strategic Bitcoin reserve and said that the U.S. will do something great with crypto, last week.
Bitcoin’s market capitalization crossed $2.071 trillion and the largest crypto token pulled back slightly to trade at $104,773, at the time of writing.
Most altcoins ranked within the top 100 cryptocurrencies by market capitalization have recovered from their correction over the weekend and observed slight gains on the day.
Coinglass data shows that over $118 million in derivatives positions were liquidated in response to Bitcoin’s new all-time high.
Tony Sycamore, a crypto analyst told Reuters,
We’re in blue sky territory here. The next figure the market will be looking for is $110,000. The pullback that a lot of people were waiting for just didn’t happen, because now we’ve got this news.
Where is Bitcoin headed?
Bitcoin is trading nearly 2% below its new all-time high. The largest cryptocurrency is in an upward trend as seen in the BTC/USDT daily price chart. The Fair Value Gap (FVG) between $102,650 to $104,259 could act as a support zone for Bitcoin if there is further pullback in the asset.
Momentum indicator, Relative Strength Index (RSI) reads 68. RSI is below 70, a break above this would typically generate a sell-signal for Bitcoin. Moving Average Convergence Divergence (MACD) flashes red histogram bars under the neutral line, meaning the underlying momentum in Bitcoin price is negative.
However, traders need to keep their eyes peeled, as this could change. As the MACD line crosses above the signal line, likely on the daily timeframe, it could signal a reversal in momentum.
BTC could enter price discovery above its $106,648 peak and target $131,252, the 161.80% Fibonacci retracement of the rally from the November 4 low of $68,835 to the new-time high on Monday.
BTC/USDT daily price chart
The 78.6% Fibonacci retracement level at $98,128 could act as a support in the event of a pullback.


