

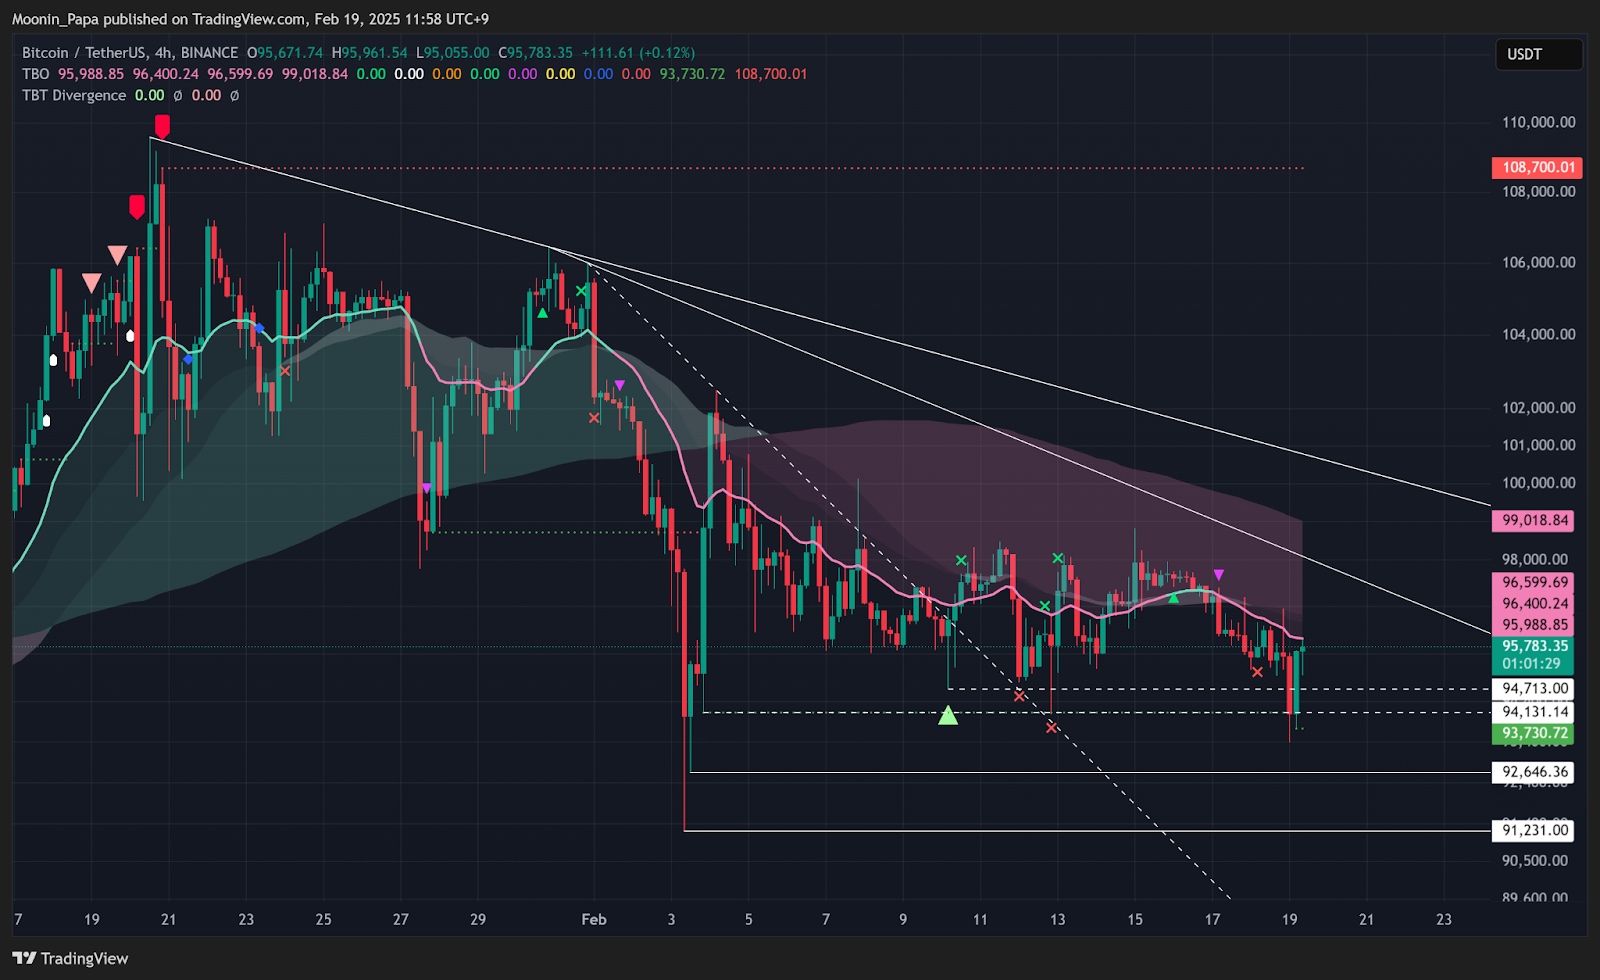
Bitcoin dropped to TBO Support at $93K on the 4-hour chart but snapped back up. The past four days have steadily pushed BTC lower, with ~$98K being the next resistance level in the current downtrend. Unfortunately, 4-hour OBV broke support, signaling weakness. Without more consecutive green candles, BTC risks sliding back down to $91K.

On the daily timeframe, BTC remains trapped in a choppy range. Daily RSI has been clinging to the first overhead resistance line, struggling to push higher. BTC needs a strong green candle close to gain upward momentum and drive RSI higher. Volume remains low, which is a concern, as low volume combined with prolonged chop tends to result in lower lows.
Ethereum Prints Another Bullish Divergence Signal

ETH is in the process of printing a second TBT Bullish Divergence signal on today’s daily candle. While it’s still too early to call a confirmed reversal, this is a strong bullish signal. Additionally, daily RSI has held above previously broken resistance. If confirmed, this could set the stage for a larger ETH rebound.
Solana FUD Creates a Buying Opportunity

The ongoing $LIBRA controversy and its fallout have been a major driver of recent market drawdowns, particularly affecting Solana ($SOL). However, the FUD seems overblown. SOL is merely the technology used for these meme coin launches, while the real issue lies with the bad actors exploiting it.

Despite the fear, smart money is buying the dip while late traders are piling into short positions, making a short squeeze increasingly likely. On the 4-hour chart, RSI made a higher low during yesterday’s -6.89% drop, a bullish reversal signal. While the 4-hour TBO remains bearish, the daily chart presents a different picture. The TBO Slow Line is still angling upward, and price is extremely over-extended from the daily TBO Fast Line. This signals that SOL is due for a bounce, though the recovery will likely be gradual rather than immediate.
Stablecoin and Bitcoin Dominance React to Market Fear
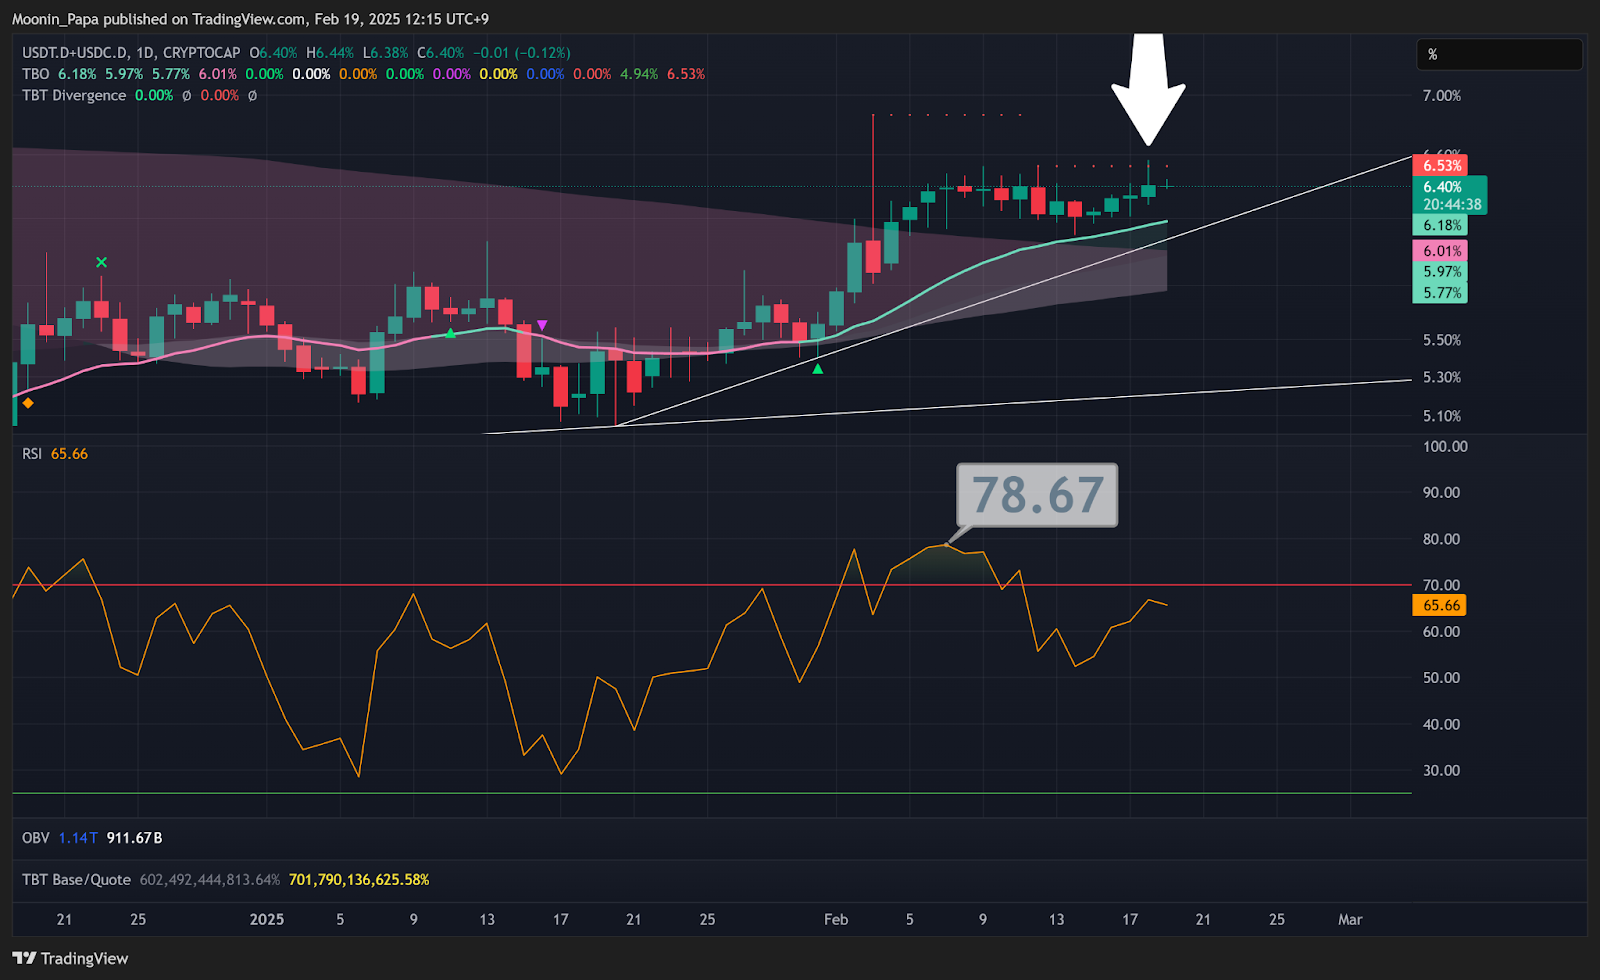
Stablecoin dominance increased slightly yesterday due to heightened fear and FUD, pushing RSI higher. However, RSI is expected to top out near 70 before retracing, indicating a likely reversal and decline in stablecoin dominance.
![]()
Bitcoin Dominance (BTC.D) also rose by 1% as traders rotated out of ALTs into BTC. While this signals relative strength in BTC, the preferred scenario would be for BTC.D to drop back to the green support line, allowing ALTs to regain dominance.
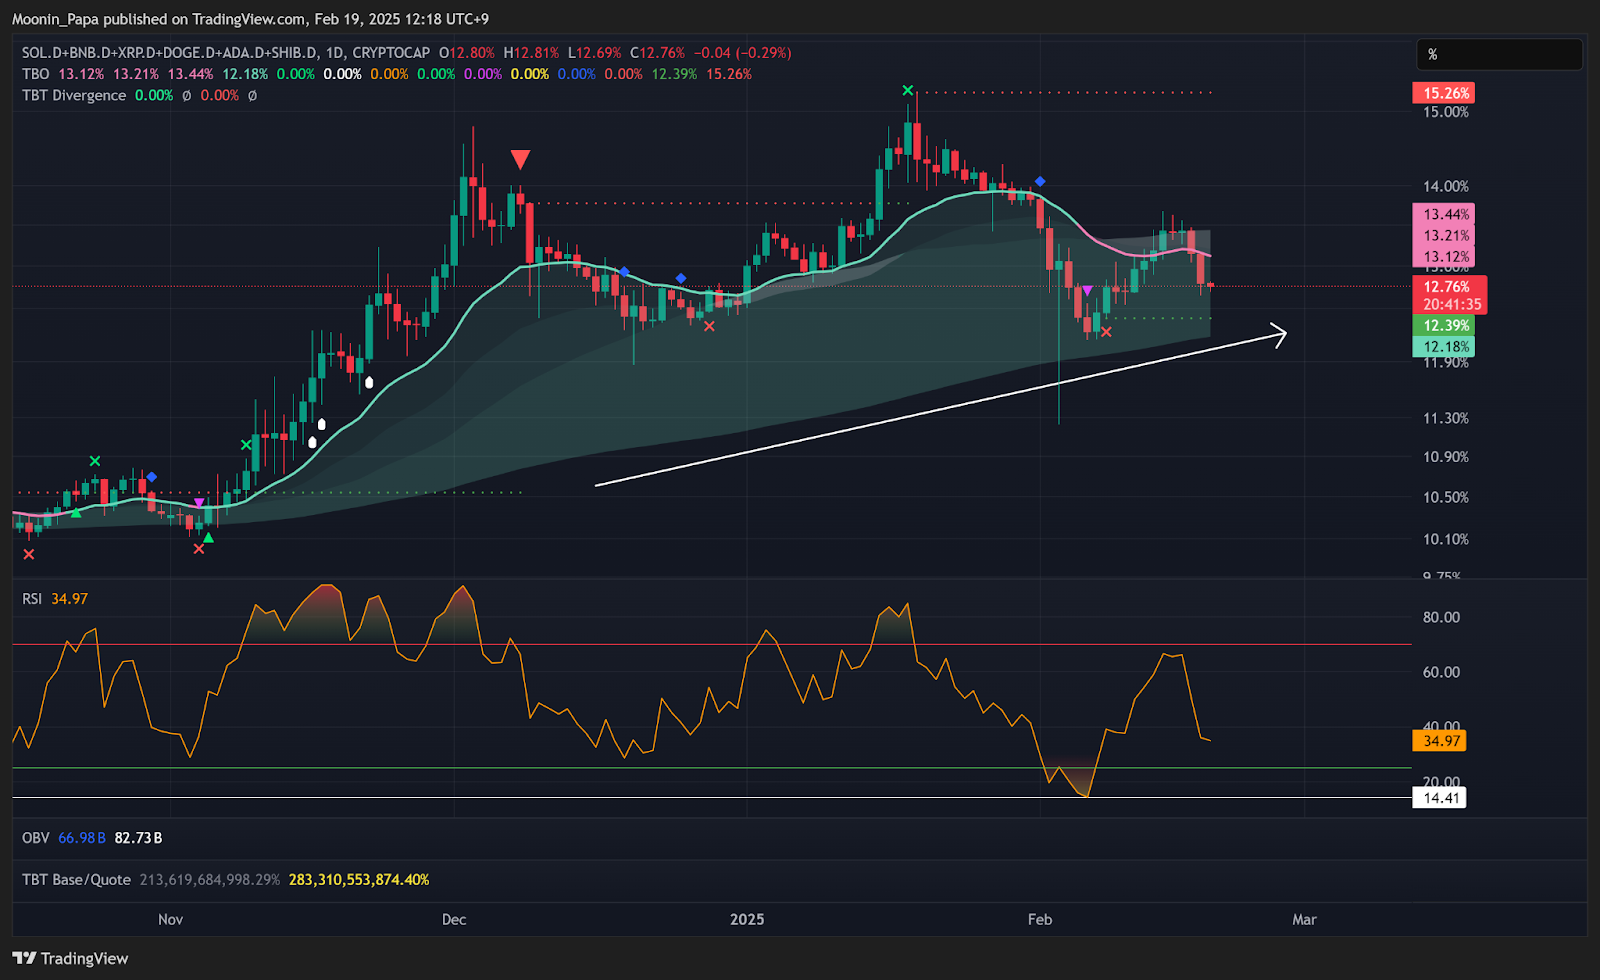
The Top 10 Dominance chart is heavily oversold on both the 4-hour RSI and price action, largely due to SOL’s weakness. However, zooming out to the daily TBO Slow Line confirms that the broader trend remains intact, reinforcing confidence in buying the dip.
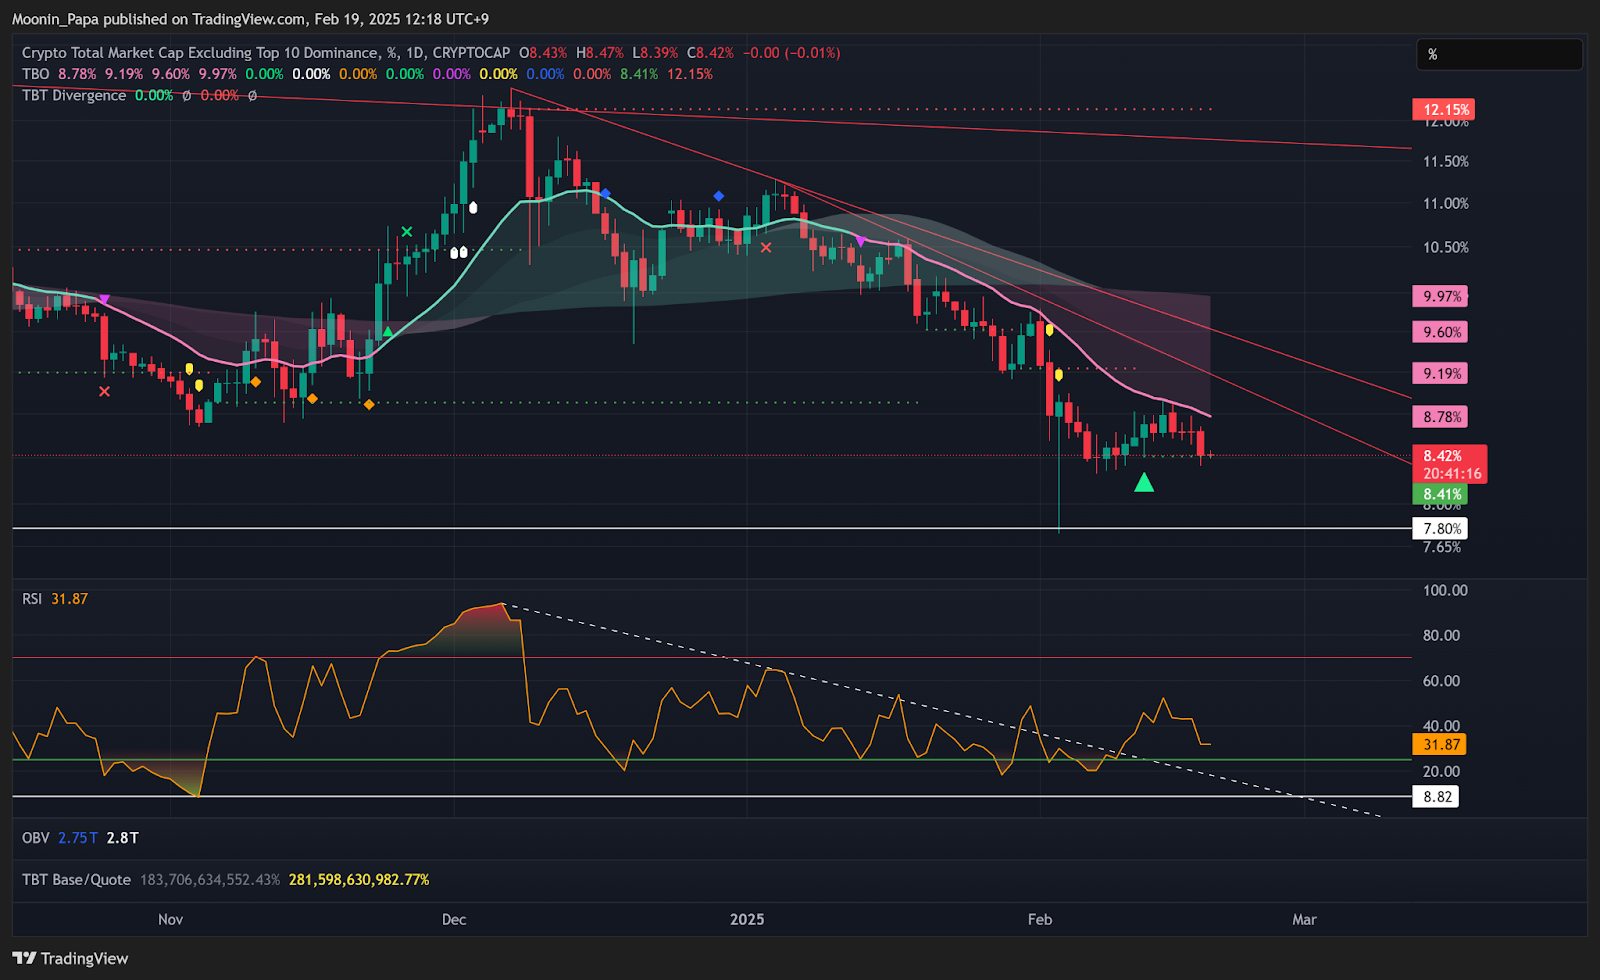
OTHERS Dominance (representing smaller altcoins) is taking the biggest hit, especially SOL-based coins. The OTHERS market cap chart is approaching key support again, with hopes of bouncing off the trendline in what remains a broader bullish pennant. Historically, there have been more upside tests than downside pierces, suggesting a higher likelihood of recovery.
Volatility Indicator Signals Imminent BTC Move
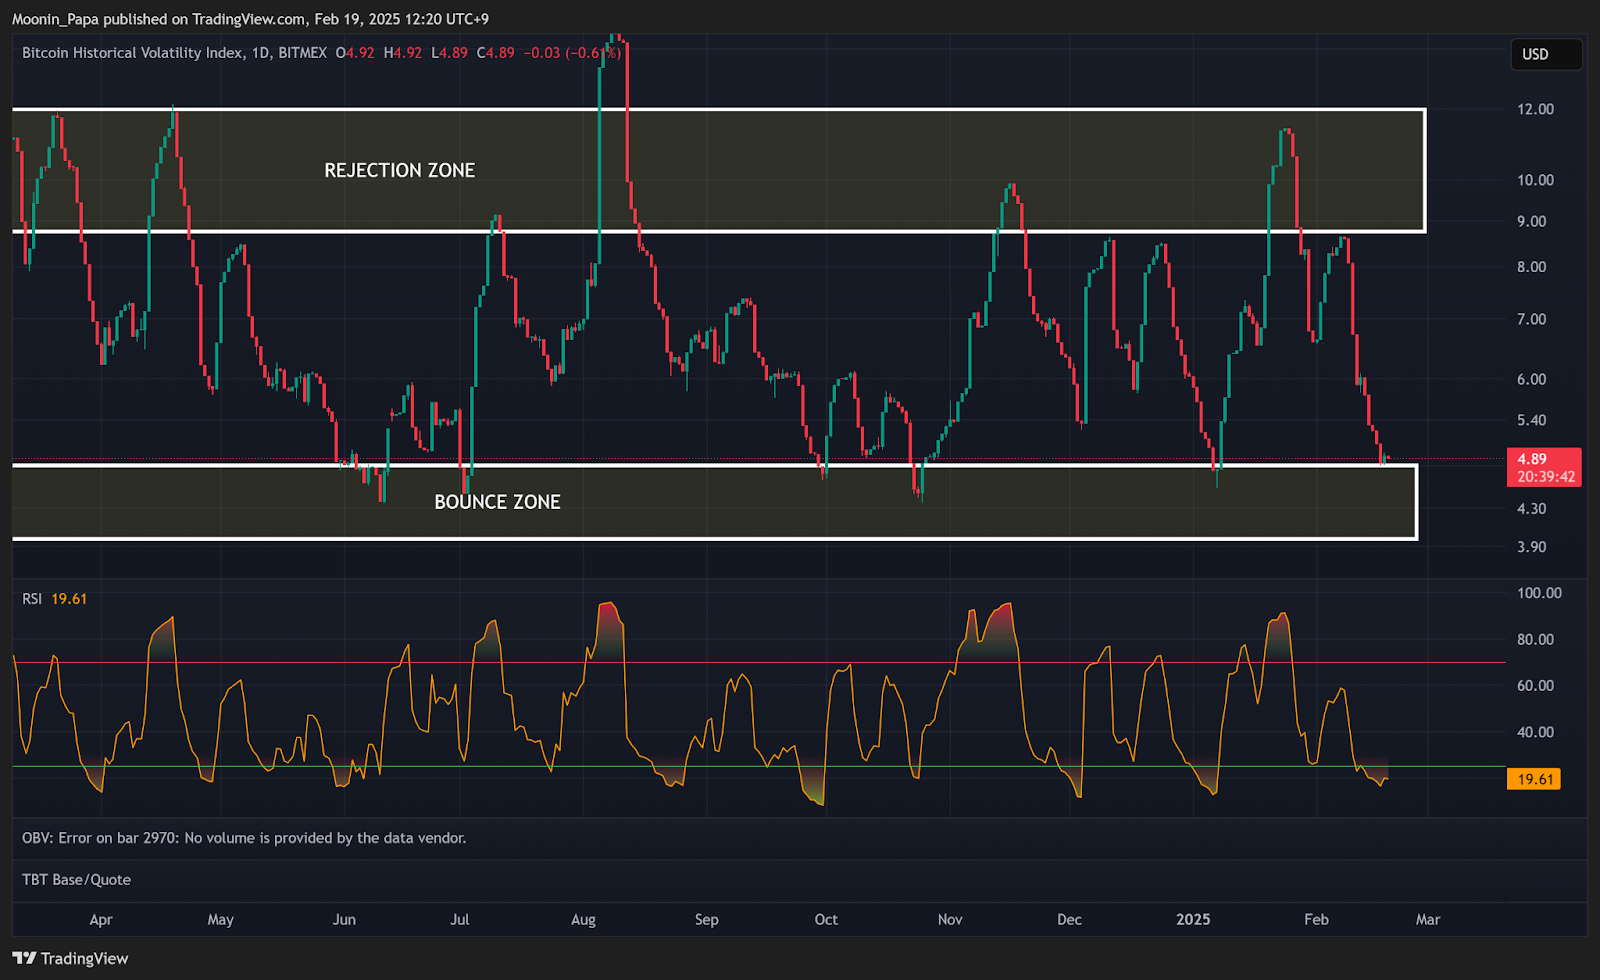
BVOL7D has returned to the Bounce Zone, where it typically spikes back up into the Rejection Zone, signaling increased BTC volatility in either direction. The market is on edge, and the next big move could determine the short-term trend.
Meanwhile, TradFi markets continue to rally. The S&P 500, Nasdaq, and FANG index all hit new all-time highs yesterday, while Gold also pushed higher. However, Gold’s daily RSI did not mirror the price strength, indicating early signs of a potential slowdown.
Select Altcoins Show Signs of Reversal
- APT continues to struggle with overhead resistance, unable to break through.
- LTC remains a strong trading candidate with steady price action.
- TAO printed another TBO Close Short 🔶 on the 4-hour, likely leading to another test of overhead resistance.
- XMR continues to perform well as a trading asset.
- MNT saw an unusual 10% run-up yesterday, only to give it all back—suggesting manipulated price action.
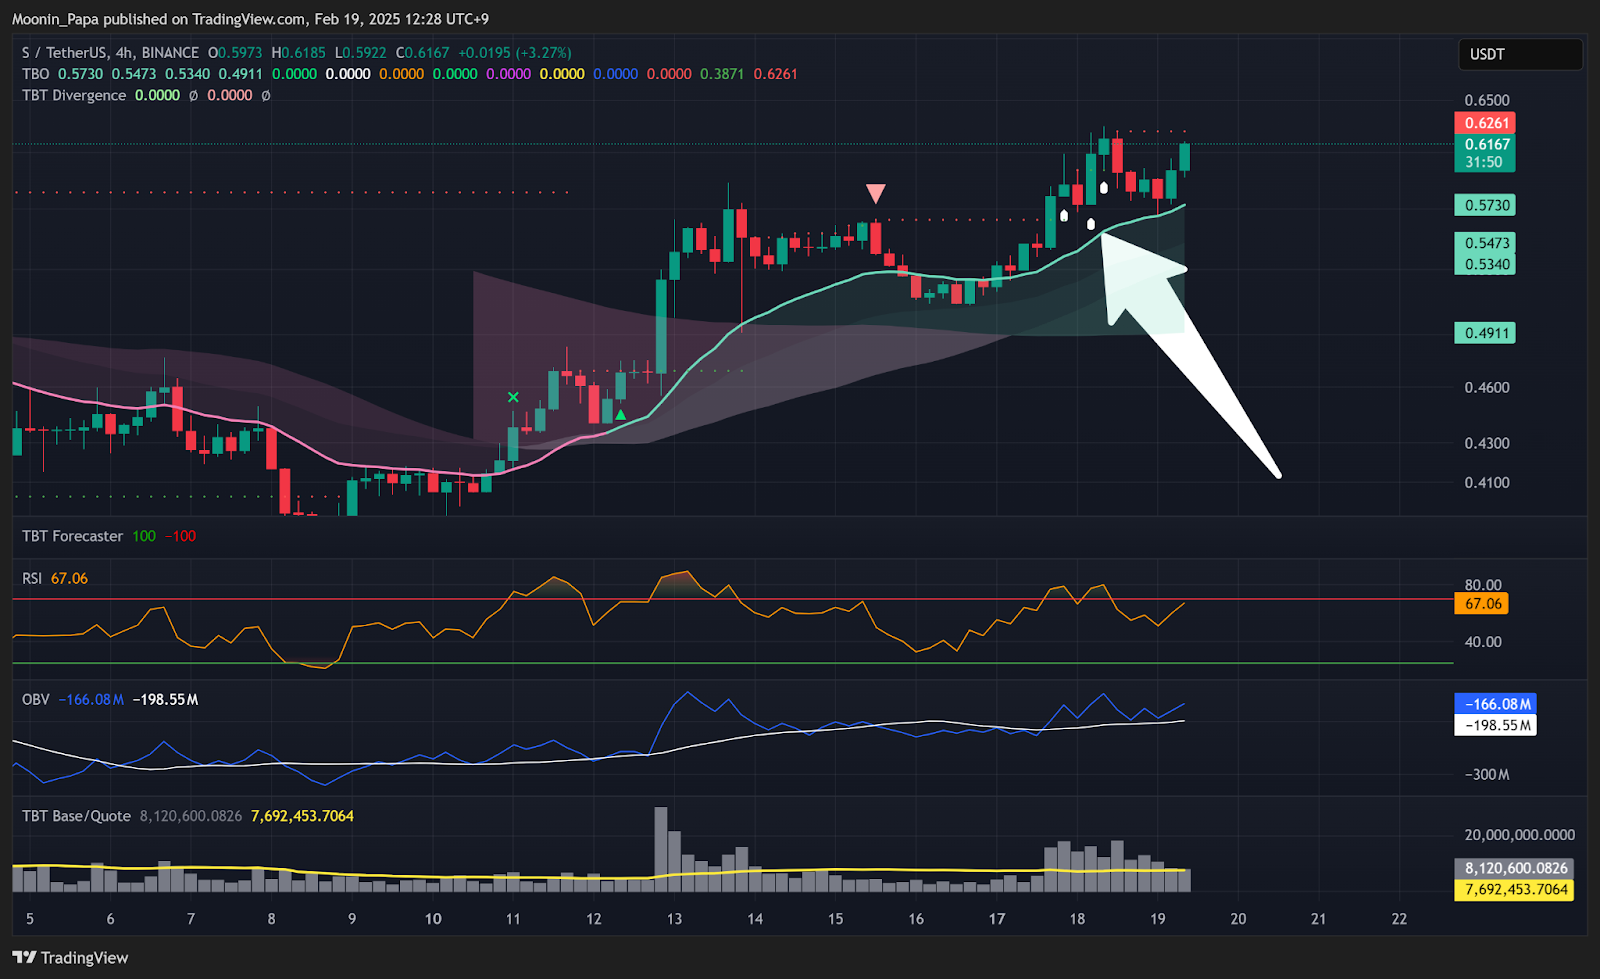
One of the more interesting developments was S (previously FTM) printing a TBO Breakout cluster on the 4-hour timeframe, which no other chart is currently showing.
- JUP is oversold but holding long-term daily TBO Support at $0.68.
- MKR looks very strong on the daily timeframe and is in the process of printing a TBO Close Short 🔶, another early reversal signal.
This period of chop has been frustrating, but it’s temporary. Once BTC regains momentum, the entire market will react accordingly.
To refine your crypto investment strategy and prepare for what’s ahead, check out The Complete Cryptocurrency Investor at Mastering Assets.
Disclaimer: The views expressed in this article are those of the author and may not reflect those of Kitco Metals Inc. The author has made every effort to ensure accuracy of information provided; however, neither Kitco Metals Inc. nor the author can guarantee such accuracy. This article is strictly for informational purposes only. It is not a solicitation to make any exchange in commodities, securities or other financial instruments. Kitco Metals Inc. and the author of this article do not accept culpability for losses and/ or damages arising from the use of this publication.
 on Easter")

