

photoman/iStock via Getty Images
The (almost) unbelievable drawdowns we’ve seen in risk assets this year has created a huge amount of pain for investors that have simply held through this bear market. Just about everything is in a bear market, including the traditional safe haven of US Treasuries. Growth has been thrown out the window, consumer discretionary has been awful, and forget about software or cloud stocks; many are down 80% or 90%. It is clear we’ve been in a risk-off environment for some time, but instead of crying over spilled milk, the rational thing to do is to search for what should outperform once this period is over. It may seem right now like the risk-off environment will never end, and I’ve seen a huge number of negative articles lately that spell out doom and gloom scenarios. However, when I look at the evidence, I see a high probability of risk-on coming back in vogue later this year, and potentially sooner than that.
If that’s the case, you would want to own exposure to as much growth as you can get your hands on, which means taking on risk. There are many ways to take on risk, including consumer discretionary, technology, cloud/software, etc. However, one way I think will perform extremely well later this year and into 2023 is Bitcoin (BTC-USD).
Anyone that reads my work knows I rely heavily upon technical analysis for my trading, and the reason is because it is objective, and more often than not, it works. In this article, we’ll take a look at three different time frames for Bitcoin price action and momentum, and draw some conclusions to a very simple question: “Is it time to buy Bitcoin?”
Bitcoin – Let’s look at the charts
We’ll start with a very long monthly chart that goes back to 2014. Of course, charting data for Bitcoin is fairly limited given it hasn’t been in existence that long, but this will do for our purposes as there are some interesting conclusions we can draw from this monthly chart.
StockCharts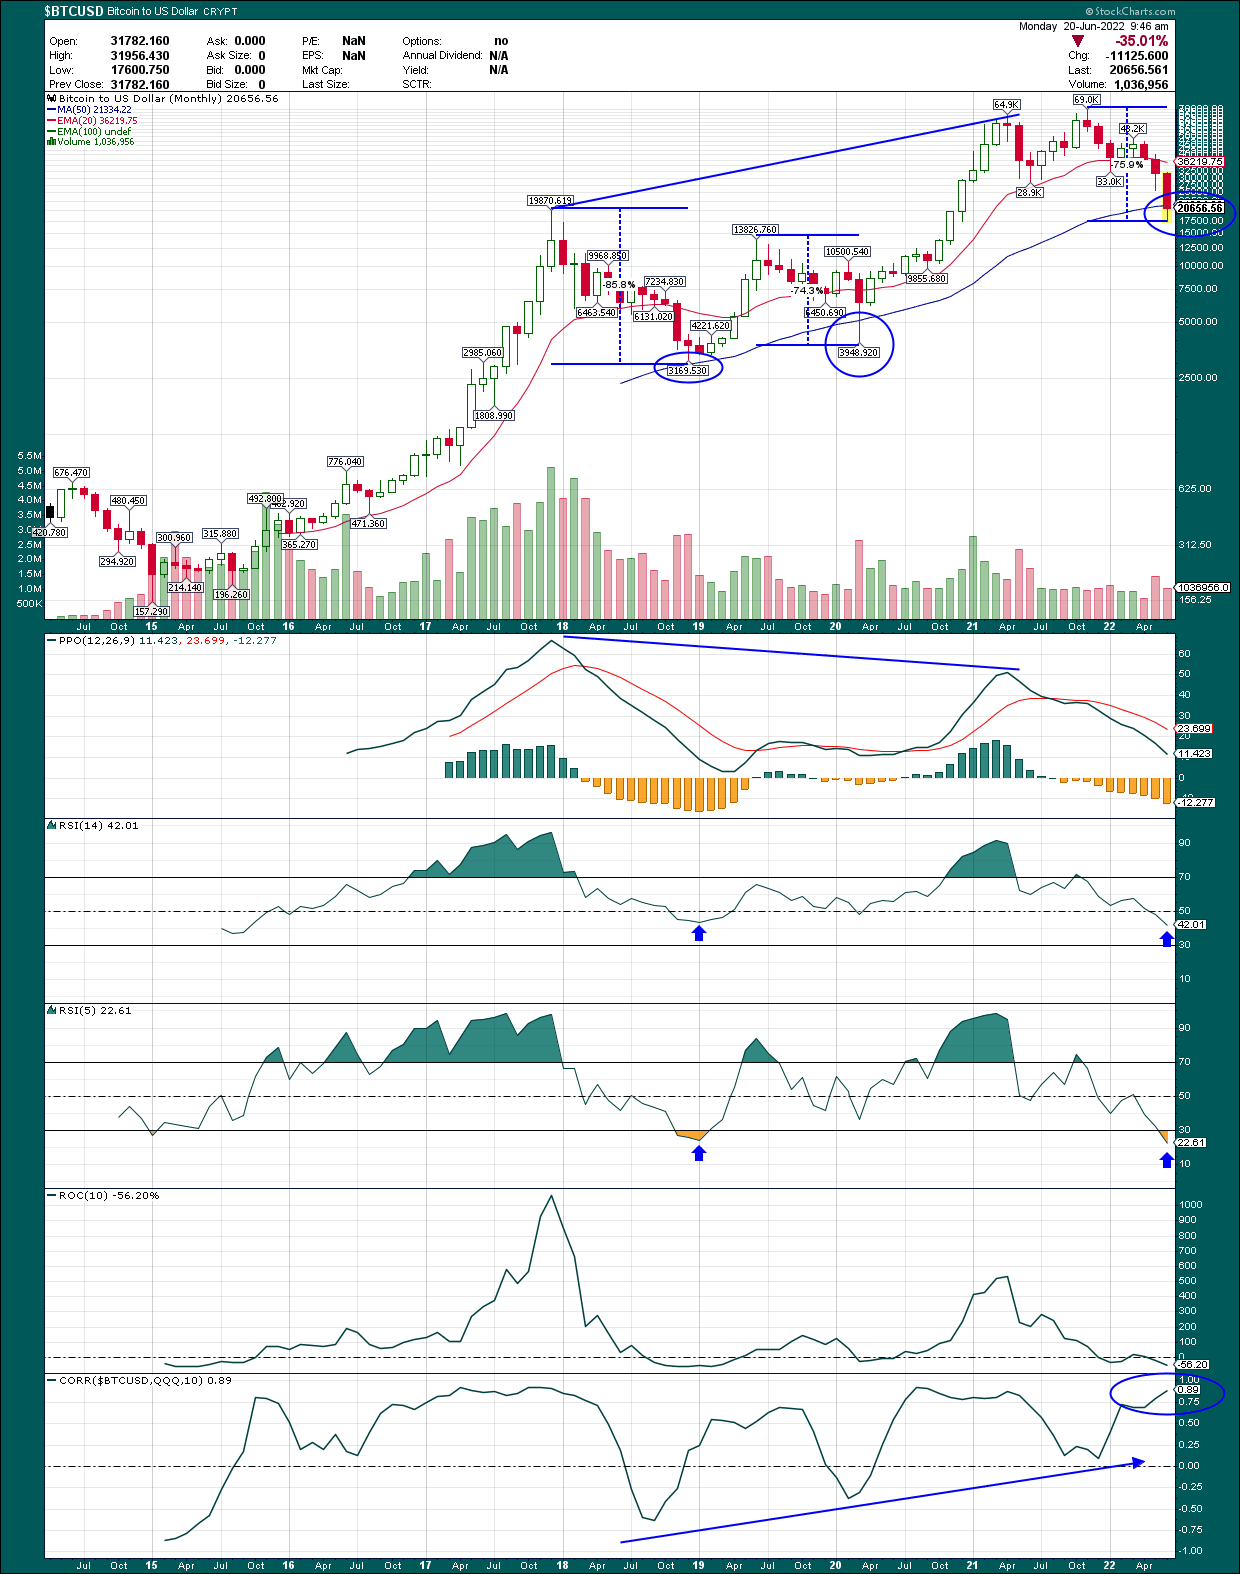
I’ve annotated several things, but let’s start with the price chart itself. I’ve made three ellipses, one for each time the price fell below the 50-month moving average. We did that earlier this month (June 2022), for the first time since the COVID panic of 2020. Before that, it was the trade war panic from 2018. The point is that 50-month MA being pierced to the downside is a very rare event, and something I take quite seriously. The reason, as you can see above, is that the prior instances led to huge rallies in Bitcoin, with the “weaker” of the two producing more than 300% returns in the space of a few months. Are we guaranteed that again? Of course not. However, that bit of evidence suggests buying Bitcoin now carries with it much less risk than periods where Bitcoin is rallying hard.
The second thing I noted on the price chart is the maximum drawdowns from peak to trough for the three times those 50-month MAs were pierced, with the first being ~85%, the second being ~75%, and the current cycle being ~75%. Again, does that mean we cannot go lower? No, but if history doesn’t necessarily repeat, it does rhyme. We’ve seen two prior bear markets draw down 75%+ while piercing the 50-month MA before enormous rallies. That makes me pay attention because we have almost exactly the same setup today.
If we turn our attention to the PPO, we can see a gigantic negative divergence that was put in place on the PPO just before the ATH was hit, and the coin subsequently rolled over into an epic bear market. The good news is this selloff has been of sufficient depth and length that the monthly PPO is pulling into the centerline, which is exactly what we want to see for a long-term “reset” of momentum. Now, we need it to stop falling at the centerline and move higher again, but for now, so far so good.
The shorter-term indicators of momentum – the 14-month and 5-month RSIs – are both showing the same sort of behavior as the other cycle bottoms as well. The 14-month is approaching 40, which is where it bottomed last time. Similarly, the 5-month is well into oversold territory at 22, which is very near where it bottomed in 2018. To me, the momentum picture very much supports the idea that we’re at or very near a long-term bottom in Bitcoin, from which a new, very sizable rally can launch.
Finally, the bottom panel shows the 10-month correlation of Bitcoin to QQQ, which is the Nasdaq 100 ETF. I plotted this to show that Bitcoin is just another risk asset these days, and should be traded as such. With the correlation of Bitcoin to growth/tech stocks at a staggering 0.89, Bitcoin should bottom with stocks and rally at the same time. However, I think the magnitude of gains is much higher potential with Bitcoin than stocks, even growth-oriented ones like QQQ.
To sum up the monthly chart, we have all the makings of a sustainable, cycle low that could be the launching pad to the next massive bull run.
Now, let’s take a look at the weekly chart for a somewhat shorter perspective.
StockCharts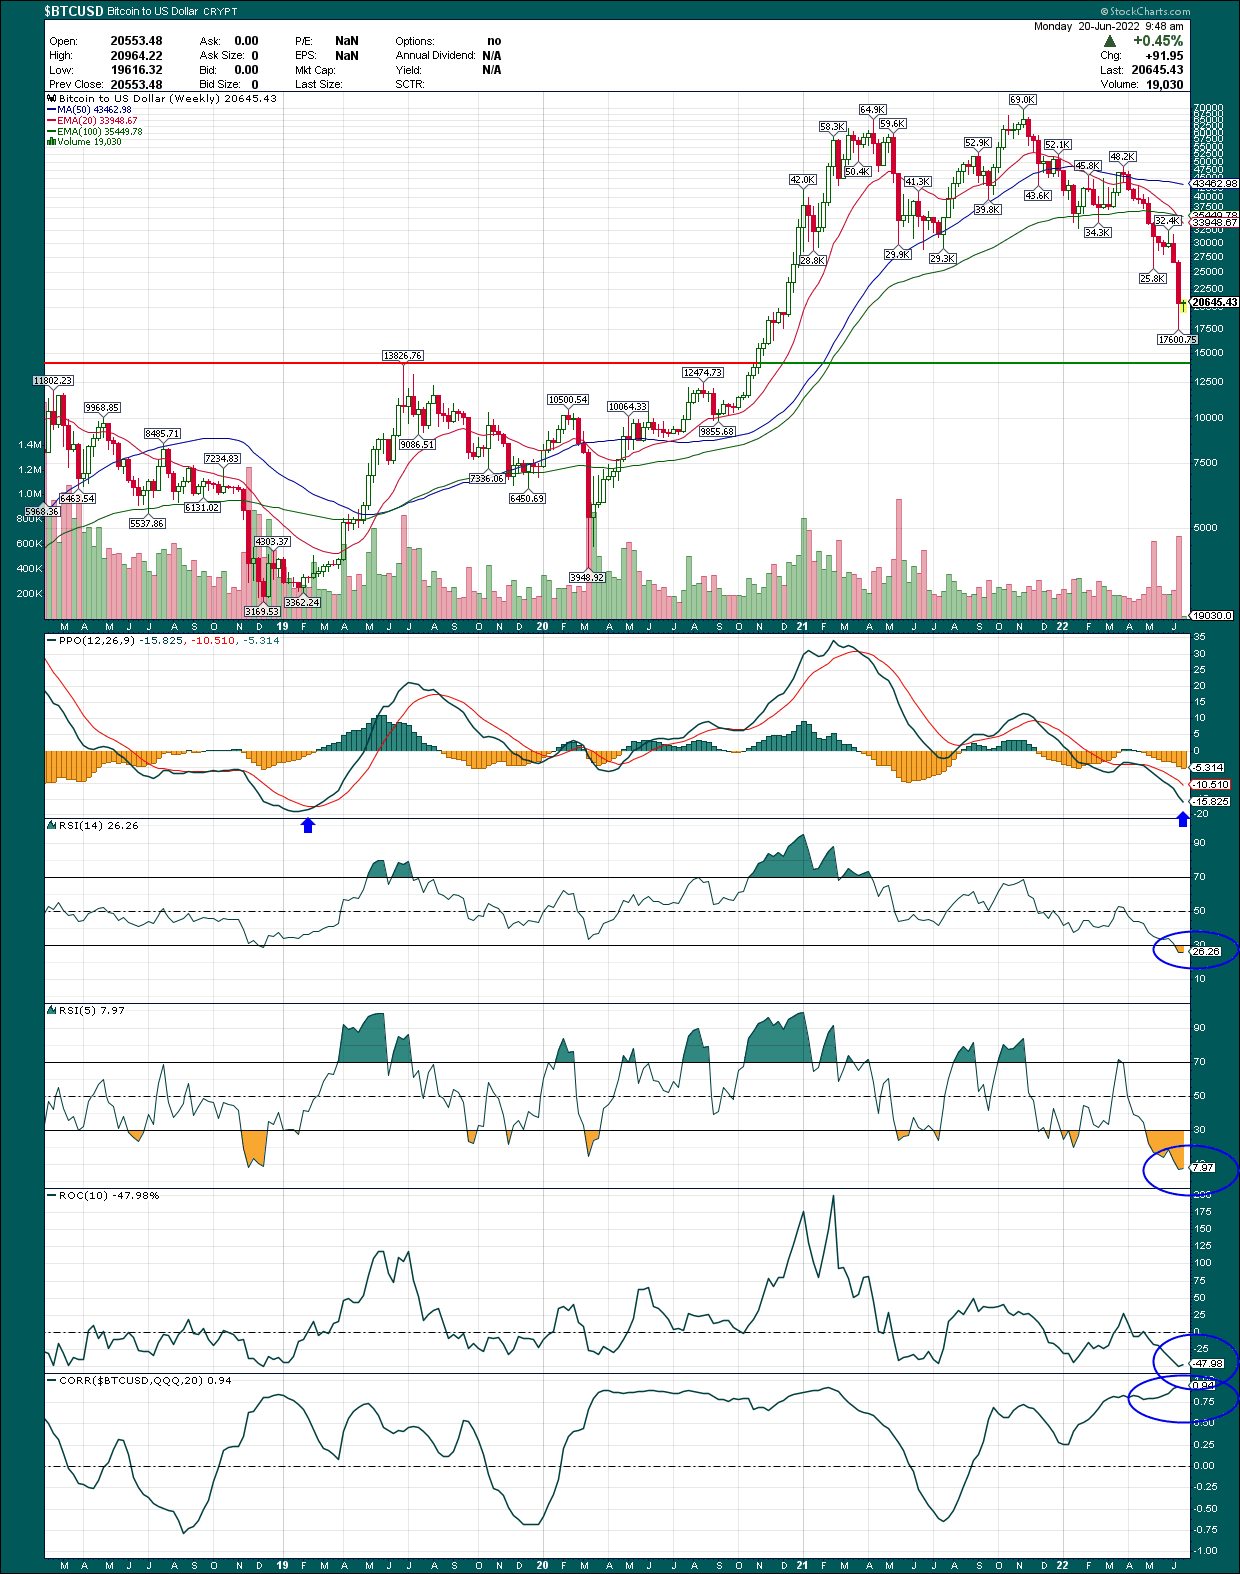
The weekly chart has some different characteristics to the monthly chart, which is why it’s good to use different time frames when you’re trading. The PPO, for instance, is well into bearish territory and looks nothing like the monthly PPO. However, given we’re at or near a cycle low, you’d expect shorter time frames to show very negative momentum, and that’s what we see. The good news is that weekly PPO readings are not only extremely oversold, but right in the area of the 2018 bottom that launched the run to the ATH.
In addition, the 14-week RSI is in oversold territory, which is actually lower than the 2018 bottom. Similarly, the 5-week RSI is just 8 at the moment, tremendously oversold, and near where it bottomed in 2018 and other shorter-term lows. The 10-week rate of change is also at -48%, again indicative of short-term bottoms.
Finally, I plotted the 20-week correlation of Bitcoin to QQQ, and it’s 0.94. Again, Bitcoin is just another risk asset, but one that moves in larger magnitudes than other risk assets. So if you think stocks are near their ultimate bottom, as I do, Bitcoin is a great way to gain some upside leverage should the rally begin this summer. Of course, the reverse is true, and if stocks continue to fall, Bitcoin will as well.
Now, let’s take a look at the daily time frame to bring this analysis home.
StockCharts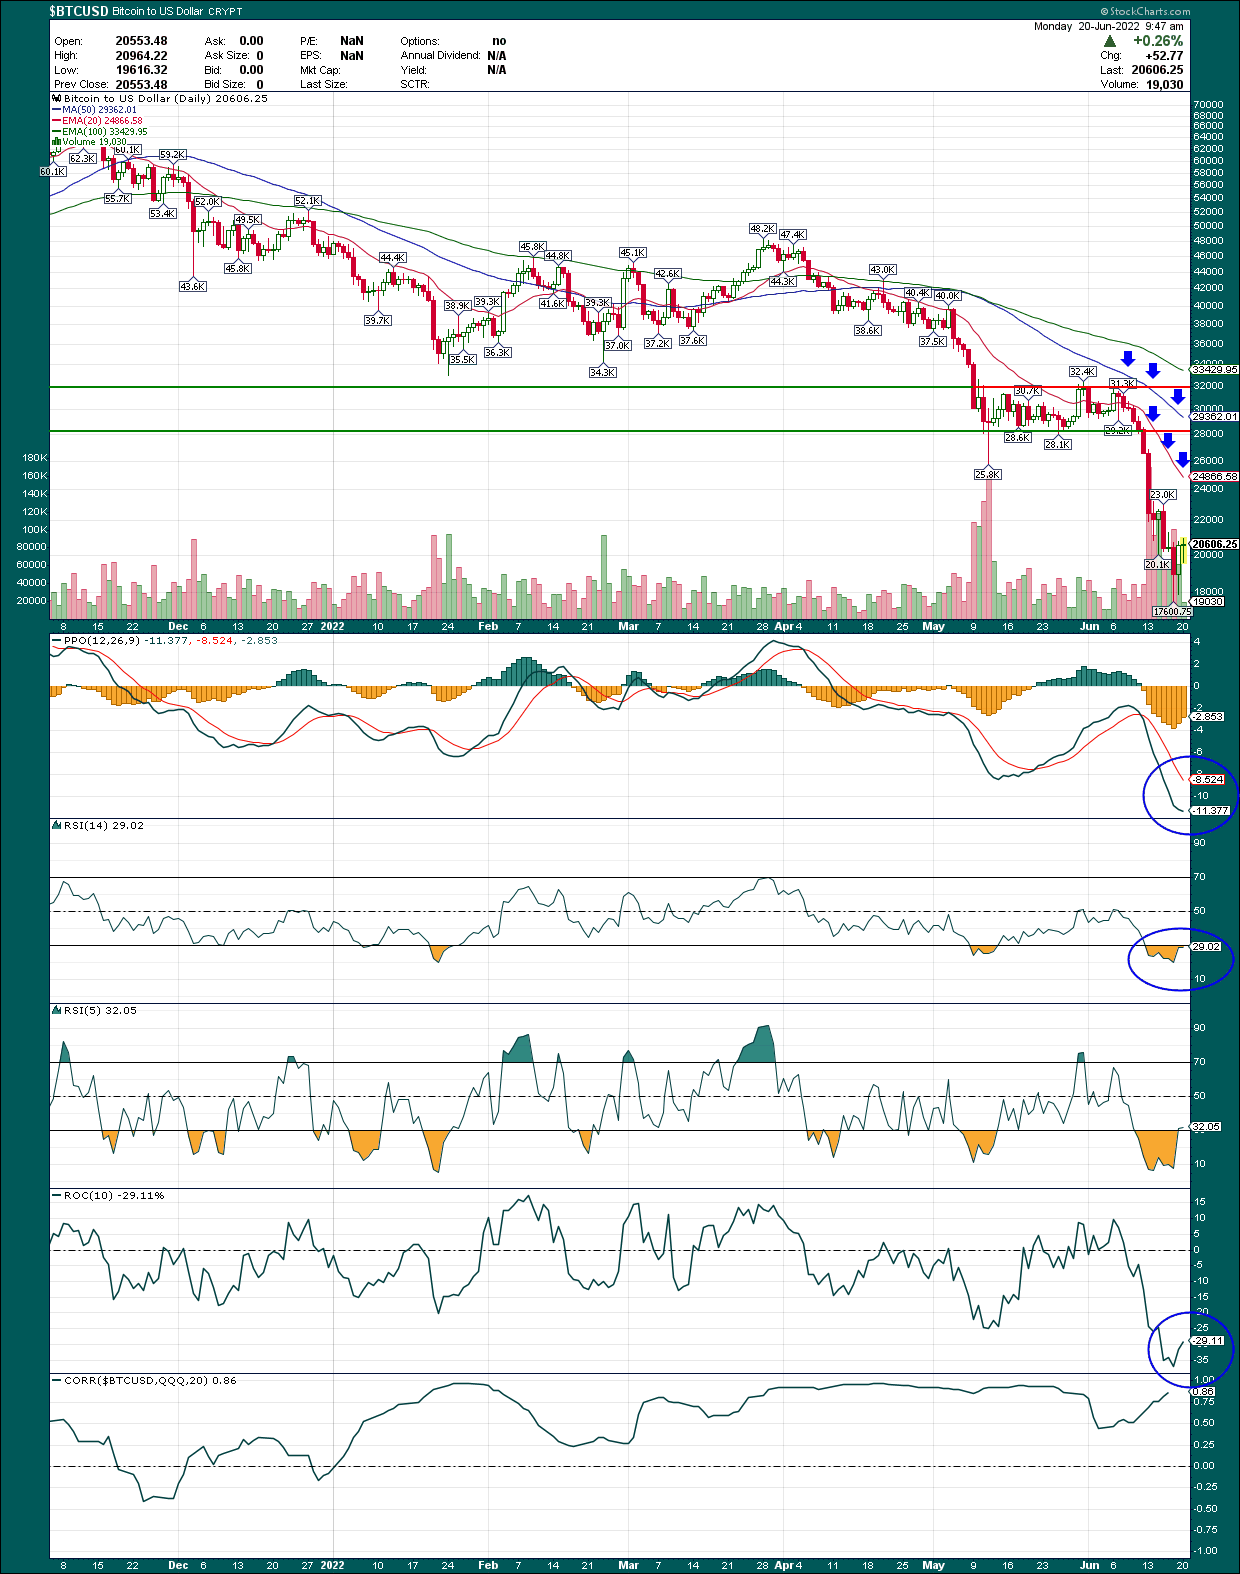
On the shorter time frame, we have some clear issues that need to be dealt with. But as we look at this chart, remember the monthly time frame is showing very clear signs of a long-term bottom, and the weekly chart is reaffirming that, in my view. Is the daily chart showing signs of a bottom? What we want to see on the daily is extremely oversold conditions and a panic price low. If we look at the above, that’s pretty much exactly what I see.
You can read this chart the same way we read the others, so I won’t go through each metric. But the point here is that we’re seeing those extreme readings in momentum, and the correlation with stocks on the daily time frame is 0.86, so they are almost moving in lockstep.
The only thing we don’t have that I would very much like to see is a positive divergence on the PPO. The low made in the past couple of days was accompanied by a lower low in the PPO, which makes me think we’re likely to see at least a retest of the low near $18k. The ideal scenario is that we see a retest of the $18k area with a strong positive divergence in the daily PPO. That would almost certainly mark THE bottom in Bitcoin, and if that occurs in the next week or two, you should buy all the Bitcoin exposure you can afford.
If/when we do rally, the 20-day exponential moving average and the 50-day simple moving average will be points of contention. They will eventually need to be crested, and turned higher for the next bull run to be fully underway. That will happen, I believe, but that’s an exercise in patience as those MAs moving higher is weeks or months away. Keep in mind, however, that once those MAs are moving higher, Bitcoin will already be well into its rally, and nowhere near $20k.
If you do buy this bottom in Bitcoin, either get out when we get to those averages the first time and buy back after the pullback, or just know volatility is likely to increase at those levels.
Other considerations
I want to be clear that I’m not a “Bitcoin believer” where I would think Bitcoin will replace fiats one day. I don’t think that’s realistic, but I also don’t care. Bitcoin is a tradable asset with very clear risk-on behavior, and that’s what I care about. Whether you believe Bitcoin is the future of money or not is irrelevant, because there’s money to be made (and lost) whether it is or not.
With that in mind, I’m framing my view on Bitcoin with the idea that the bottom for stocks is very near where we are today. If I’m right about that, now (or the next couple of weeks) is a great time to buy Bitcoin exposure. With correlations to risk assets through the roof for Bitcoin, if we see a 20% or 30% rally in stocks, Bitcoin could easily double or more in the same time frame. That’s what I’m looking for, and why I’m so very bullish on Bitcoin today.
Now, if I’m wrong, and we end up with a nasty recession or some other shock that sends stocks lower, we could easily see Bitcoin test the $14k support level, which is a very long way down from here. That’s a risk you have to be willing to take with a risky asset such as Bitcoin (or any other crypto), but that’s also why we keep stops in place. If you’re buying Bitcoin in the near future, I would suggest you place your stop loss no lower than just below the spike low from mid-June, just under $18k. If we pierce that low, the selling could intensify very quickly and we could see $14k in short order. To be clear, I do not think that will happen, but I’ve been wrong before and it’s certainly a possibility.
Finally, there are other ways to buy exposure to Bitcoin, which you can do through miners, or big holders of Bitcoin. They carry with them their own risks and rewards, but you don’t simply have to buy Bitcoin itself. Either way, I think the risk to Bitcoin over the next year is very firmly to the upside, and if you’re investing for capital gains, I think it’s imprudent not to have some exposure to Bitcoin given where we are today.
Volatility is obviously extreme with cryptos, miners, or the stocks of big holders of Bitcoin, but so are the rewards. We’ve already seen three-fourths of the value of Bitcoin evaporate during this bear market, and while we could go somewhat lower, the risk is very firmly to the upside for the foreseeable future. All the pieces are in place for a long-term, sustainable bottom, and I want in.


