

Bitcoin is now over 640 days into a bull market, if you believe we’re still in one.
A couple hundred days ago back in January, bitcoin’s bull market performance to date had more or less tracked between the previous two cycles: just under 4.5x returns.
Bitcoin at this point in the 2015 to 2018 cycle was however quickly heating up. Between January and July 2017, bitcoin exploded from $800 to over $2,800.
It eventually carried onto nearly $20,000 by the end of the 2017, setting an all-time high that wouldn’t be broken for three years.

Bitcoin today is more closely tracking the most recent cycle, between 2018 and 2022, as shown by the brown line on the chart above. It’s posted 278% market-to-date returns compared to 244%.
Not all cryptocurrencies have been as bullish as bitcoin.
Read more: How to think about markets when they all move as one
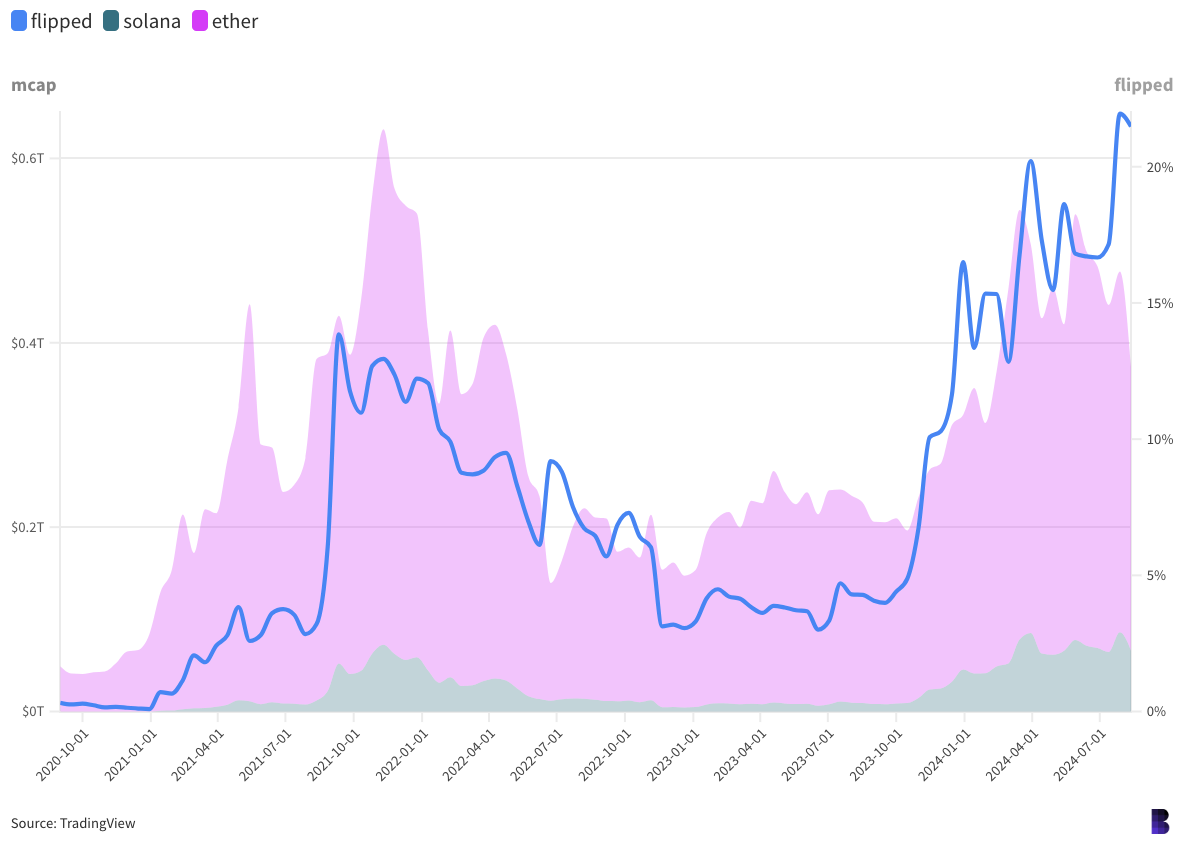
Ether, for one, hasn’t been this far from flipping bitcoin in almost three and a half years.
On the chart below, the orange and pink shaded areas in the background show bitcoin and ether’s market cap, respectively.

The areas are stacked, so a flippening would be when the smaller one takes up more than half of the combined space.
The blue line tracks the progress — and it’s been steadily retreating since the peak of 2021’s bull market.
Solana has meanwhile never been closer to flipping ether. This time last year, solana’s market cap was only 4% that of ether’s — or $9.3 billion to $217.2 billion. Now, it’s at 22%, valued at $66 billion to $307.6 billion.
But how long does this bull market have left to go? All we can do is compare the lengths of the previous ones, and that differs across various models.
The simplest method starts bull markets when bitcoin bottoms out and ends once a downward trend has been fully confirmed.
Based on that approach:
- Our current bull market started on Nov. 9, 2022 when bitcoin bottomed out below $15,670 after FTX shut withdrawals — 642 days ago.
- The previous three bull markets lasted between 1,047 days (2015 to 2018) and 1,278 days (2018 to 2022).
- If bitcoin were indeed destined to map to those four-year cycles (no guarantees there), then we’re over halfway through our current period.
In the case that the bull market was already over, it would’ve been the shortest in bitcoin history — not counting the initial price discovery in the two years after the genesis block.
Of course, past performance does not indicate future results. But that shouldn’t stop us from having fun. If the bull market is still ongoing, and bitcoin price action is indeed still cyclical, then we’ll have to go higher from here to map to those patterns.
So, based on the length of the previous three markets, bitcoin would still be bullish even until half way through next year — which does align with some analyst outlooks.
A modified version of this article first appeared in the daily Empire newsletter. Subscribe here so you don’t miss tomorrow’s edition.
Start your day with top crypto insights from David Canellis and Katherine Ross. Subscribe to the Empire newsletter.
Explore the growing intersection between crypto, macroeconomics, policy and finance with Ben Strack, Casey Wagner and Felix Jauvin. Subscribe to the On the Margin newsletter.
The Lightspeed newsletter is all things Solana, in your inbox, every day. Subscribe to daily Solana news from Jack Kubinec and Jeff Albus.


