

Since reaching a low of $74,434 on April 7, 2025, Bitcoin (BTC/USD) has surged impressively, climbing in a five-wave impulse structure with an extended (nested) formation. This rally has unfolded in clear stages, as shown on the one-hour chart. From the April 7 low, wave (1) peaked at $86,450, followed by a pullback in wave (2) to $83,102. The cryptocurrency then soared higher in wave (3), which is breaking down into smaller impulsive waves.
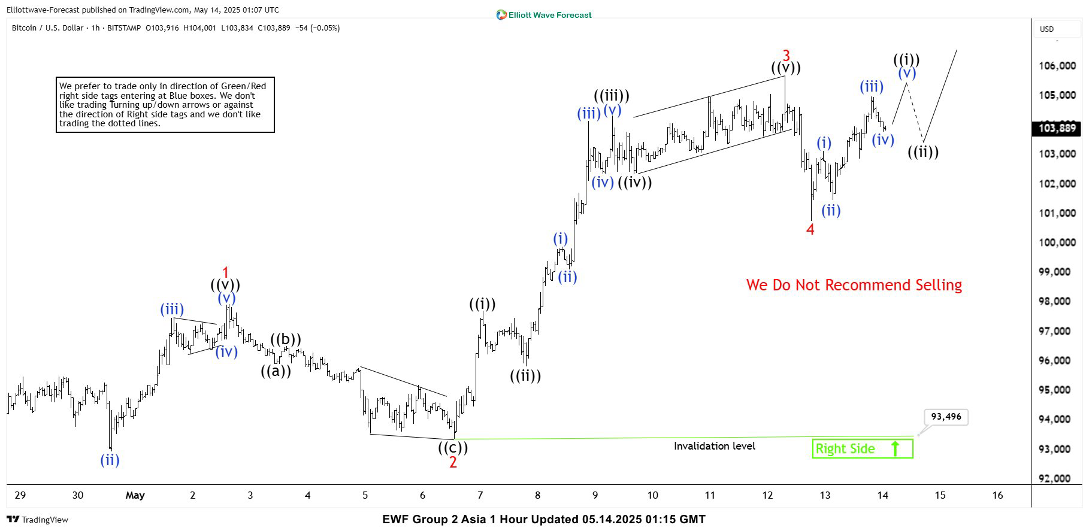
Within wave (3), the first sub-wave, wave 1, hit $97,938, followed by a wave 2 dip to $93,376. The cryptocurrency then climbed to $105,706 in wave 3, with the wave 4 pullback likely wrapping up at $100,764. Looking ahead, Bitcoin is expected to continue rising in wave (5). In the near term, wave ((i)) of (5) should complete with one more upward push, followed by a pullback in wave ((ii)) before it resumes higher again. As long as the pivot at $94,496 low holds, any near-term dips should attract buyers in 3, 7, or 11 swings, setting the stage for further upside.
Bitcoin 60-minute Elliott Wave technical chart
Bitcoin Elliott Wave [Video]


