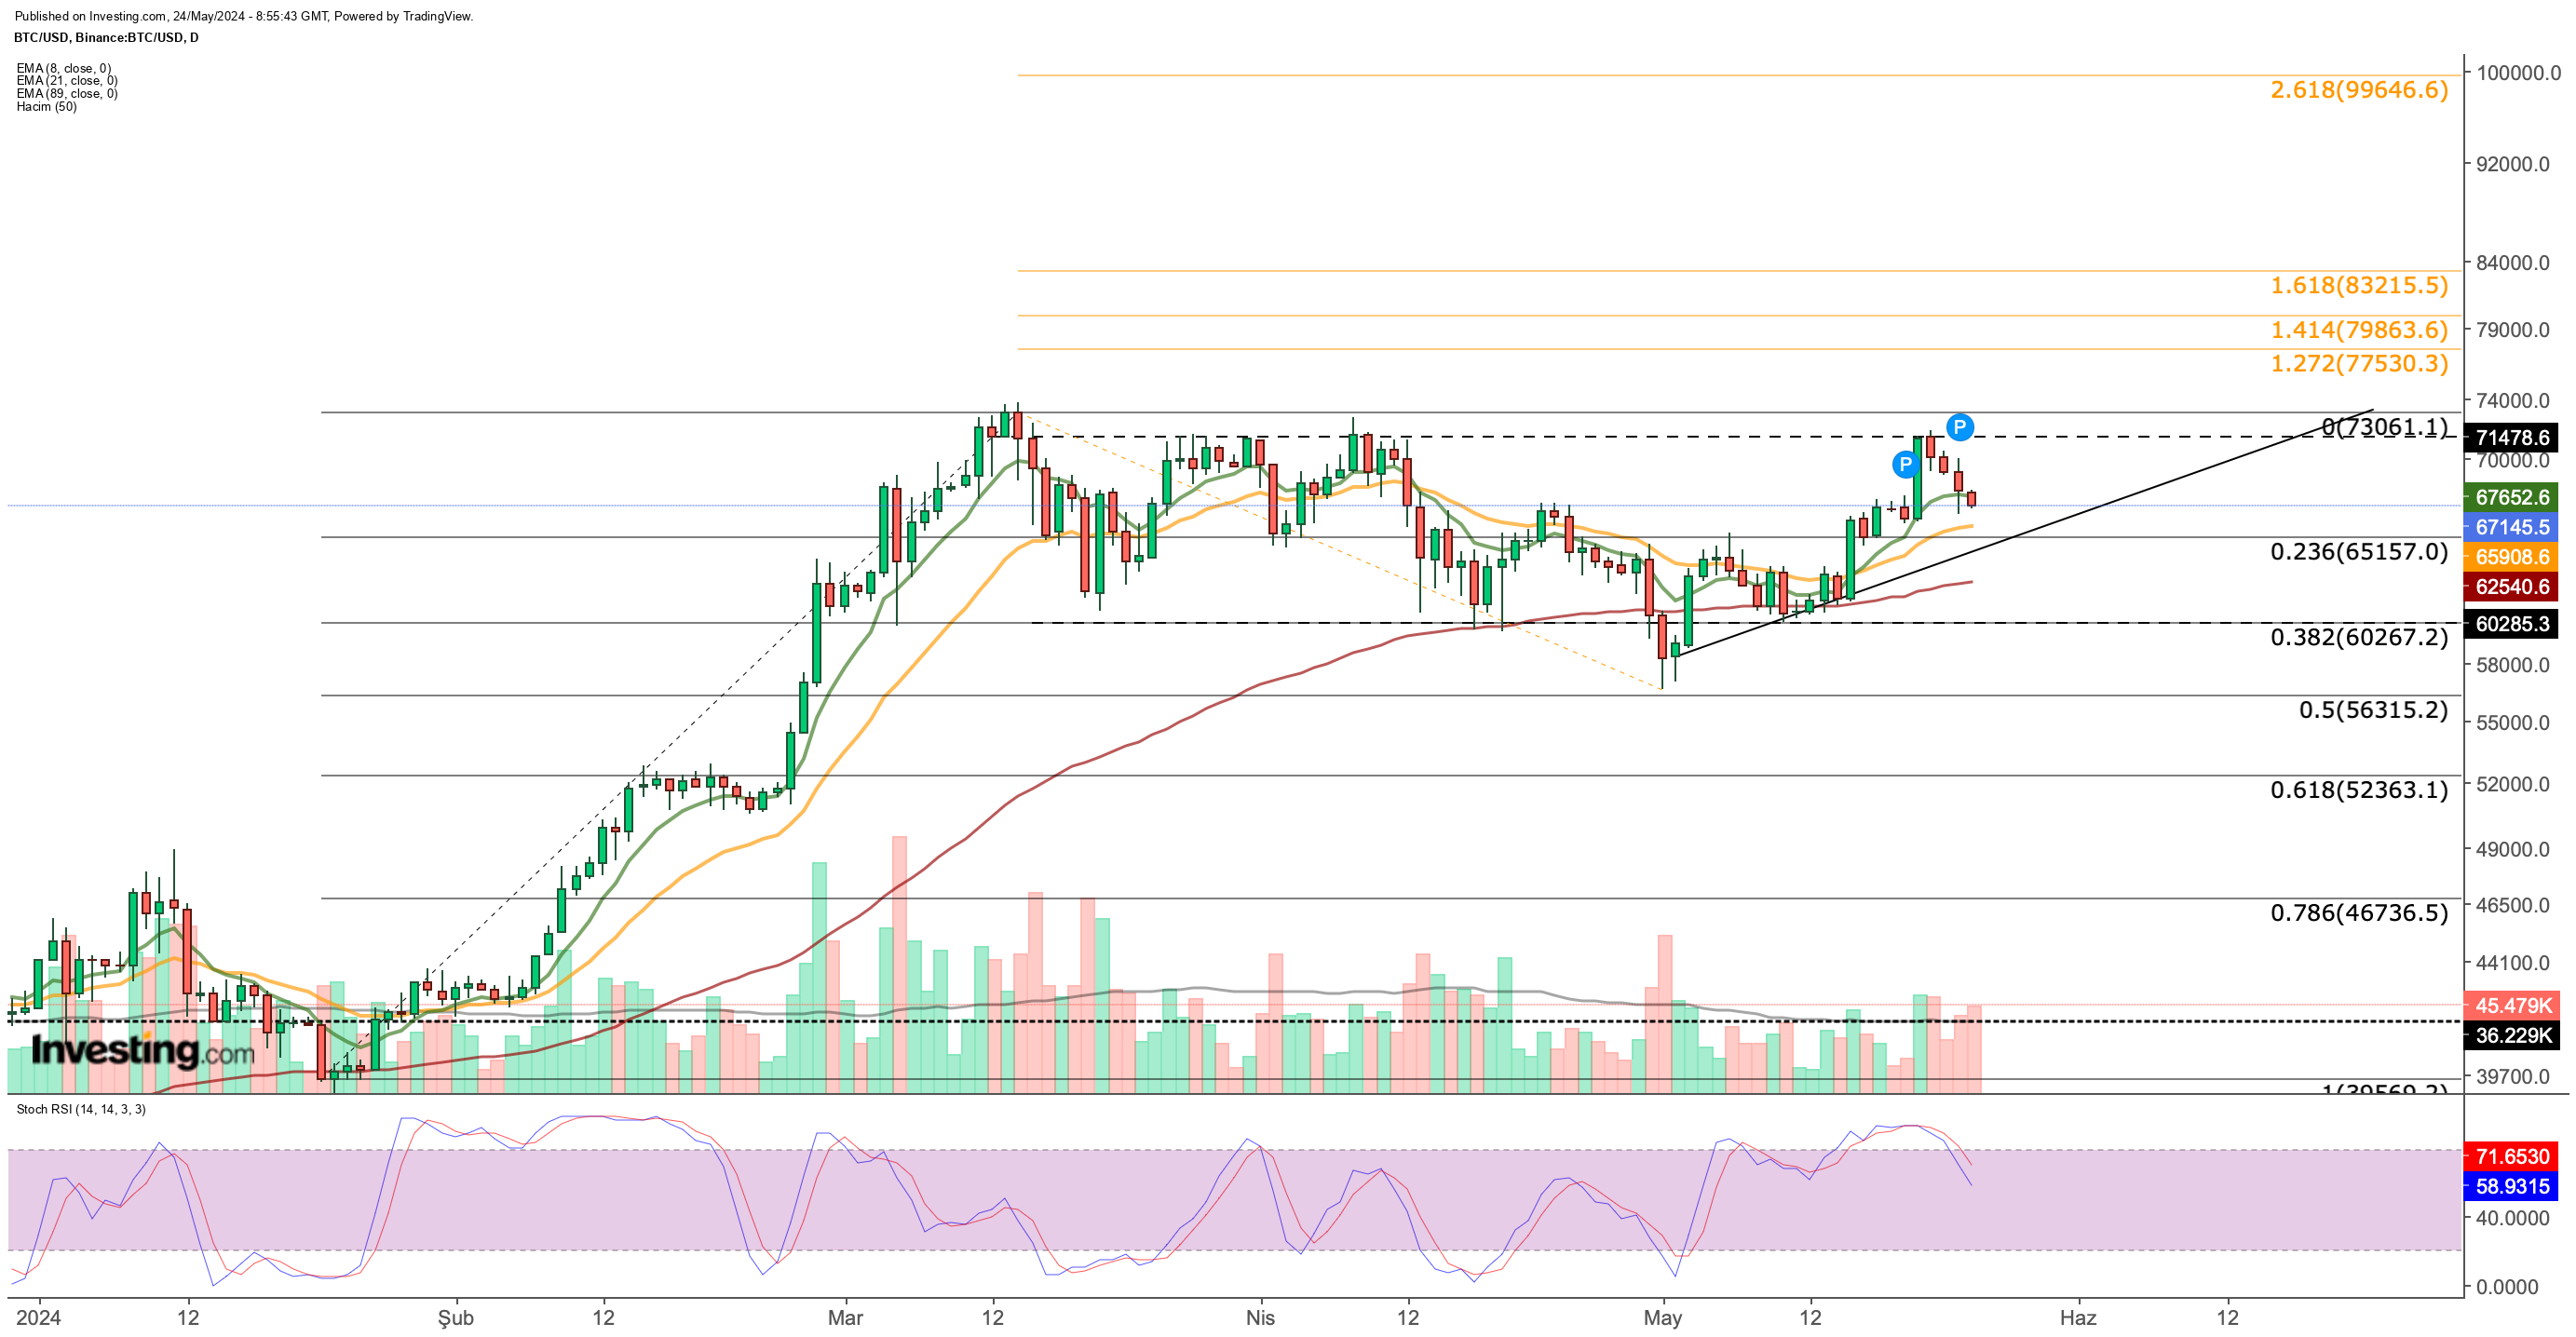
‘s upward climb throughout May has stalled, leaving it stuck in a consolidation phase. After dipping to $56,630 at the month’s beginning, the cryptocurrency rebounded and settled into a trading range between $60,000 and $70,000. This zone has seen strong buying activity.
Earlier this week, Bitcoin attempted to break through the $70,000 resistance level, a barrier it hasn’t surpassed since March. However, the effort was met with selling pressure, pushing the price back down.
Over the past four days, sellers have dominated the market, forcing Bitcoin to retreat towards its intermediate support at $65,000. This level is crucial as it represents the first major support zone based on Bitcoin’s strong performance in the first quarter (Fibonacci retracement level of 0.236). Additionally, it coincides with the 21-day Exponential Moving Average (EMA) and the May trendline, further strengthening its significance.
Analysts continue to monitor Bitcoin closely, hoping for a continuation of the bullish momentum witnessed in the first quarter. Holding the $65,150 support will be key for Bitcoin to resume its upward trajectory.
Bitcoin Bulls Set to Be Tested
A break below $65,000 on daily closes could bring the $60,000-$62,000 zone back into focus. This area, supported by the 3-month EMA since last month, has been a key support for Bitcoin.
However, if buyers can defend $65,000 this week, a potential move back toward the $71,000-$73,000 resistance zone is on the table. This area has acted as a selling point since March, preventing further bullish momentum.
Should Bitcoin overcome this resistance with a weekly close above $73,000, the $77,000-$83,000 zone emerges as the nearest short-term target.
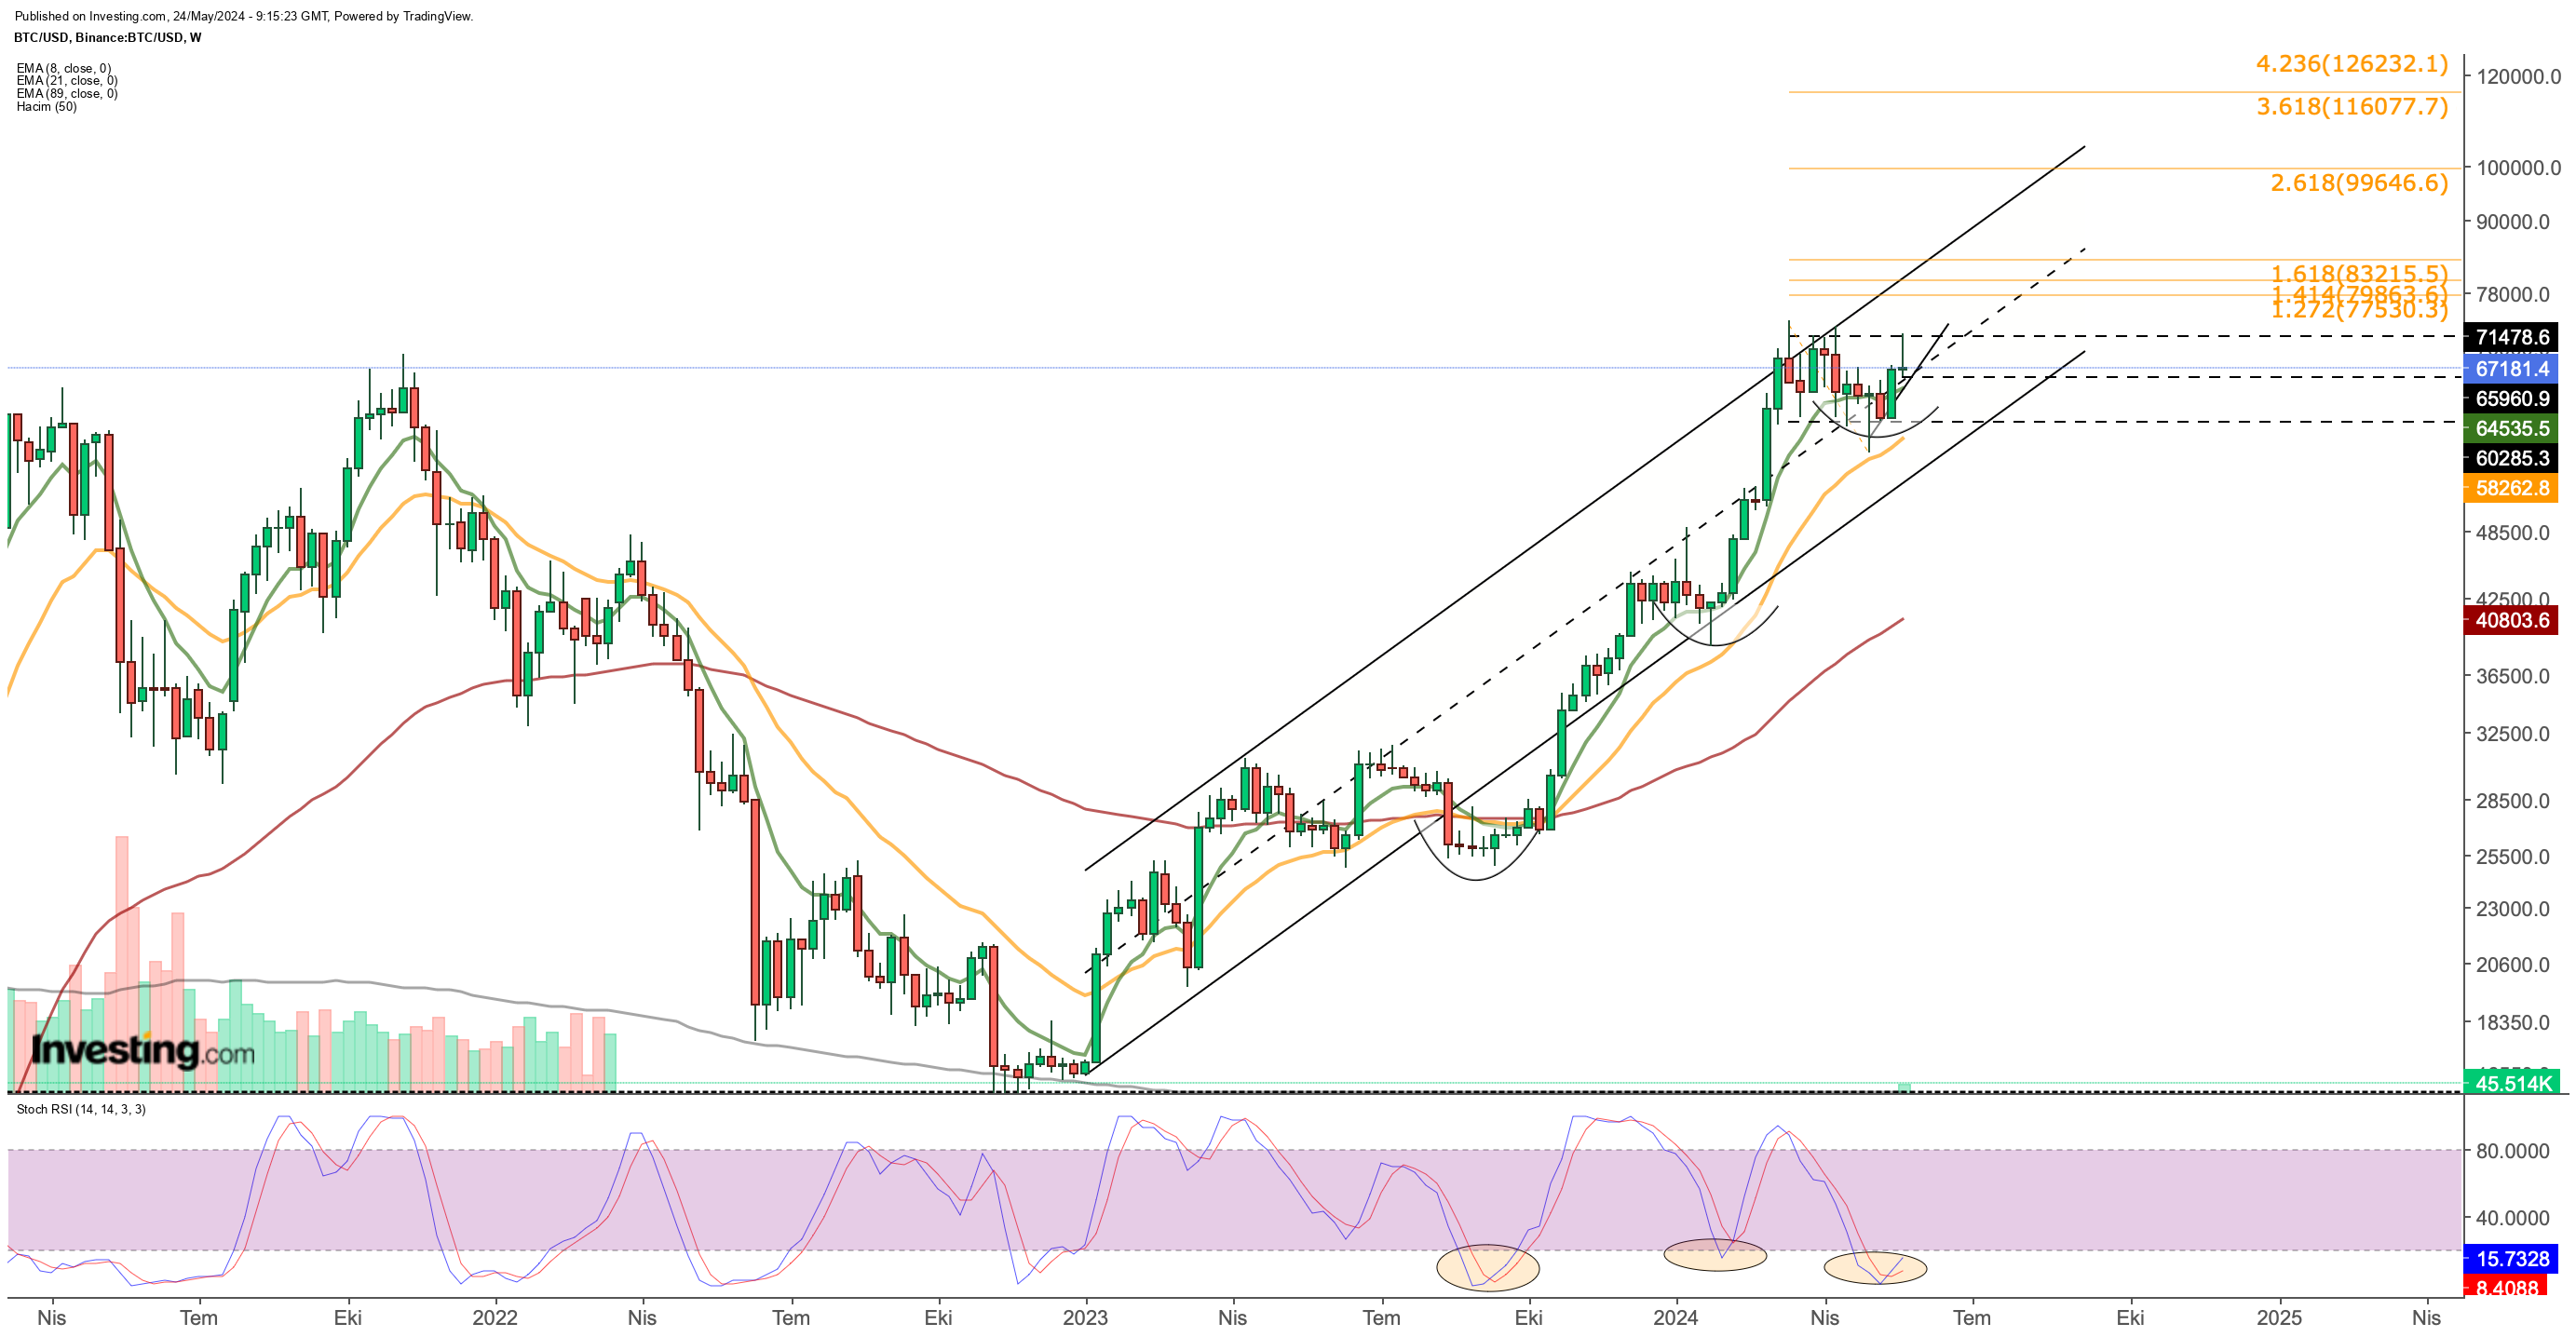
Looking at the weekly chart, a repeat of the price cycle that began in August 2023 could see Bitcoin reach as high as $110,000, but only if the current consolidation zone is decisively broken.
Bitcoin Building Momentum for a Breakout?
Bitcoin appears technically oversold according to the Stochastic RSI on the weekly chart. This suggests Bitcoin is ripe for a breakout if a positive catalyst emerges.
Underlying this bullish sentiment is Bitcoin’s resilience around $60,000 for the past month, indicating strong support at this level.
The recent return of net inflows into spot ETFs presents a significant positive development. However, broader institutional demand for Bitcoin hinges on global factors.
The Fed’s stance on monetary policy in the coming months is critical. This shift towards a more accommodative stance would boost risk appetite and dramatically increase demand for Bitcoin.
Consequently, economic data releases from the U.S. will become a major influence on Bitcoin’s price starting next month.
While the approval and potential July launch of spot ETFs could divert some trading activity from Bitcoin, the expected limitations on Ethereum ETF trading are unlikely to significantly impact the dominant player in the ETF market.
More importantly, increased adoption within the crypto sector due to these developments could have a positive indirect impact on Bitcoin in the medium term.
Key Levels to Watch
If Bitcoin can maintain momentum above $65,000, a surge in buying pressure could lead to a decisive break above the resistance line around $73,000. Conversely, a drop below $65,000 could signal an extension of the current consolidation phase.
In conclusion, Bitcoin is technically positioned for a breakout, fueled by oversold conditions and a potential rise in institutional demand. The Fed’s monetary policy decisions and key price levels of $65,000 and $73,000 will be crucial factors to watch in the coming weeks.
***
Take your investing game to the next level in 2024 with ProPicks
Institutions and billionaire investors worldwide are already well ahead of the game when it comes to AI-powered investing, extensively using, customizing, and developing it to bulk up their returns and minimize losses.
Now, InvestingPro users can do just the same from the comfort of their own homes with our new flagship AI-powered stock-picking tool: ProPicks.
With our six strategies, including the flagship “Tech Titans,” which outperformed the market by a lofty 1,745% over the last decade, investors have the best selection of stocks in the market at the tip of their fingers every month.
Subscribe here and never miss a bull market again!
Don’t forget your free gift! Use coupon codes OAPRO1 and OAPRO2 at checkout to claim an extra 10% off on the Pro yearly and bi-yearly plans.
Disclaimer: This article is written for informational purposes only; it does not constitute a solicitation, offer, advice, or recommendation to invest as such it is not intended to incentivize the purchase of assets in any way. I would like to remind you that any type of asset, is evaluated from multiple points of view and is highly risky and therefore, any investment decision and the associated risk remains with the investor.


