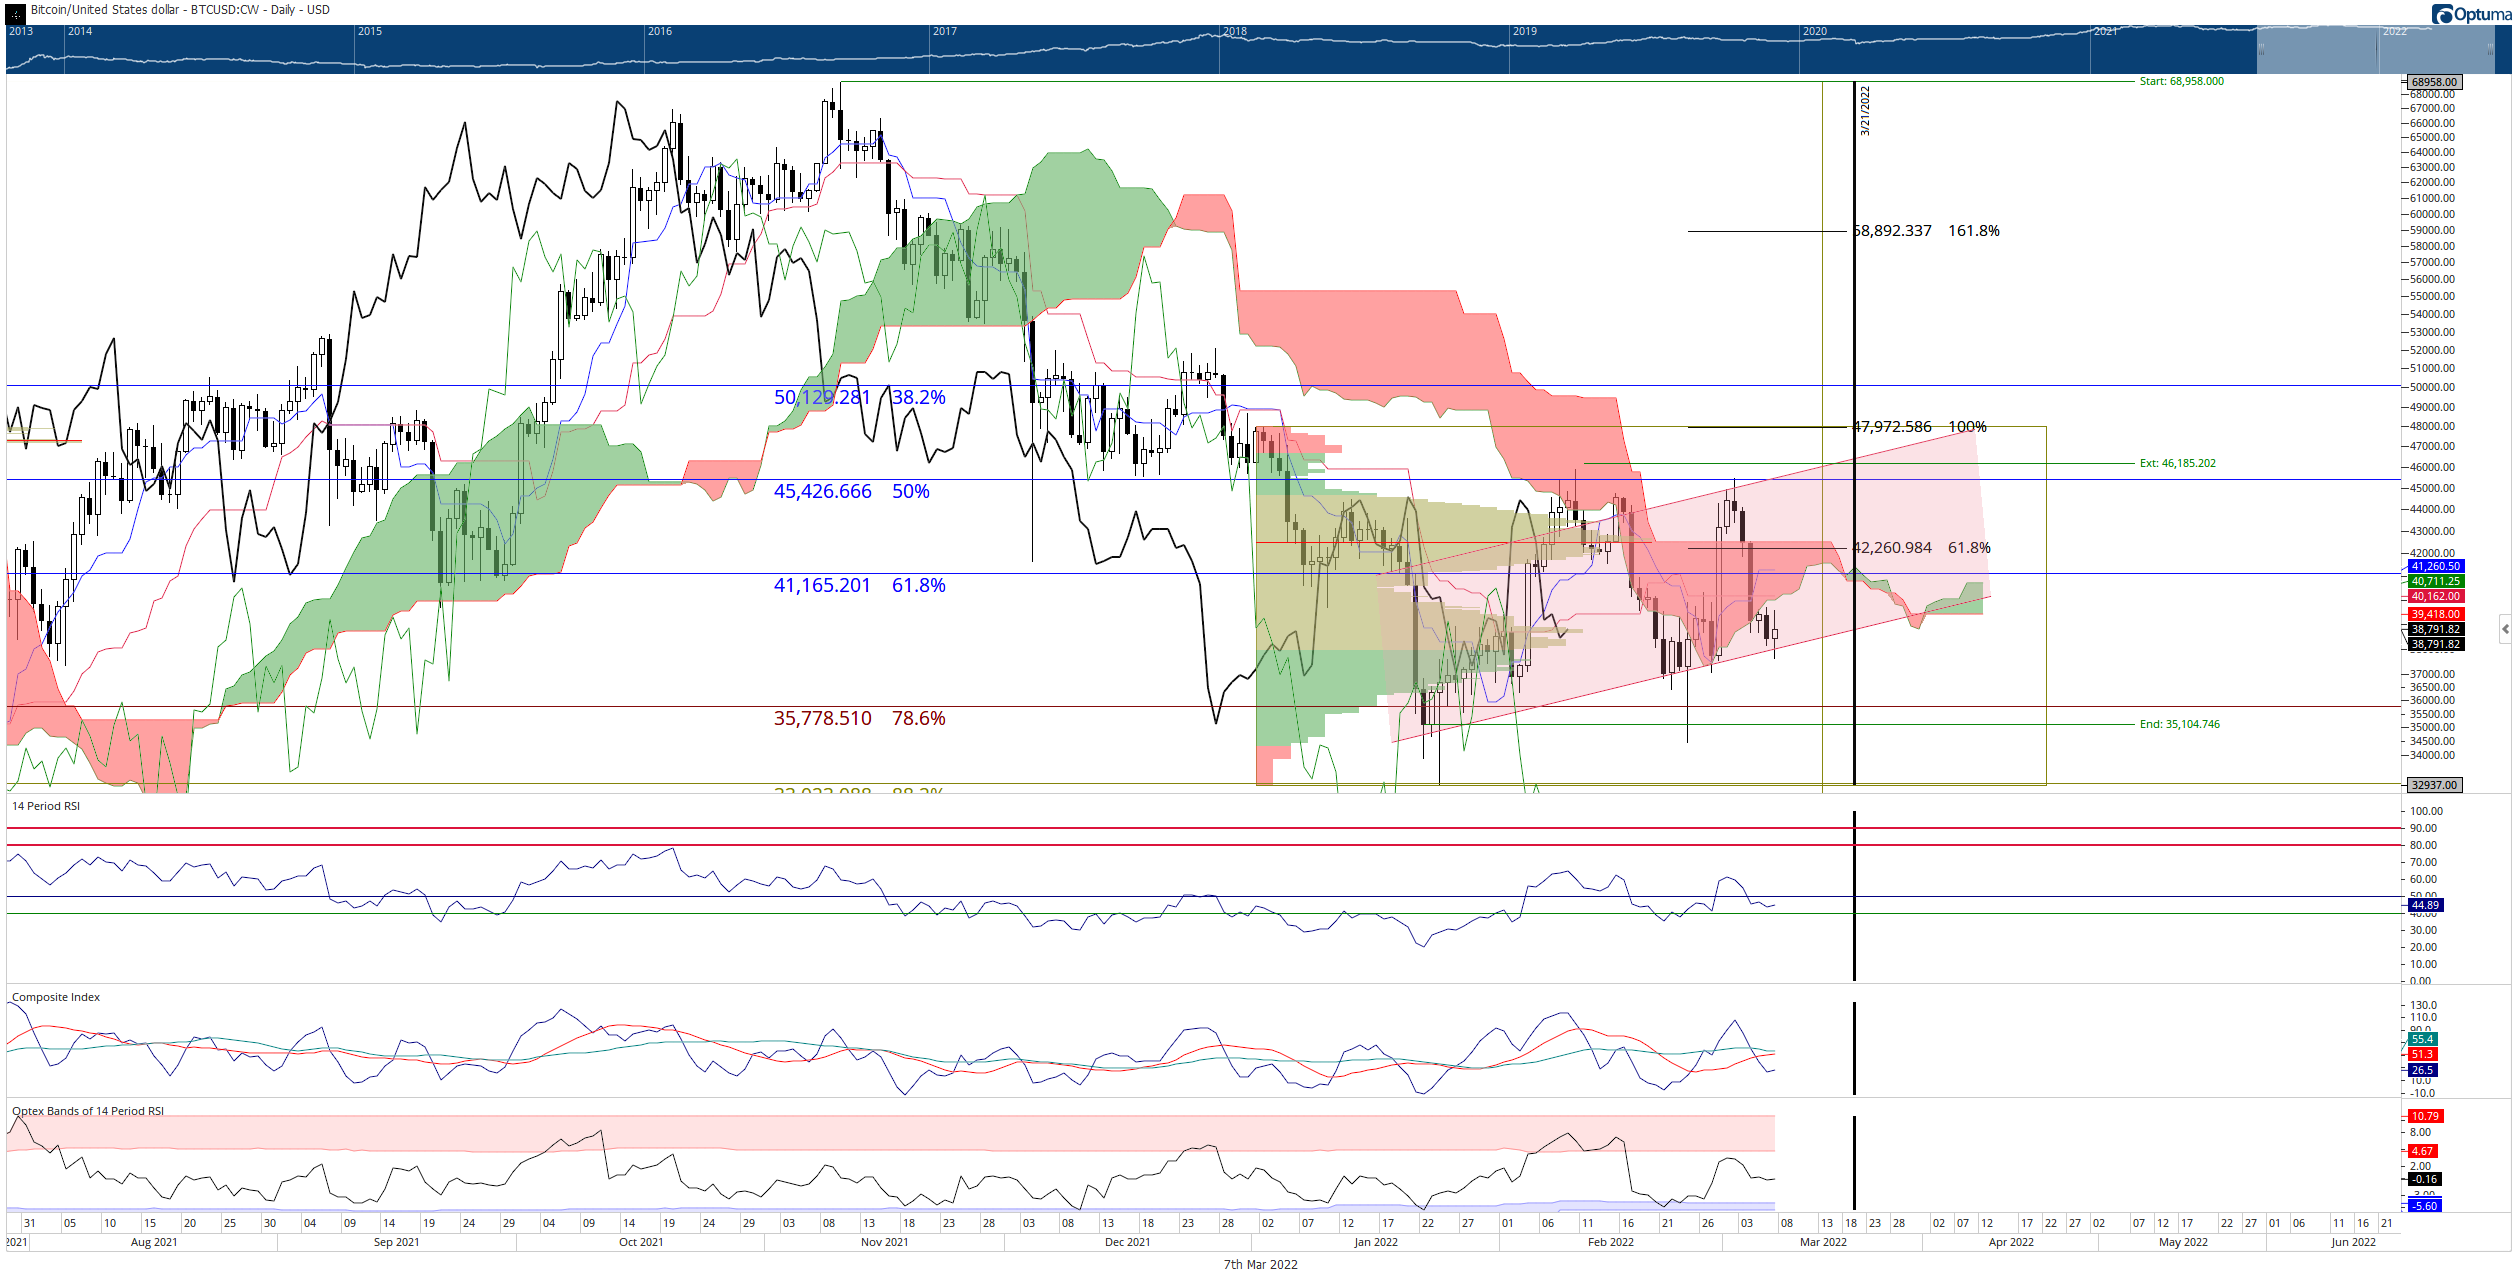
- Bitcoin confirmed a major Ichimoku short signal on Saturday, but sellers have not followed through.
- Buyers have entered just above the lower trendline of the current bear flag pattern.
- A bear trap could be developing before a major bullish reversal.
Bitcoin price continues to show very bearish signals that downside pressure is likely to continue. However, early warning signs of a bullish reversal continue to play out despite the current bearish technicals.
Bitcoin price barely holding above its final support zone
Bitcoin price confirmed and Ideal Bearish Ichimoku Breakout on Saturday, creating the first confirmed entry of this type since December 4, 2021. Typically, this type of short entry triggers massive short interest and subsequent selling pressure. However, bears have been unable or unwilling to press BTC lower.
The only support level remaining for Bitcoin price on its daily chart is the bottom of the current bear flag at $38,000. If $38,000 fails to hold as support, Bitcoin price is likely to move towards the next Fibonacci expansion level between $30,000 and $30,500.
However, a spectacular bear trap could also be developing. The failed follow-through from a confirmed Ideal Bearish Ichimoku Breakout is uncommon, and given the proximity to confirm a standard bearish breakout from the bear flag, BTC’s daily chart had a prime shorting opportunity that shows signs of being avoided.
BTC/USD Daily Ichimoku Kinko Hyo Chart
If Bitcoin price repeated last Monday’s performance, it would instead convert into an Ideal Bullish Ichimoku Breakout, likely trapping a significant number of short-sellers within the $38,000 to $40,000 value area. The resulting rally would likely return Bitcoin to test the $50,000 zone next.


