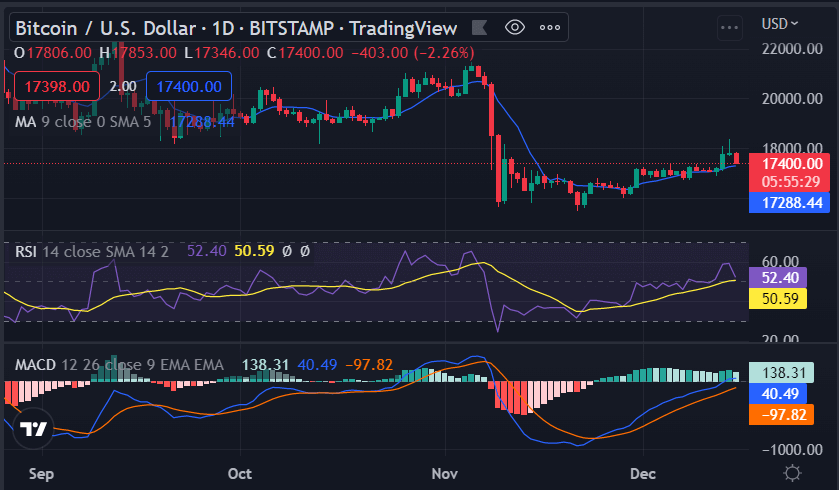
Bitcoin price analysis for today shows BTC is currently stuck in a consolidation phase around the $17,400 level. The intraday bias remains slightly bearish as long as prices are trading below the $18,318 level. At the moment of writing, Bitcoin is trading at $17,426 and is down by 3.77 percent. The market capitalization for BTC currently stands at $335 billion while the trading volume totals $25 million.
The immediate support is found at $17,418, A break below this level could see BTC prices retesting the $17,400 level. On the other hand, if prices manage to break above the $18,318 level, it could open up the door for a move toward the $18,350 level.
Bitcoin price analysis on a daily price chart: Bulls unable to push price action any higher
The Bitcoin price analysis on a daily chart shows that the bulls are having a hard time pushing price action any higher. Prices have been stuck in a consolidation phase for the past hours as the market awaits a catalyst that will push prices either to the upside or downside. The bulls seem to have been exhausted as the price has fallen to lows of $17,426 after opening the day at $18,318. The technical indicators are giving mixed signals at the moment. The RSI is currently trading at the 50.59 level, which shows that there is still some room for prices to fall further before reaching oversold territory. The Parabolic SAR is giving a bearish signal as the dots are placed above the price action.

The MACD, on the other hand, is giving a bearish signal as the histogram is falling and is about to cross below the zero line. The MACD line is clearly below the red signal line and seems to be gaining strength.
The 200 SMA line is well placed below the current market price, which is a sign that the path of least resistance is still to the downside. The other key levels to watch out for are $18,318, which is the next resistance level, and $17,418, which is the next support level. The Bitcoin price analysis shows that a move to the downside is more likely at the moment as the bulls seem to be losing steam. However, a breakout to the upside cannot be ruled out as the market awaits a catalyst that will push prices in either direction.
Bitcoin price analysis on 4-hour chart: Bearish market sentiment
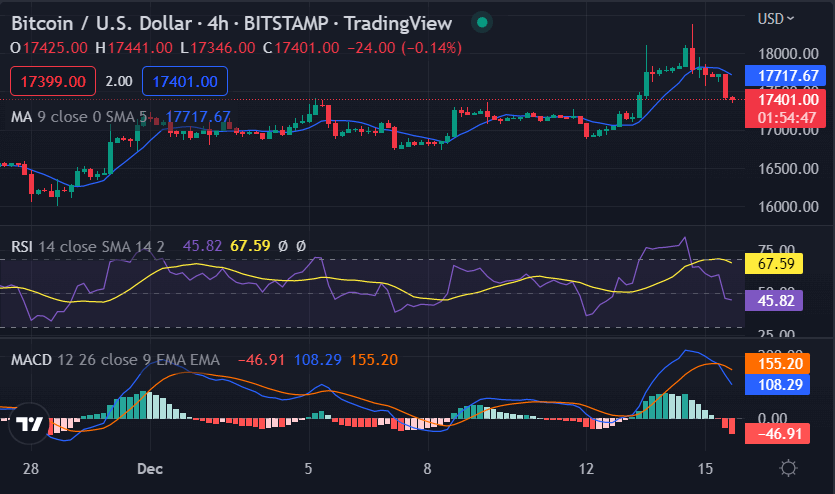
The 4-hour Bitcoin price analysis shows that the price function is headed down once again as the price levels are continuously sinking. The bears are pulling down the price levels, and currently, they have reached the $17,426 level as BTC/USD still looks for support. The market declined and shifted to the bearish sentiment as indicated by the Relative Strength Index line which is headed below the 70.00 level. The RSI indicator is currently trading at 67.59 and heading toward the oversold territory which is another sign that prices are likely to fall further in the short term.

BTC price was stuck in a critical juncture of sideways trading before the bears won the battle and prices succumbed to selling pressure. The MACD indicator is also signaling a further decline as the histogram is falling and about to cross below the zero line. The moving average lines are also in favor of the bears as the 50 SMA line is well below the 200 SMA line. The 200 SMA line is also headed lower which shows that prices are likely to follow suit in the near term.
Bitcoin price analysis conclusion
Our Bitcoin price analysis concludes that a move to the downside is more likely in the near term as market conditions remain bearish. The selling pressure is likely to increase and the BTC price could decline toward the $17,418 level in the near term.
While waiting for Bitcoin to move further, see our Price Predictions on XDC, Cardano, and Curve.


