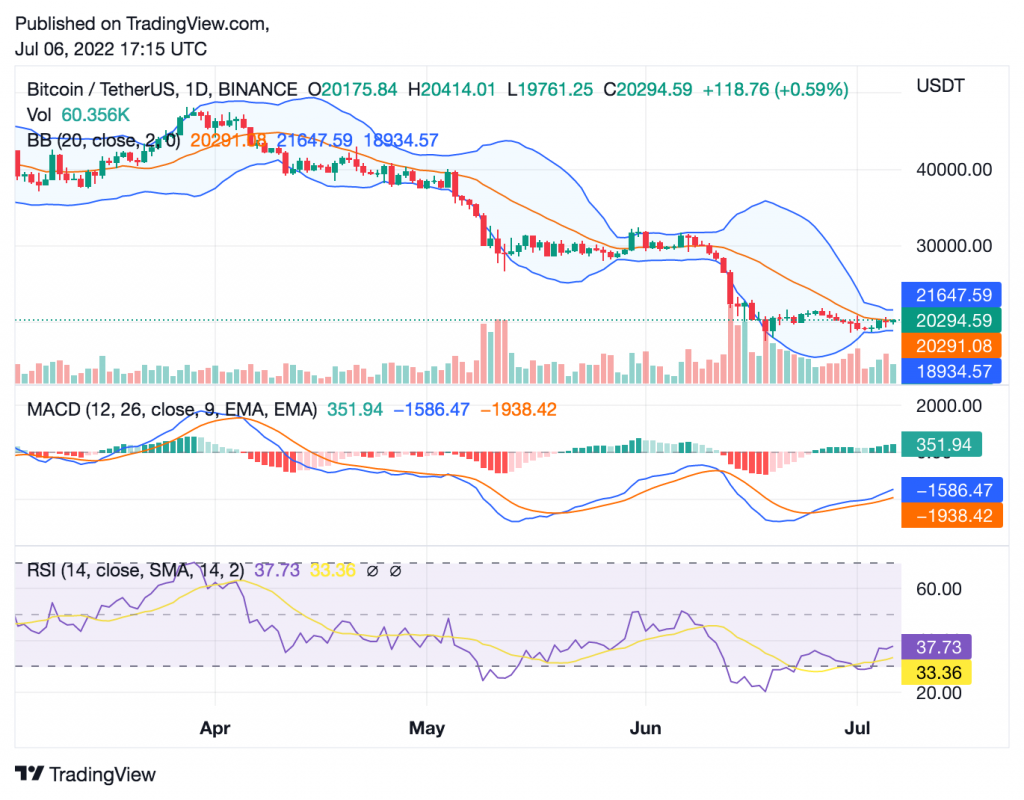
In early June BTC price was $31600 but its price started to decline up to mid june where it reached $20320.
Lately that was the most prolonged drop of Bitcoin’s price. After that, BTC’s price showed some signs of recovery but it has not fully recovered yet.
Technical Analysis

In the past 24 hours BTC has traded as high as $20,635 and as low as $19,546 on different exchange platforms. The BTC/USD pair is currently trading at $20,321 and looks to be consolidating in a narrow range.
The technical indicators are giving mixed signals as the RSI is currently at 36.85 while the MACD bars are green an indication that the price might start to move higher.
The Bollinger bands are narrow which is a sign of low volatility in the market.The MACD line is above the signal line but the histogram is green an indication of bullish momentum in the market.
The candle sticks are trading above the lower bollinger bands which is a bullish signal. The support levels are at $20000 and $19000 while the resistance levels are at $21000 and $22000.
The market looks indecisive as different technical indicators are giving mixed signals. The market might start to move higher if the BTC/USD pair breaks out of the $21000 resistance level.
Upcoming Trend
Bitcoin’s price is expected to continue its consolidation in the near-term as it remains range-bound between $19,000 and $21,000.
A breakout above $21,000 could lead to a move towards $22,000 while a breakdown below $19,000 could result in a decline towards $18,000.


