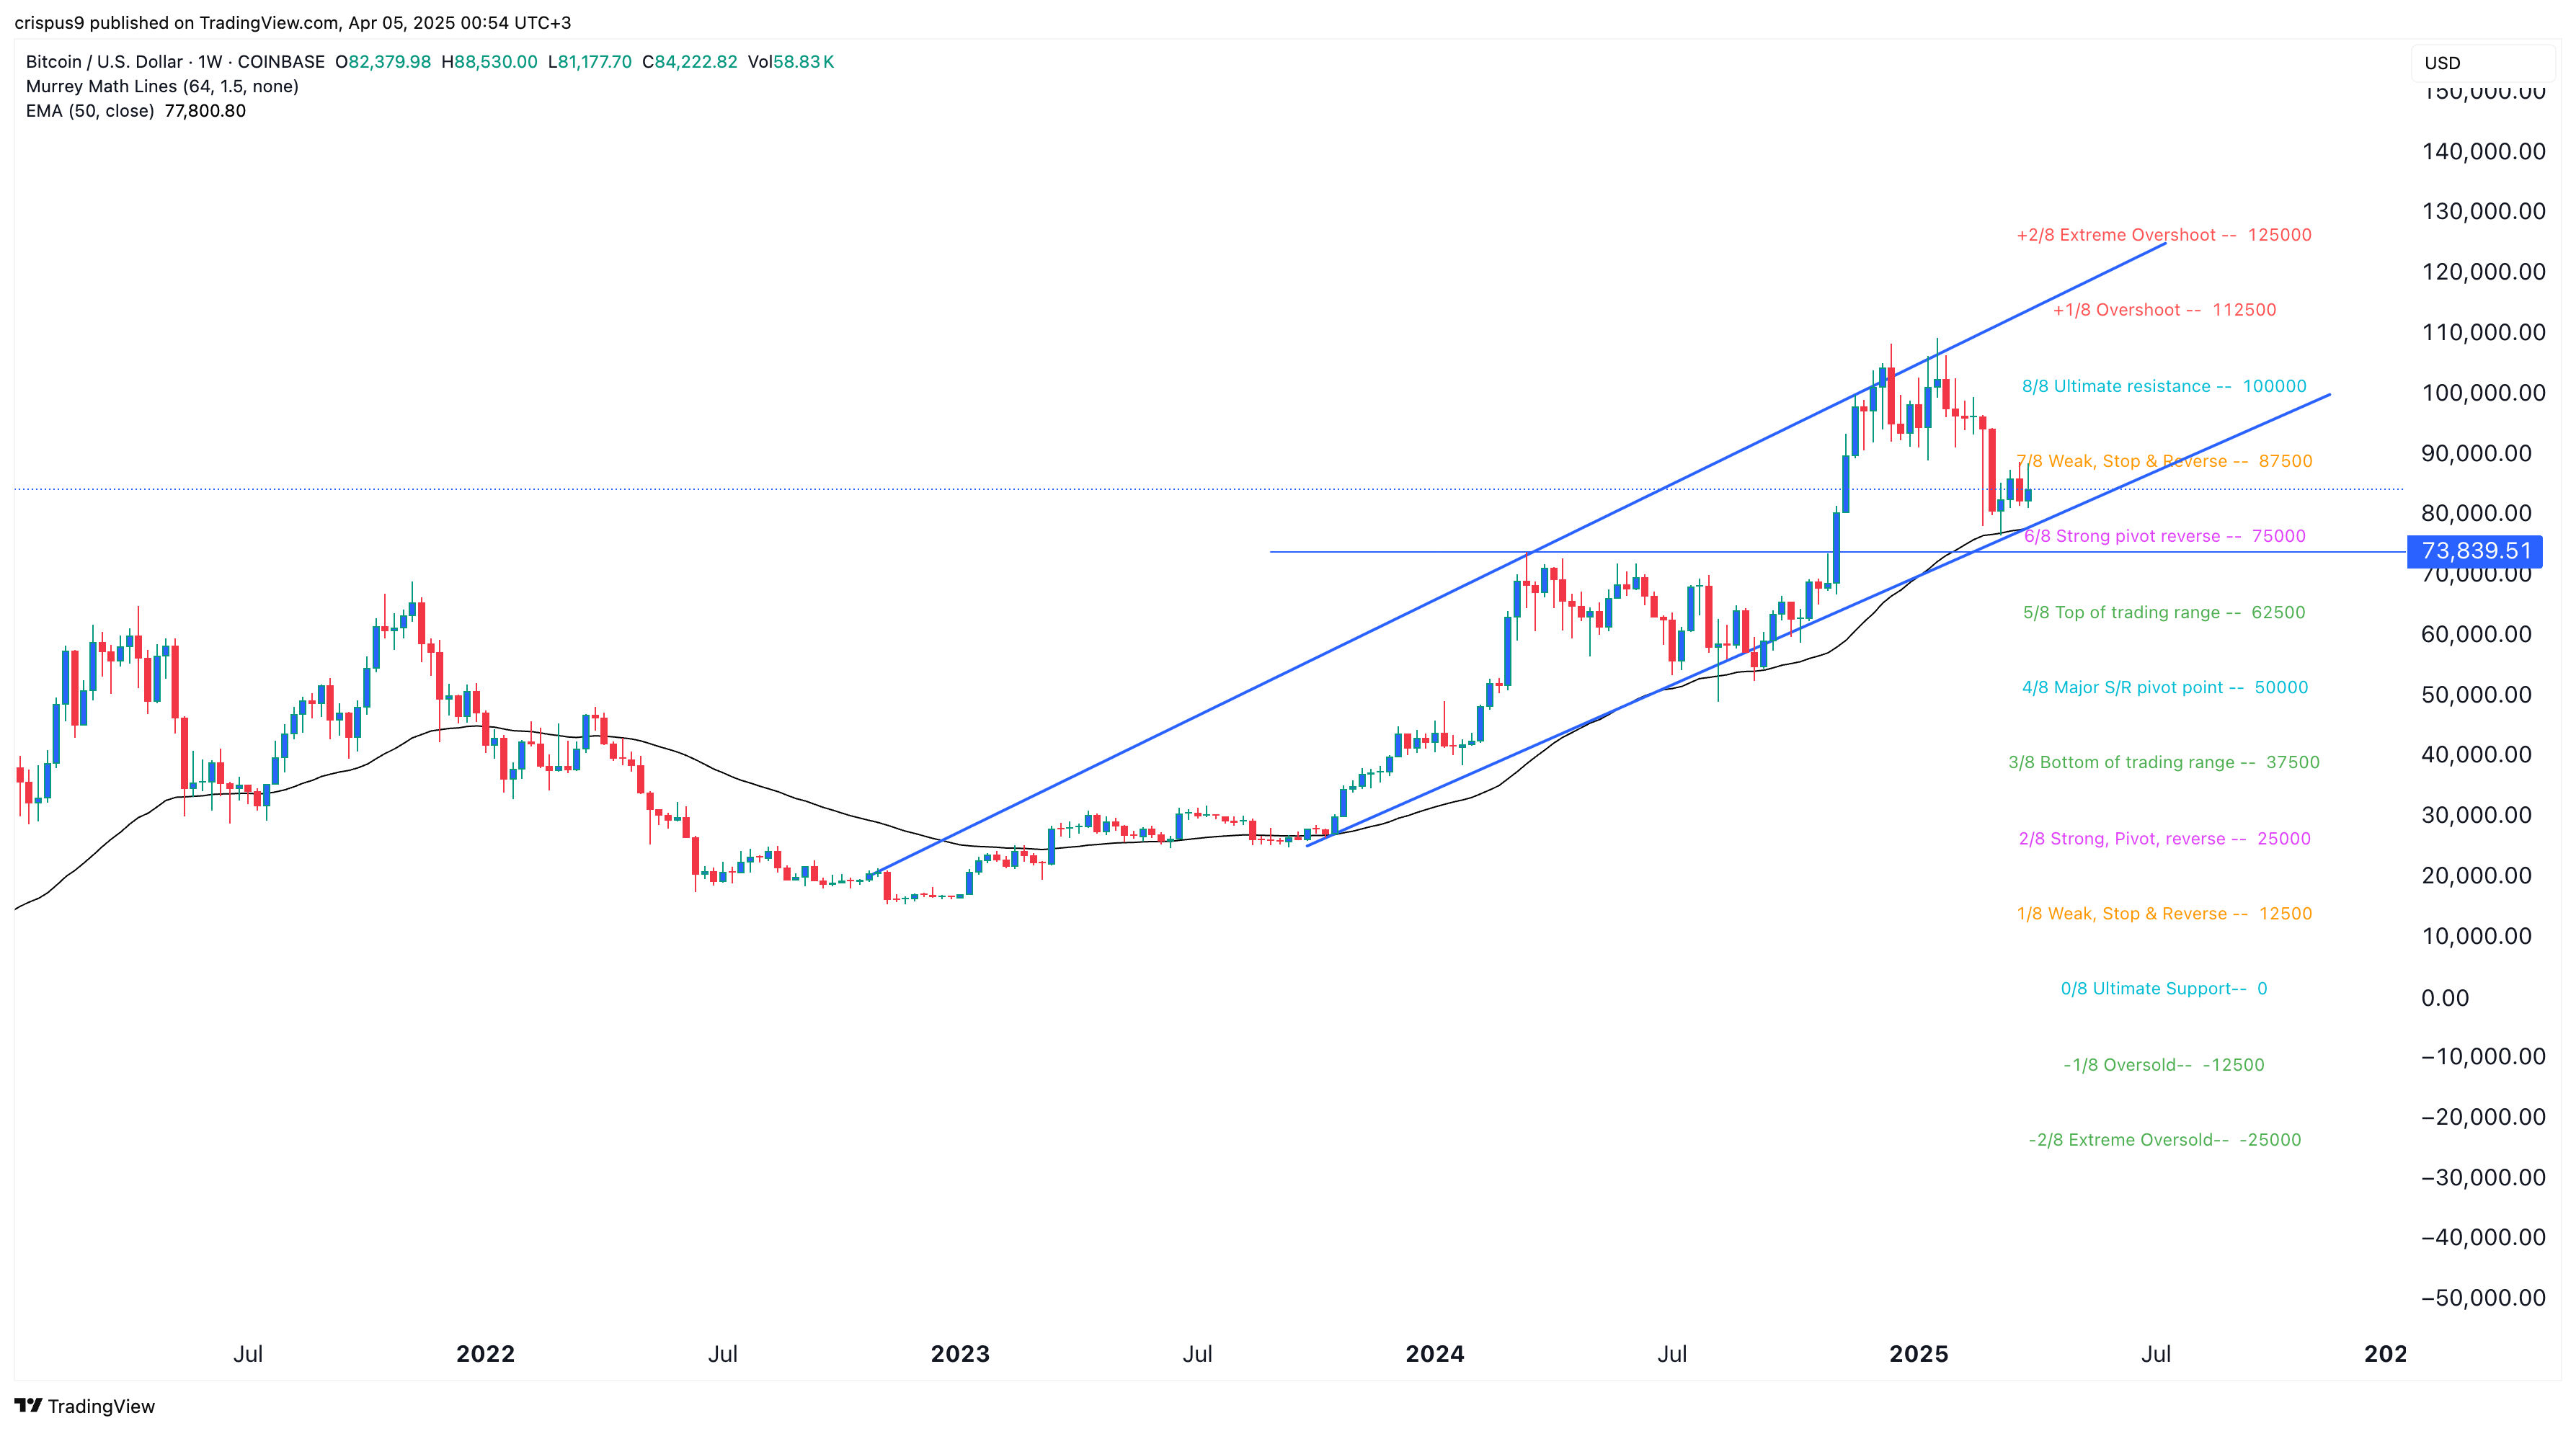
Bitcoin price continues to consolidate between $80,000 and $90,000 as investors look for the next major catalyst. BTC was trading at $84,000 on Friday evening even as the Nasdaq 100, S&P 500, Dow Jones, and the fear and greed index sunk. This article explains why Bitcoin could be boosted by tumbling bond yields and crude oil prices.
Crude oil, US bond Yields, and impact on Crypto
The crypto market, crude oil, and bonds are all highly unrelated assets. However, an in-depth look shows the latter two could have a major impact on Bitcoin and the crypto market.
The reason is that crude oil price is in a strong downward trend, with Brent having fallen to $64 this week, marking its lowest level since August 2021. It has tumbled by over 31% from its highest level last week.
The bond market is also experiencing significant activity, with the 10-year yield plunging to 3.95% on Friday. The 30-year and two-year yields dropped to 4.41% and 3.5%, respectively.
Crude oil and the performance of the bond market signal that the market anticipates that the US will go through a recession. A recession is characterized by weak consumer spending and low oil demand.
Read more: EOS Price Prediction: How High Can the Future Vaulta Token Get?
Therefore, bond yields are decreasing as investors anticipate that the Fed will hold an emergency meeting and intervene as it has done in the last crises. For example, Fed officials met and announced huge interest rate cuts during the COVID-19 pandemic.
While Jerome Powell has ruled out interest rate cuts for now, the reality is that the Fed will have no alternative than to cut rates. He has already warned that Trump’s tariffs will slow the economy this year, while analysts at Goldman Sachs and PIMCO warned that the US will sink into a recession.
Falling crude oil prices and bond yields are a signal that the Fed may cut rates, which could boost Bitcoin and other crypto prices.
Bitcoin Price Prediction: Technical Analysis


BTC price chart | Source: TradingView
The price of Bitcoin remains in a bull run when you look at the longer-term chart. A good example of this is the weekly chart, which shows that the coin has formed an ascending channel. This channel is made up of a series of higher highs and higher lows, with the recent drop being part of the latter. It is hovering just above the channel’s lower side.
Bitcoin price has remained above the 50-week moving average. It is also slightly above the strong pivot reverse level of the Murrey Math Lines tool. Therefore, BTC price could potentially bounce back as bulls target the all-time high of $109,200.
Read more: Top 3 Pi Network Rivals to Buy as the Pi Coin Price Sinks


