

- Bitcoin price meets a suppressive force near the $24,000 level.
- BTC price shows significant movement in daily transactions, hinting that large players are up to something behind the scenes.
- Invalidation of the uptrend is a daily closing candle below $23,149.
Bitcoin price shows conerning signals behind the scenes. Technichal and On-chain analysis is utilized to gage market behaviour.
Bitcoin price is at a fork in the road
Bitcoin price has shown an applaudable price performance in the last few weeks. The peer-to-peer digital currency has propelled towards a weekly high at $ 24,921 since witnessing a low at 17,592 just two months earlier in July. Despite the 40% rally, the trajectory has not been a smooth sailing ship. Several technical indicators and onchain analysis tools confound the idea of a weakening trend.
Bitcoin price currently auctions at $24,238. A profit-taking consolidation unfolds near last week’s forecasted target of $24,600. The Relative Strength Index shows classic bearish divergence, while the volume profile indicator shows a lack of interest from large capital players.
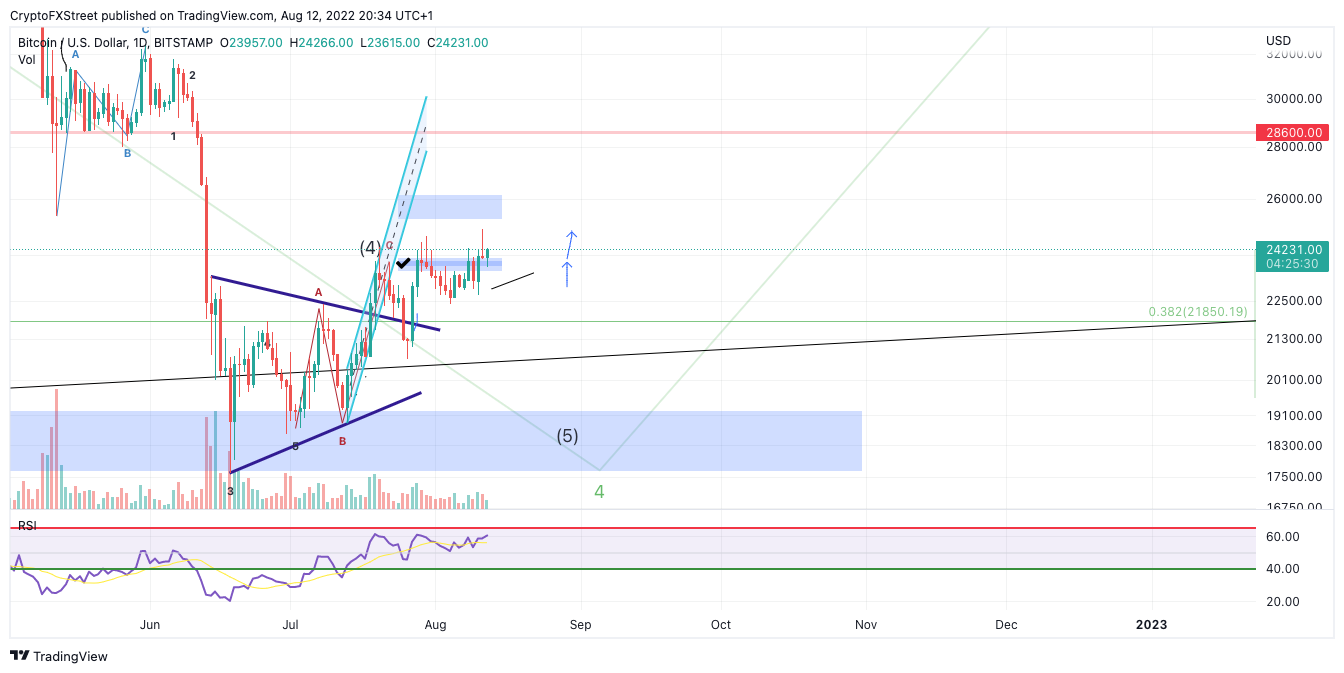
BTC/USDT 1-Day Chart
Additionally, Santiment’s Active Transactions Indicator BTC price has shown a considerable uptick in daily transactions. On May 4, May 14, and June 24, the indicator showed a similar sporadic upswing, each time followed by a minimum 20% plummet in the Bitcoin price shortly after.
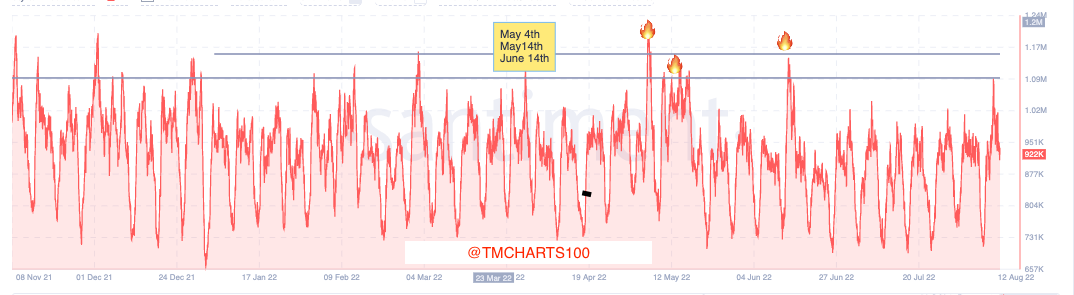
Santiment Active Transactions 1-Hour Scale
Bitcoin price could still rally higher towards $26,800, but early ` of the downtrend scenario will be a daily close below $23,149. If the bears can produce said price action, they may be able to induce a sellers’ frenzy targeting $18,500, resulting in up to a 20% decline from the current Bitcoin price.
In the following video, our analysts deep dive into the price action of Bitcoin, analyzing key levels of interest in the market. -FXStreet Team
 Drops Below $64K, Ether (ETH) Falls")
