

- BTC’s price plummeted under the $65k mark.
- Metrics and market indicators suggested a further price decline.
Bitcoin’s [BTC] price has been moving inside a parallel channel for quite a few weeks now. While its price consolidated in that range, a sell signal flashed on BTC’s chart, which might have resulted in a price drop.
Bitcoin: Selling pressure is rising
AMBCrypto reported a few days ago that BTC’s price was moving in a parallel channel between its ATH and $61k. The consolidation phase started in March and is still going on.
In the meantime, Ali, a popular crypto analyst, recently posted a tweet mentioning an interesting development. As per the tweet, the TD Sequential indicator flashed a sell signal on the 12-hour chart. This was the case as Bitcoin was facing resistance at the mid-level of a parallel channel.
To see whether investors actually used that opportunity to sell BTC, AMBCrypto analyzed CryptoQuant’s data.
We found that BTC’s exchange reserve registered a sharp uptick on the 24th of April, which was hours after the sell signal was flashed. This meant that selling pressure on BTC was increasing.
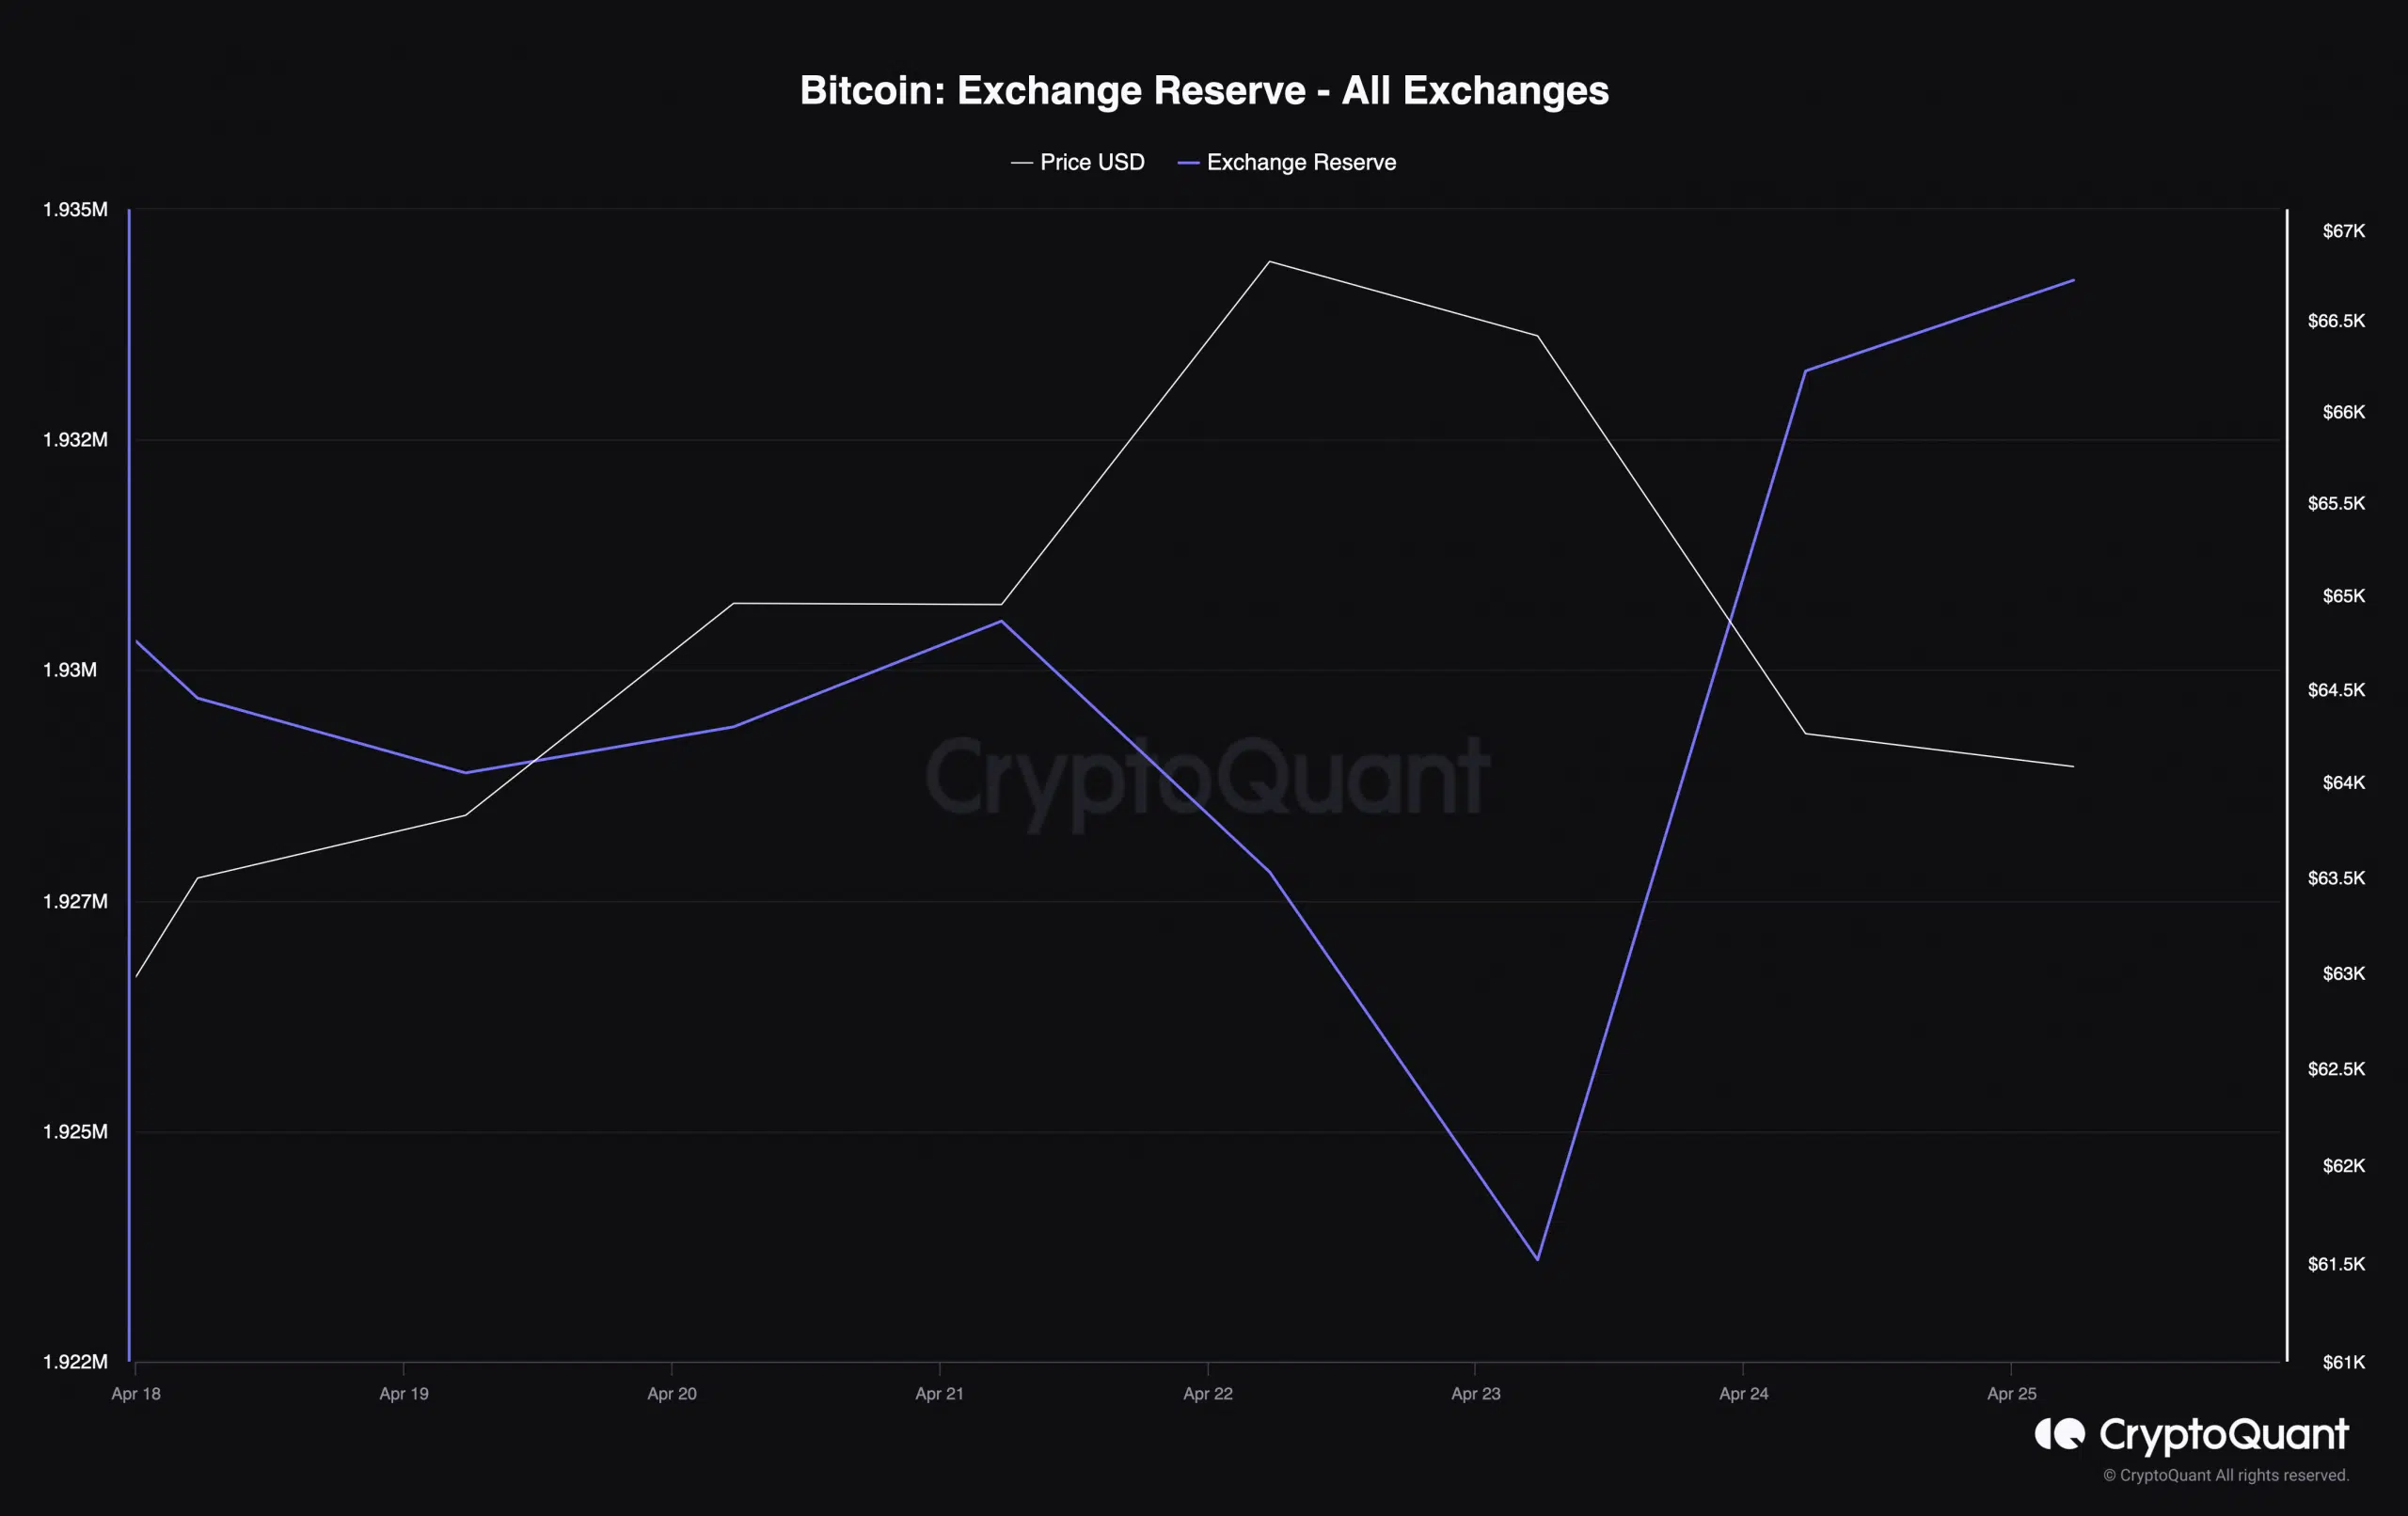
Source: CryptoQuant
Selling pressure is causing a price correction
The hike in selling pressure had a negative impact on the king of cryptos’ price action.
According to CoinMarketCap, after a comfortable weekly bull run, BTC’s price dropped by more than 4% in the last 24 hours. At the time of writing, the coin was trading at $64,128.65 with a market capitalization of over $1.26 trillion.
To see whether BTC’s plummeting under $65k would trigger a further downtrend, AMBCrypto analyzed BTC’s metrics.
We found that its aSORP turned red. This meant that more investors were selling at a profit. In the middle of a bull market, it can indicate a market top.
In fact, selling pressure remained dominant among both US and Korean investors as BTC’s Korea and Coinbase premiums were red.

Source: CryptoQuant
The market in general also turned bearish on the coin. This was evident from the drop in its weighted sentiment as it entered the negative zone.
Notably, Bitcoin’s social volume also dropped over the last week, reflecting a decline in its popularity in the crypto space.
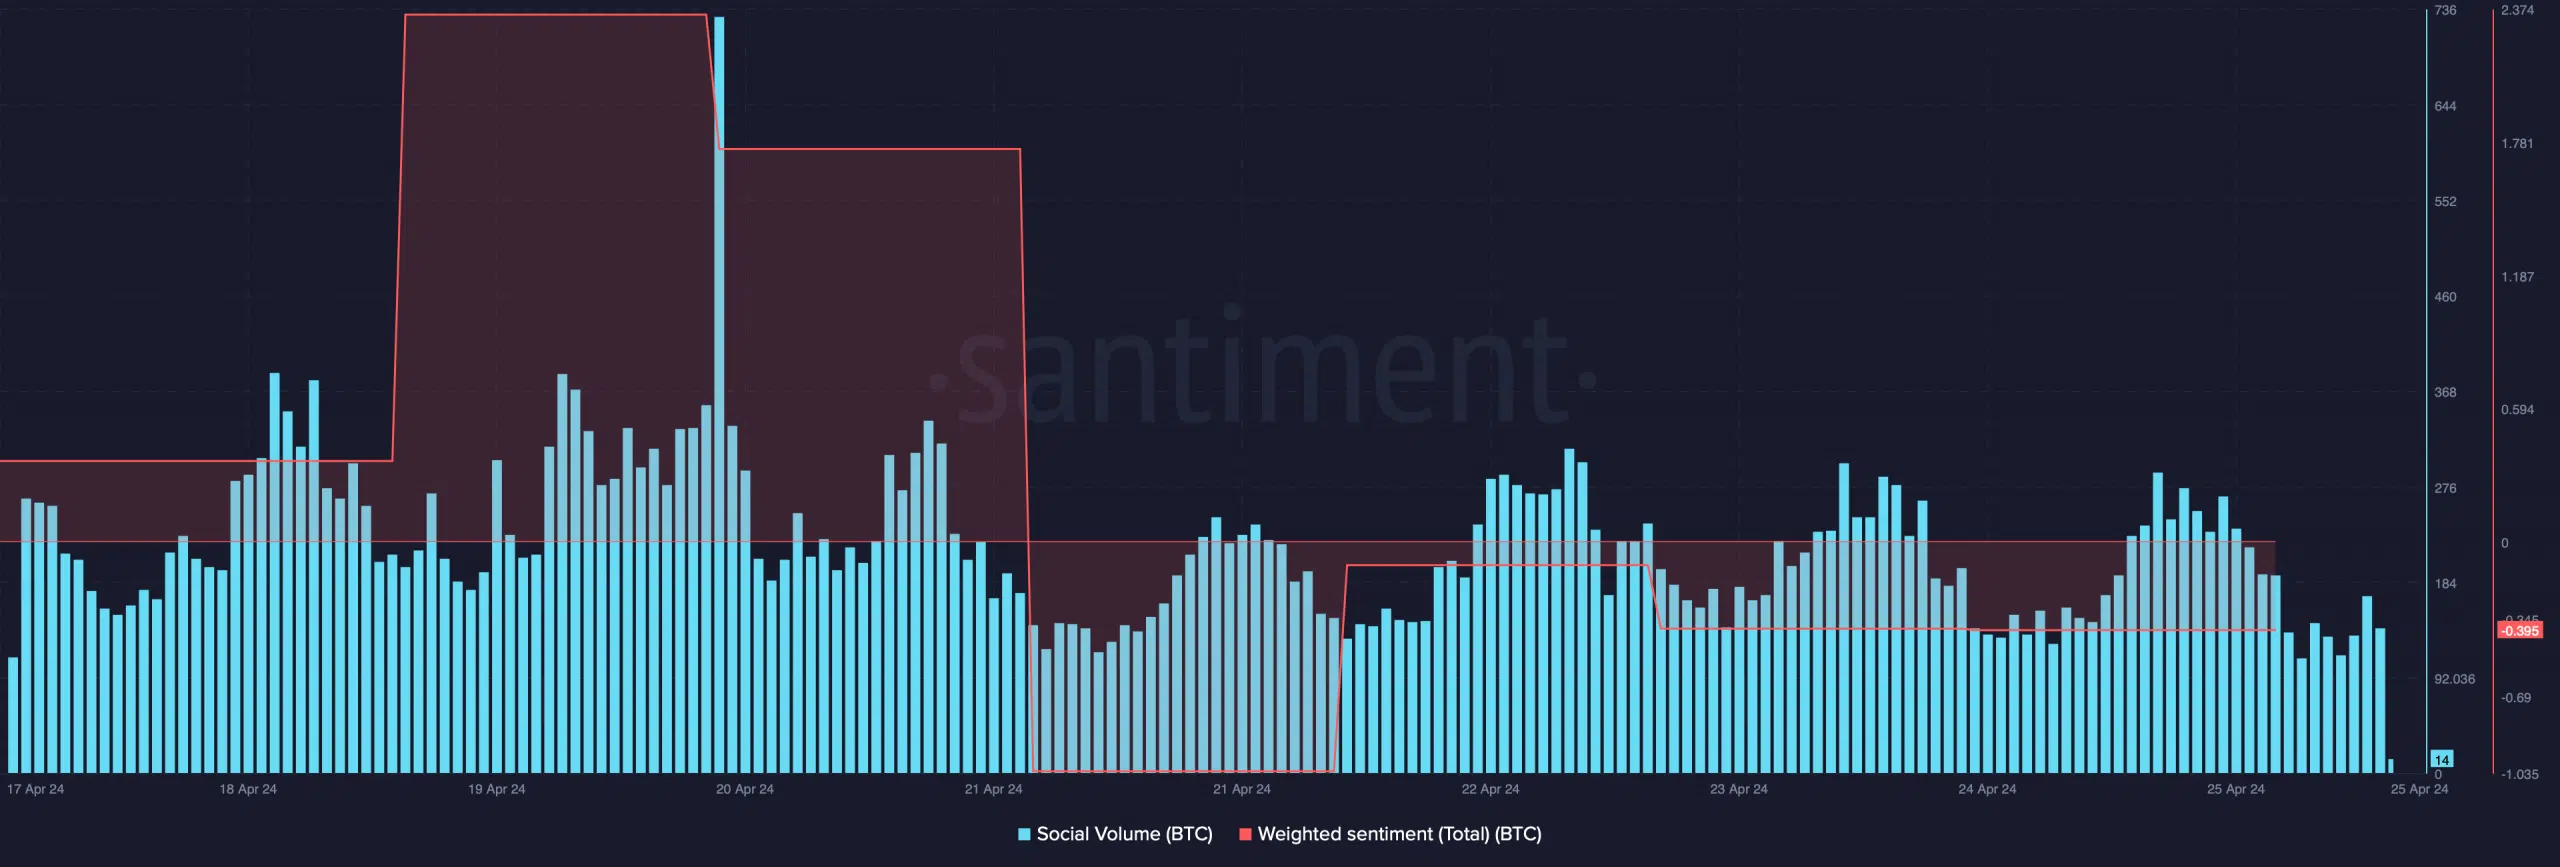
Source: Santiment
Read Bitcoin’s [BTC] Price Prediction 2024-25
We then checked BTC’s daily chart to see what technical indicators had to suggest. The MACD displayed a bearish crossover.
Its Relative Strength Index (RSI) also registered a downtick and was headed further below the neutral mark of 50. These hinted at a further decline in price, which might result in BTC plummeting to $61k in the coming days.
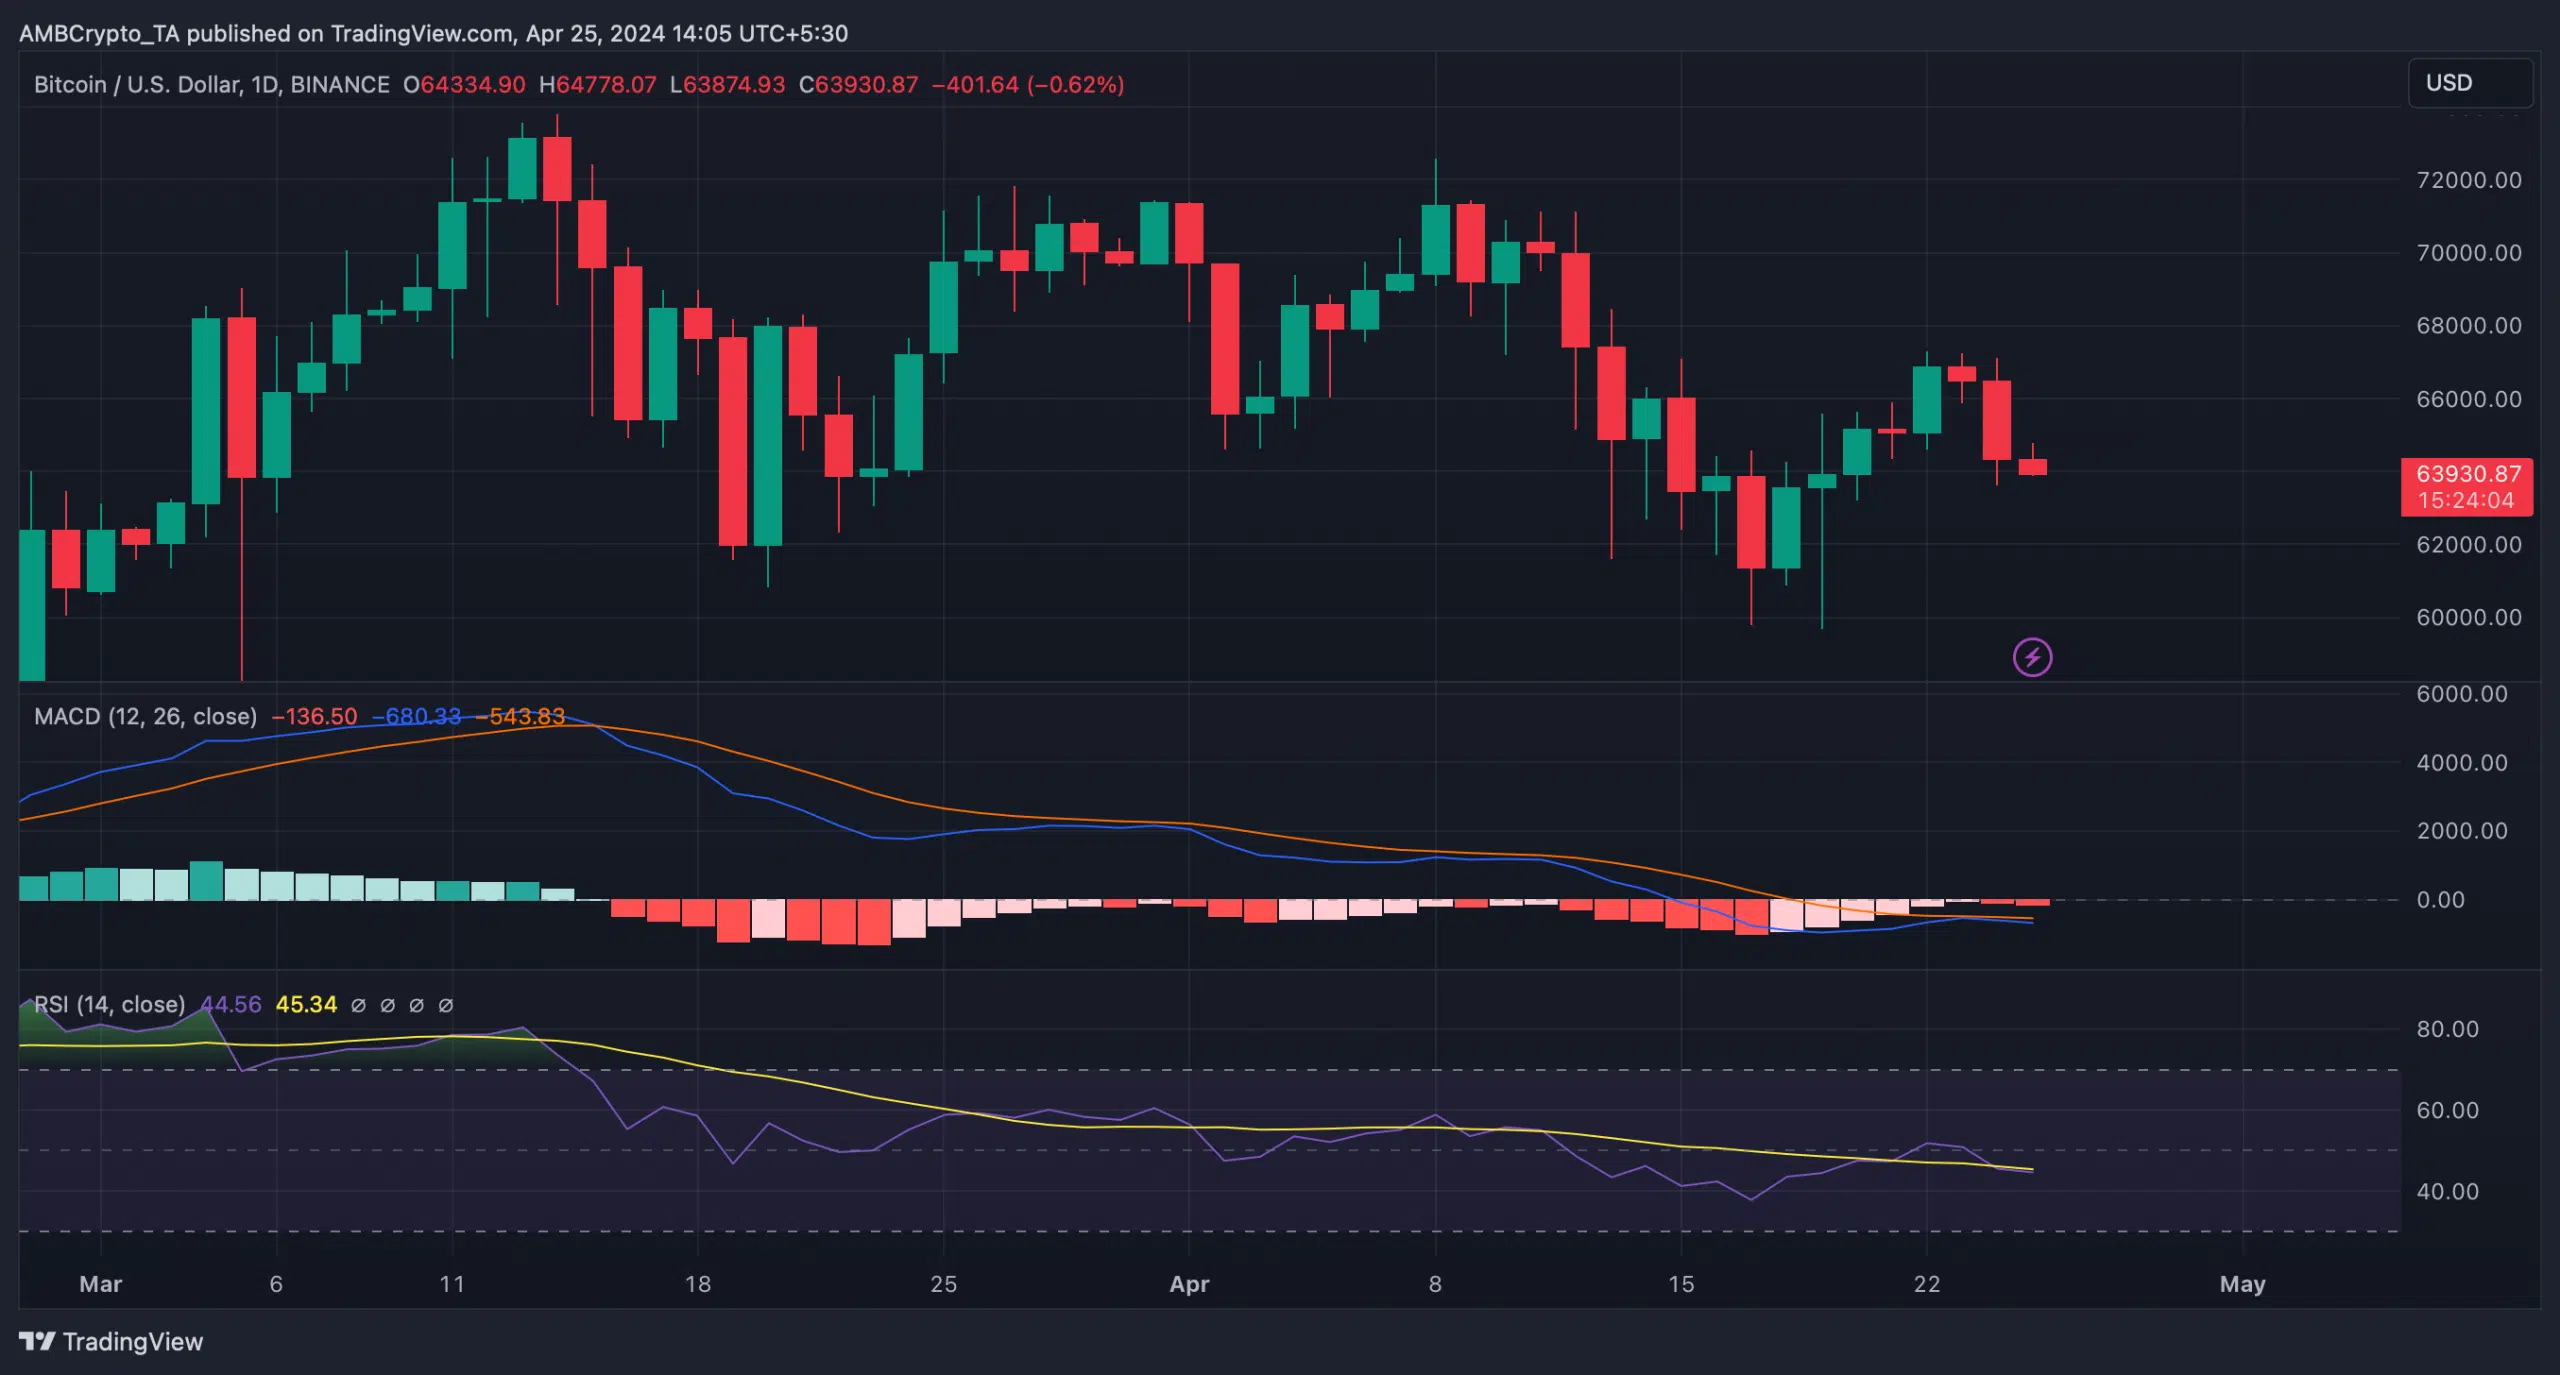
Source: TradingView

