

Bitcoin (BTC/USD) Analysis
Key Highlights
Bitcoin started the new week with positive momentum after the Fed Chairman’s comments. It has struggled to close above the symmetric triangle ($43,300).
Over 480,000 new Bitcoin addresses were created on March 17 – a strong surge which could see further upside.
Technical Analysis
Intraday trend – Bullish
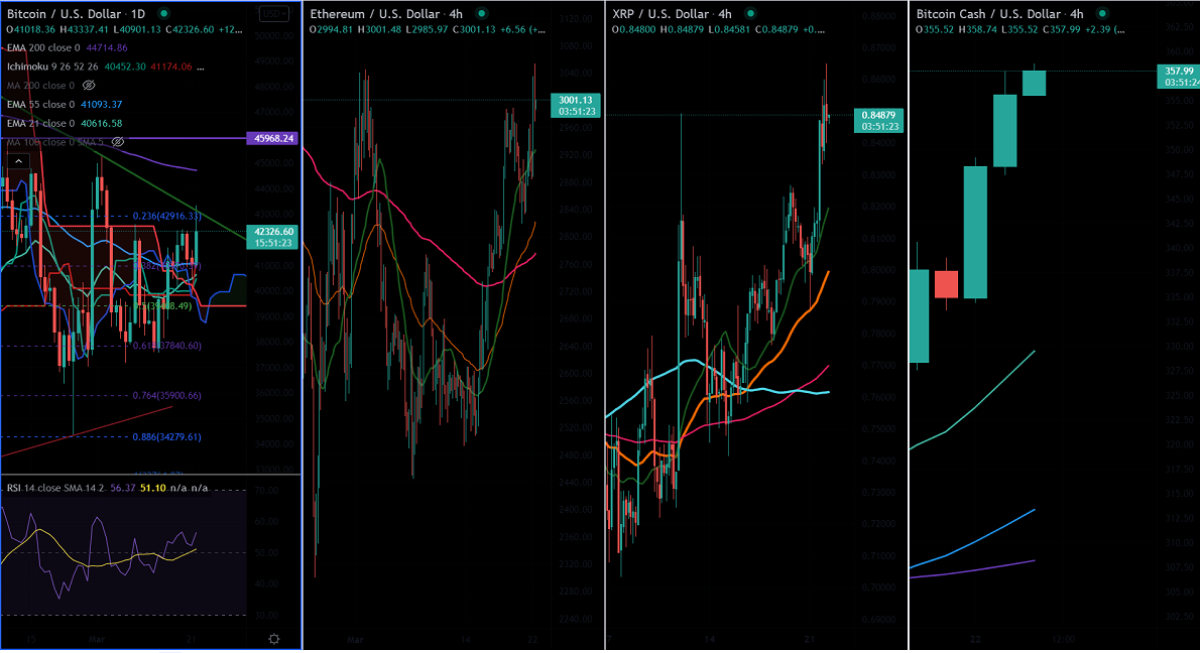
On the daily chart, the pair is trading above Tenken-sen ($39,986), Kijun-sen ($39,828), and above Ichimoku Kumo cloud ($40,238). It hits a high of $43,337 at the time of writing and is currently trading around $42,239.
Major support is seen at $40,445, any drop below this level would confirm a minor weakness. A dip till $37,000 (Mar 7th low)/$34,000/$32,950 (Jan 24th low)/$30,000/$28,600 is likely.
The immediate resistance is around $43,300, any daily close above that level confirms further bullishness. A jump to $45,356 (200-day EMA)/$50,000 is possible.
RSI – bullish
A possible strategy could be a long on dips $41,480-500 with SL around $39,000 for TP of $50,000.
TradingView
ETH/USD Daily Outlook
Key Highlights
ETH/USD jumped to $3,053 following the footsteps of Bitcoin. It is currently trading around $2,990.70.
On the daily chart, the pair is trading above Tenken-sen ($27,40.95), Kijun-sen ($2,672), and slightly below Ichimoku Kumo cloud ($3,026).
Major support is seen at $2,800, any drop below this level confirms the bearish trend. A dip till $2,740/ $2,670/$2,600/$2,500/$2,445/$2,300 (Feb 24th low)/$2,150 is possible.
The immediate resistance is around $3,026; any close above targets of $3,300/$3,512 are possible.
RSI – Neutral
A possible strategy could be a long around $2,925-30 with SL around $2,800 for TP of $3,500.
XRP/USD Outlook
Intraday trend – Bullish
Key support – $0.70, $0.50
Key Resistance – $0.865 (Mar 12th 2022)
XRP’S price is holding above short-term (55-day EMA) and long-term (200- day EMA) on the daily chart. Any breach above $0.8650 confirms a bullish continuation; it is currently trading around $0.8488. Look for a short-term trend reversal only if it breaches $1.02 (23rd Dec high).
A likely option would be to buy above $0.860 with SL around $0.80 for a TP of $1.02.
BCH/USD Outlook
Intraday trend – Bullish
Key support – $300, $259
Key Resistance – $363
BCH/USD’s price holds above short-term (55-day EMA) and long-term (100- day EMA) on the daily chart. Any break out above $363 confirms further bullishness – it is currently trading around $355.58. Look for a short-term trend reversal only if it breaks $430.
A possible option would be long around $320 with SL around $270 for a TP of $395/$429.
Bitcoin Support /Resistance
R1- $43,300, R2- $46,000, R3- $50,000
S1- $37,000, S2- $34,000, S3- $30,000
Ethereum Support/Resistance
Resistance
R1- $3,030, R2- $3,200, R3- $3,300
Support
S1- $2 740, S2- $2,670, S3- $2,600
See more at the Newsweek Cryptocurrency Index:
Getty Images
Disclaimer: The above analysis is only for market information purposes. Newsweek does not offer any advisory or brokerage services, nor does it recommend or advise investors or traders to buy or sell particular stocks, securities or other investments.


