

Bitcoin (BTC) is once again attempting to reclaim the $60,000 psychological level after a recent dip triggered a broader selloff in the cryptocurrency market.
This recovery comes as traders and investors brace for a busy week, with key economic data releases and geopolitical factors expected to heavily influence market sentiment.
The focus remains on Bitcoin’s price movements, with the Bitcoin Rainbow Chart offering crucial forecasts for BTC’s trajectory by the end of August 2024.
Despite recent volatility, Bitcoin has demonstrated notable resilience following the August 5 market crash, quickly rebounding amid positive shifts in the global crypto regulatory landscape.
Optimism was initially spurred by catalysts such as the approval of a Solana (SOL) ETF in Brazil and Russia’s move to legalize crypto mining.
These developments briefly lifted Bitcoin’s price, though the rally was short-lived due to the temporary nature of the regulatory changes, particularly since Russia’s crypto mining law won’t take effect until November.
Economic and geopolitical influences on Bitcoin’s price
The anticipation surrounding the U.S. Consumer Price Index (CPI) inflation data for July, set for release on August 14, 2024, has also played a significant role in capping Bitcoin’s upward momentum.
This data is expected to offer critical insights into the Federal Reserve’s upcoming decisions, which could have a substantial impact on risk assets like Bitcoin.
Moreover, institutional behavior has been a key driver of recent price movements, with a pause in stablecoin accumulation and outflows from Bitcoin ETFs contributing to a 4.5% drop in BTC price on August 12, pushing it below the $60,000 level.
Adding to market uncertainty are geopolitical tensions, particularly in the Middle East, and the ongoing U.S. presidential race. The U.S. decision to recognize Bitcoin as a reserve asset has introduced new dynamics, with large investors and market makers exerting significant influence over price movements.
As the election approaches, with Trump emerging as a favorite among crypto enthusiasts, BTC spot ETF flows and demand are likely to be swayed by the evolving political landscape.
Bitcoin ‘Rainbow Chart’ predicts BTC price range for end of August 2024
The Bitcoin Rainbow Chart categorizes the price of Bitcoin into nine distinct color-coded zones, each reflecting different market sentiments and price ranges. These zones range from extreme lows, where the sentiment is heavily bearish and Bitcoin is seen as significantly undervalued, to extreme highs, where prices may indicate a speculative bubble, suggesting a potential market correction is near.
As Bitcoin hovers around the $58,643.08 mark, the Bitcoin Rainbow Chart provides key insights into where the price might head by the end of August 2024.
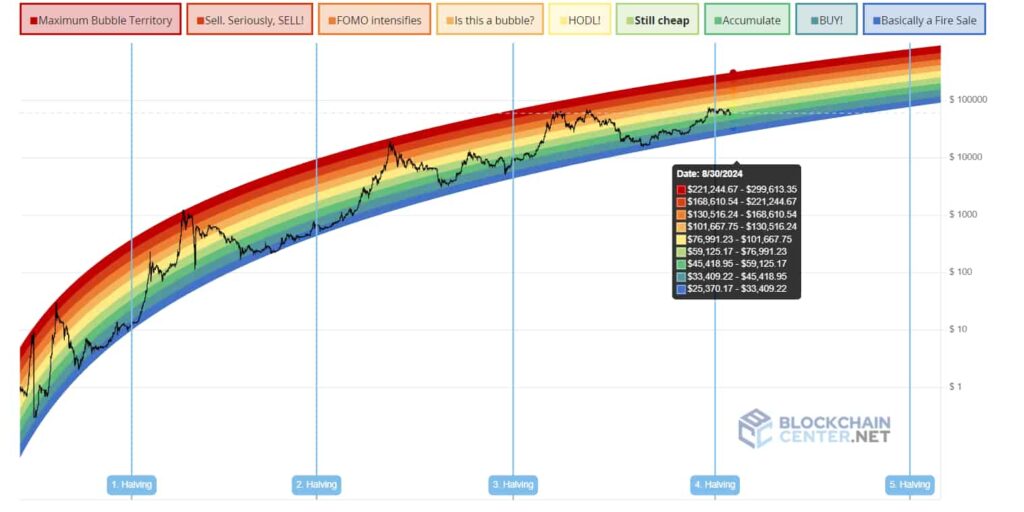
This chart, well-regarded for its ability to highlight long-term trends, helps traders and investors assess market conditions and make informed decisions.
Currently, Bitcoin is placed just within the “Accumulate” zone ($45,418.95 to $59,125.17). This zone suggests that while Bitcoin is no longer at its lowest point, it still presents a favorable opportunity for investors looking to add to their positions, with expectations of further price increases.
If Bitcoin rises above $59,125.17, it would move into the “Still Cheap” zone ($59,125.17 to $76,991.23). This would indicate that while the price is climbing, it remains within a range that offers value, allowing for continued accumulation before potentially reaching higher valuations.
Should Bitcoin advance further into the “HODL!” zone ($76,991.23 to $101,667.75), it would signal a strengthening market sentiment, where holding onto existing positions becomes increasingly favorable as the price may continue to appreciate.
In summary, the Bitcoin Rainbow Chart suggests that by the end of August 2024, BTC could either remain within the “Accumulate” or “Still Cheap” zones, presenting ongoing opportunities for accumulation, or it could climb into higher zones, signaling stronger market sentiment but also increasing caution for potential overvaluation.
As Bitcoin’s price nears the $60,000 psychological level, these zones provide a clear roadmap for navigating the market’s next moves.
Disclaimer: The content on this site should not be considered investment advice. Investing is speculative. When investing, your capital is at risk.


