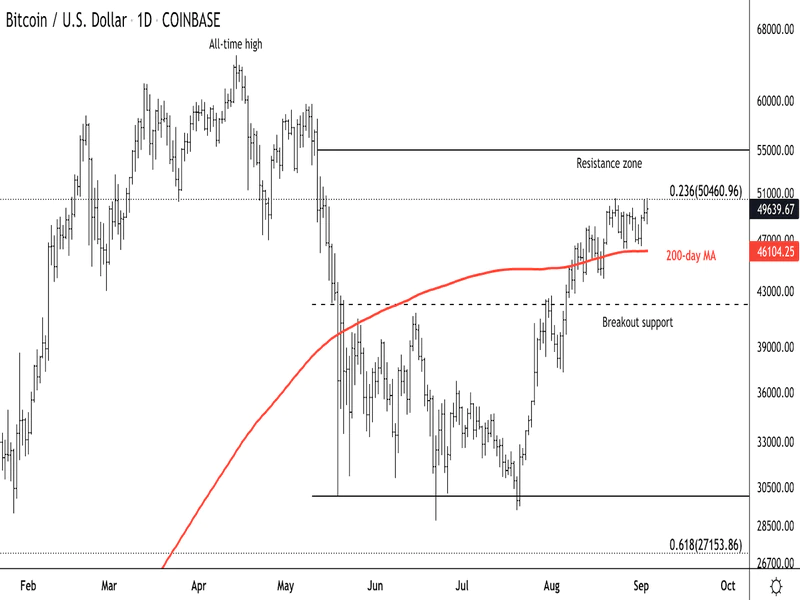
Bitcoin (BTC) buyers are making another attempt at the $50,000 resistance level. A breakout would yield further upside towards $55,000 as momentum improves. Lower support is seen at the 200-day moving average around $46,000.
The short-squeeze rally that began in July has been well supported on pullbacks. Signs of upside exhaustion and overbought signals led to a weeklong consolidation phase, which could resolve to the upside.
Bitcoin was trading around $49,600 at press time and is up 2% over the past week.
Bitcoin daily price chart (CoinDesk, TradingView)
-
The relative strength index (RSI) on the daily chart is declining from overbought levels and should stabilize around the neutral mark at 50.
-
Bitcoin is trading above the upward sloping 50-day and 200-day moving averages, signaling improving trend strength after a sharp correction earlier this year.
-
Bulls could remain active into the weekend, albeit limited towards $55,000 resistance over the short-term.


