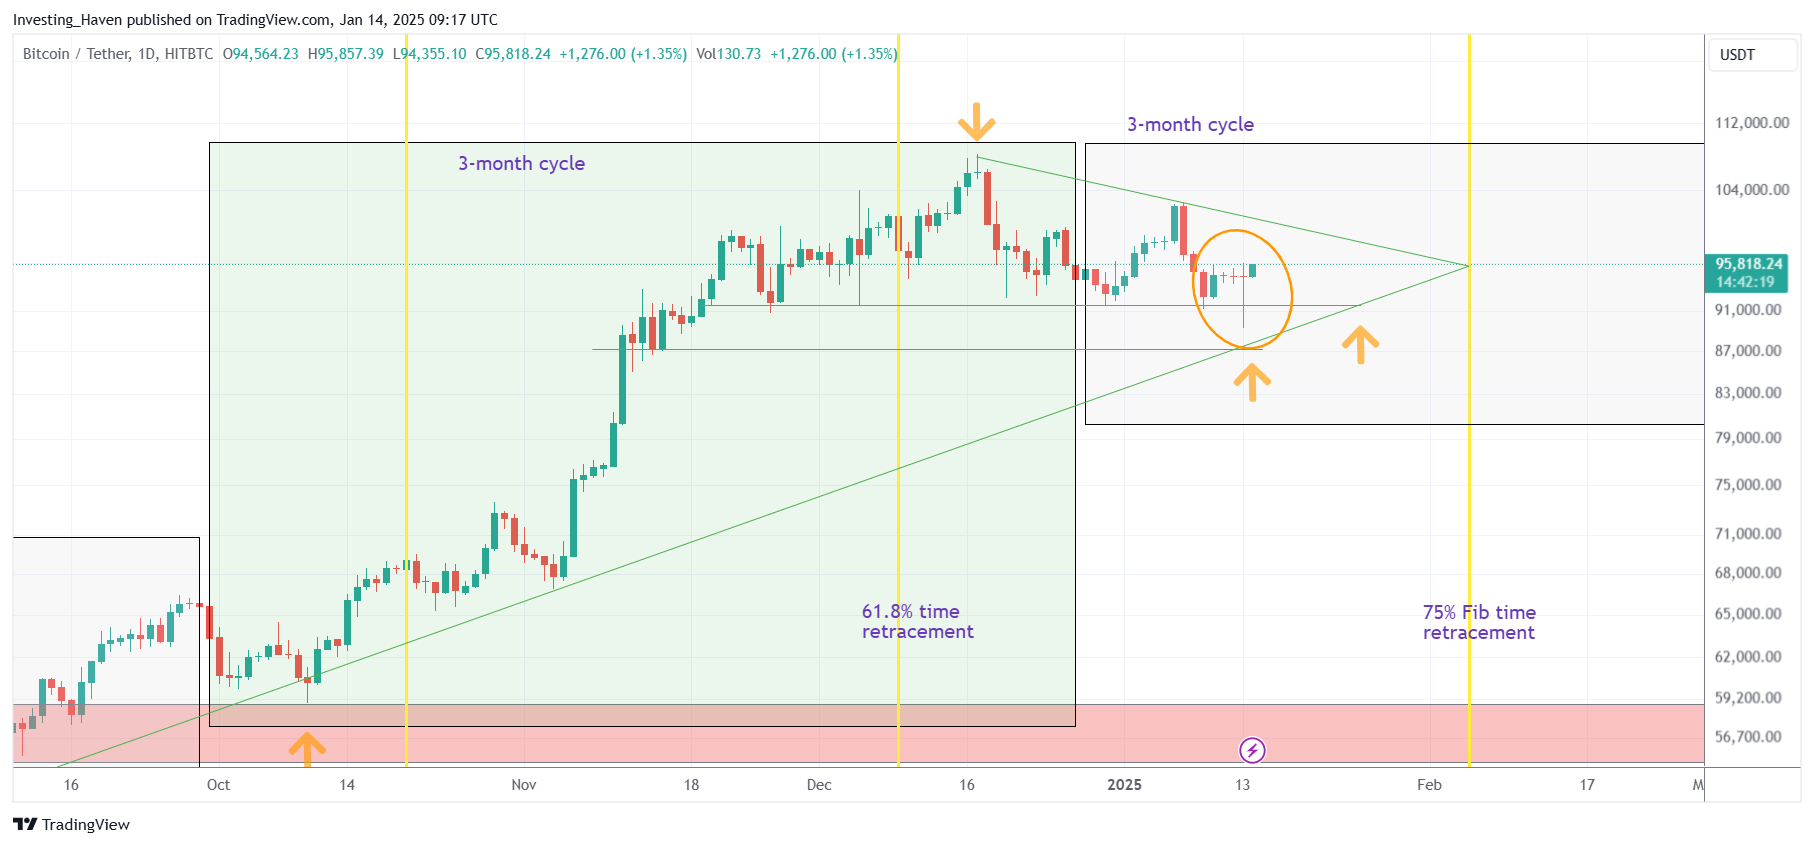
Bitcoin intraday buying on January 14th, 2025, confirmed where buying came in on Bitcoin’s chart. The BTC chart has a very clear message now.
If anything, from a chart perspective, large wicks tend to have predictive value.
RELATED – Bitcoin Seasonality Charts: Buy The Dip Underway?
What exactly does Bitcoin intraday buying on Jan 14th mean in terms of predictive value?
Bitcoin intraday buying – January 14th, 2025
First things first – the intraday recovery of Bitcoin on Jan 14th was nothing short of impressive.
RELATED – Bitcoin forecast 2025
There are many reasons for that:
- The fast pace of recovery, suggesting at very strong and broad buying interest below $90k.
- Relative strength against leading stock indexes – always great if BTC moves up faster than stock indexes.
- The specific point on the BTC chart where this happened.
- The wick that was printed!
Let’s look at the chart to map the points outlined above.
Bitcoin intraday buying – the BTC chart
What the Bitcoin chart reveals is very interesting to say the least:
- The rising trendline was respected even at the depth of selling on Jan 14th.
- The daily candle managed to close well above the bodies of the candles in the last 4 weeks.
- In doing so, BTC created what’s called a ‘higher low’.
What about the wick (Jan 14th candle)? Now that is a very powerful signal, for multiple reasons, see below.


Bitcoin’s ‘wick’
As said, the ‘wick’ was very strong.
What’s a wick? Per Investopedia:
A line found on a candle in a candlestick chart that is used to indicate where the price of a stock has fluctuated relative to the opening and closing prices. Essentially, these shadows illustrate the highest and lowest prices at which a security has traded over a specific time period.
A wick may have predictive value. This tends to happen especially when the wick is left on very important structure, either on the price or timeline axis or both.
In the case of Bitcoin, on Jan 14th, 2025, the wick was printed:
- Right below the critical $91k level on Bitcoin’s chart.
- In between the important 61.8% and 25% Fibonacci points on Bitcoin’s timeline.
- Right at a time when Bitcoin was creating a bullish triangle.
All these points are found on the BTC chart embedded in this article.
Did we say that BTC is expected to be bullish in 2025, but January would be all about creating support?
CONTINUE READING – Can Bitcoin (BTC) Break Through $100k In January 2025?


