

Bitcoin may be up for a bullish surge past its current all-time high to a new peak price if it breaks from its weekly RSI resistance.
The pioneering cryptocurrency has rebounded considerably in the past 24 hours, reclaiming $97,000 for the first time in three days. The much-needed bounce follows growing speculations that China will lift its years-long ban on Bitcoin and cryptocurrency.
Yifan He, the CEO of Chinese firm Red Date Technology, told CNBC yesterday that the chances that China will unban digital assets have exceeded 50%. Notably, pressure from Hong Kong’s flourishing crypto market fuels the rumored reassessment.
Meanwhile, amid the growing market momentum, an analyst has highlighted a catalyst for further upside. In a Feb. 19 post, notable market watcher Kevin Svenson predicted a Bitcoin price surge, citing historical reactions to a relative strength index (RSI) breakout.
Bitcoin Retesting Weekly RSI Resistance
Svenson highlighted an emerging trend following Bitcoin’s recent rebound. His Wednesday commentary highlights that Bitcoin’s RSI is retesting its weekly resistance. For perspective, an RSI indicator measures the magnitude of an asset’s price swing, showing overbought and oversold regions.
The analyst stressed the importance of this trend, stating that a successful breakout from the resistance reinstates Bitcoin’s long-term bullishness. He highlighted that Bitcoin’s RSI is retesting the supply trendline, and a successful breakout would push the premier asset to unprecedented highs.
The accompanying chart further explains the premise of this bullish suggestion. Bitcoin’s price has historically surged extensively when its RSI breaks on the weekly timeframe.
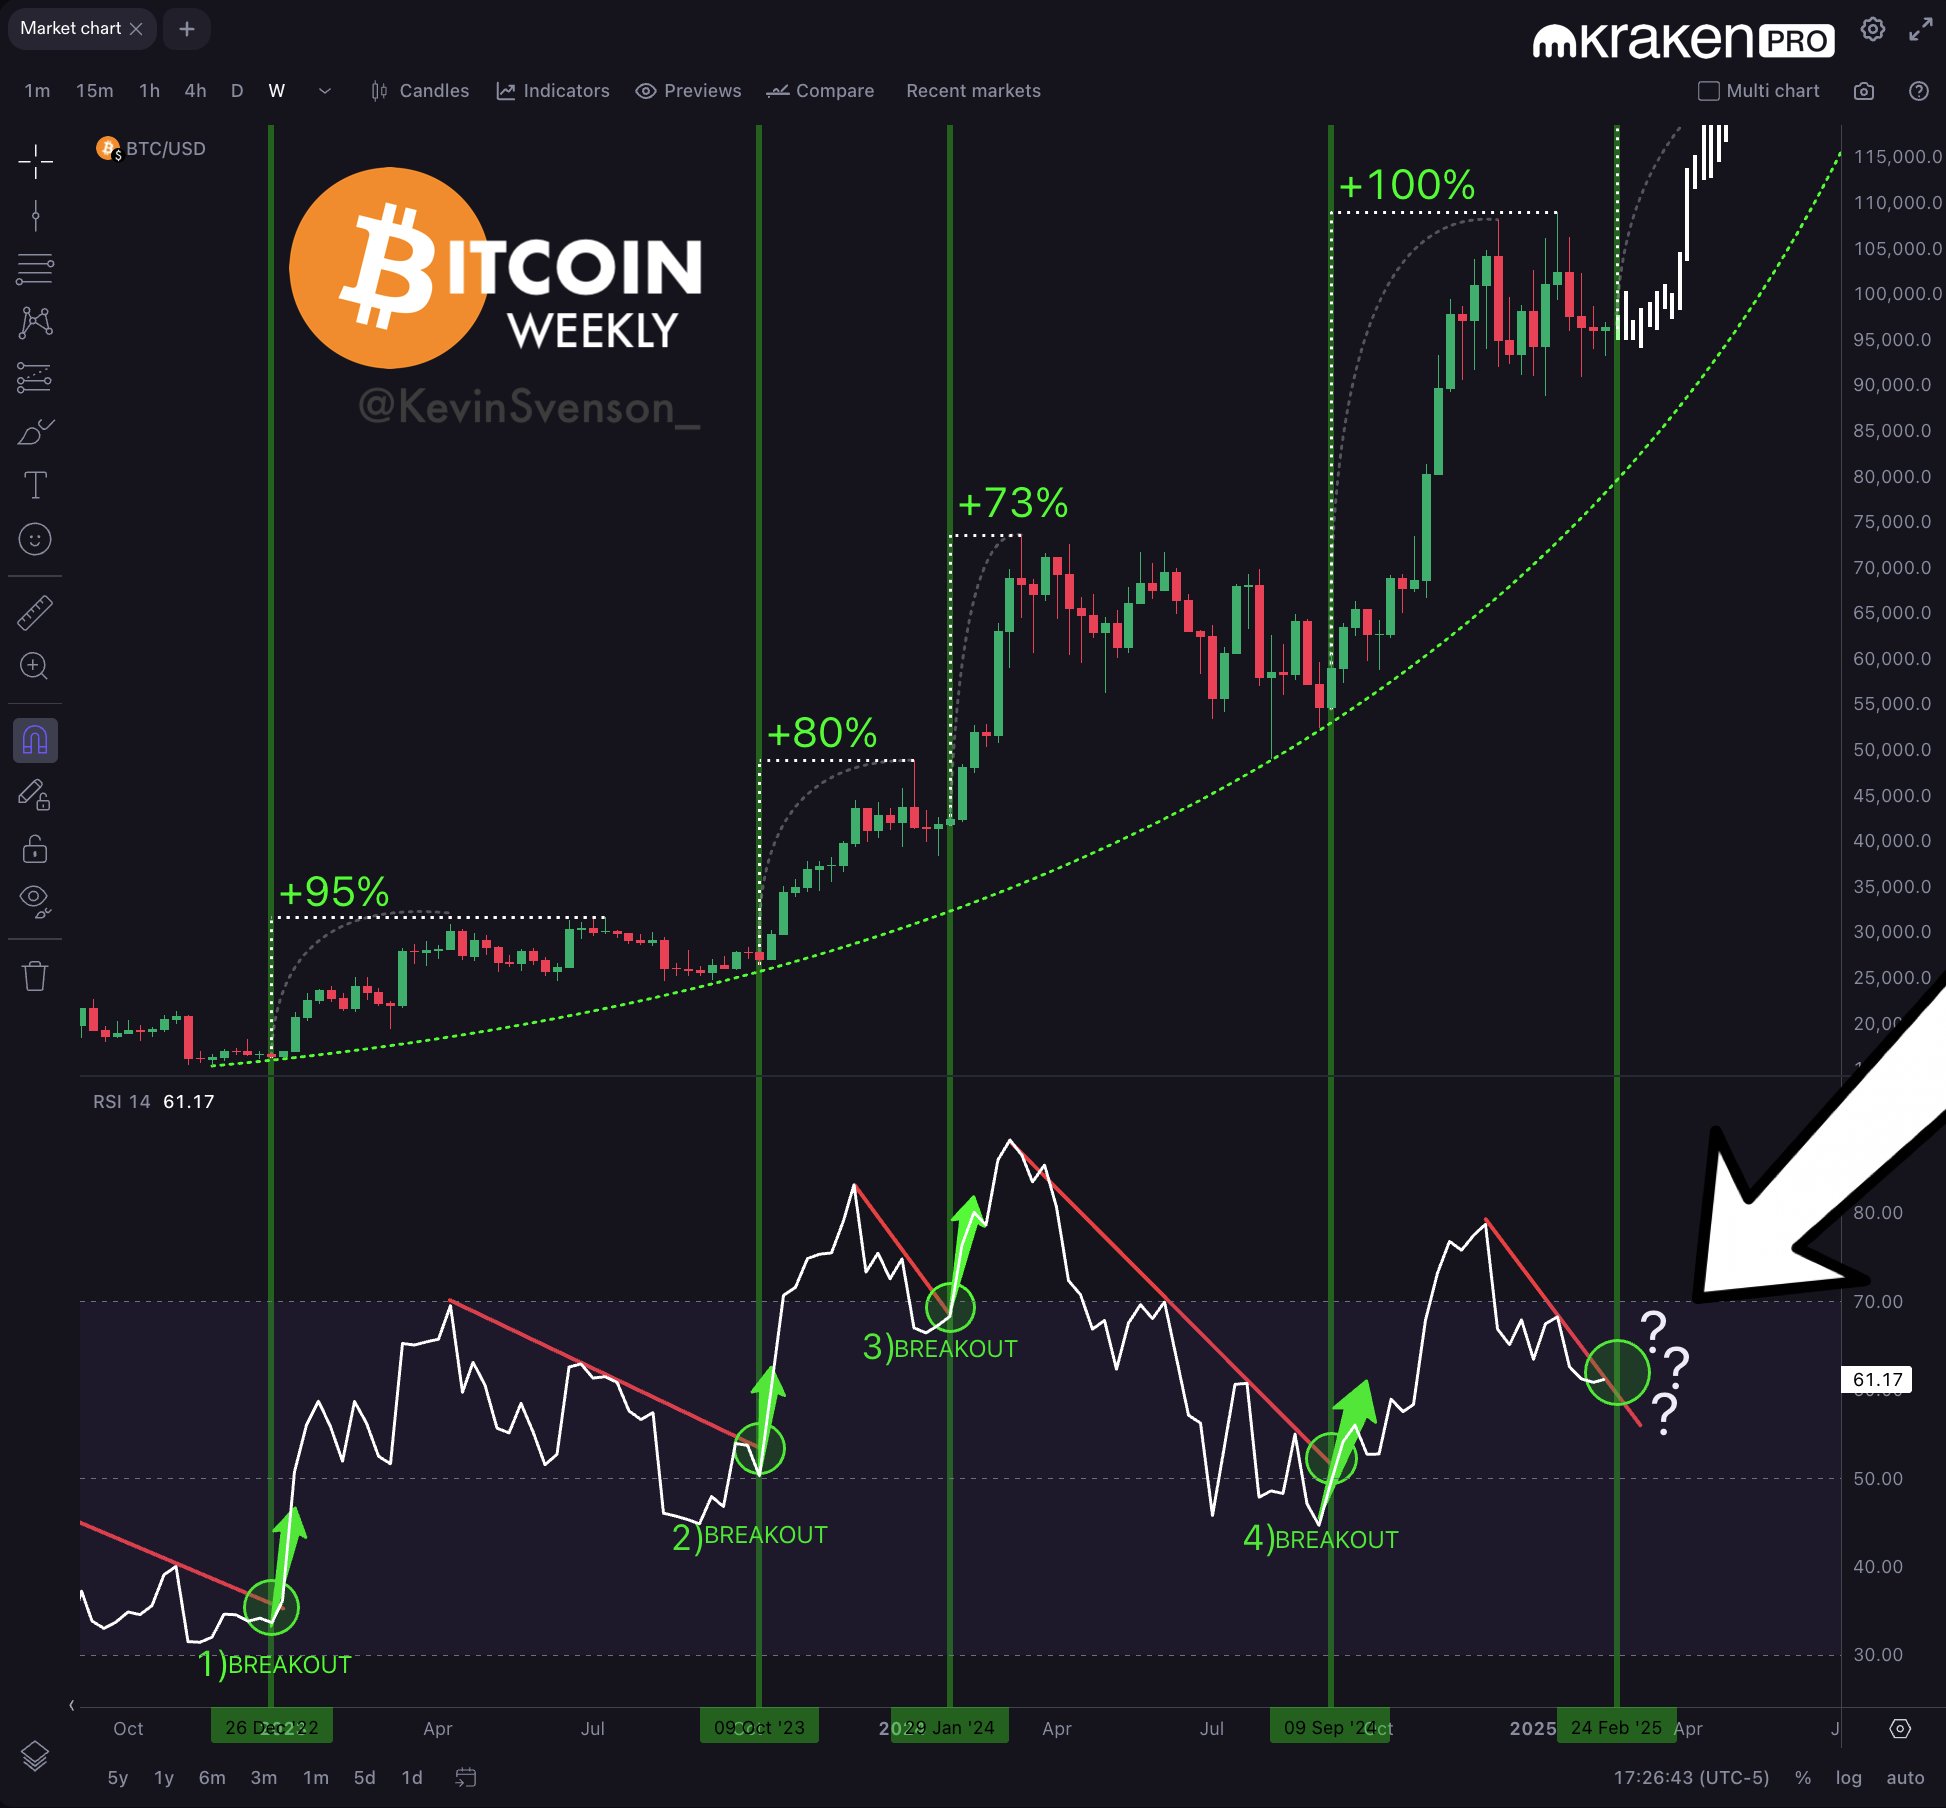
For context, Bitcoin rallied 95% after a December 2022 RSI breakout on the higher timeframe, posting another 80% uptrend with a similar trend in October 2023. Furthermore, the crypto firstborn again reacted bullishly to the resistance breach in January and September last year, surging 73% and 100%, respectively.
Meanwhile, the average upsurge with the last four RSI breakouts accounts for 87% of Bitcoin’s price. Suppose the resistance level breaks and the asset posts its average price rally, Bitcoin would surpass its current all-time high to $181,294.
Price Analysis
Analysis shows that Bitcoin’s RSI is at 61.70, signaling bullish momentum and room for more upside, as it still trends below the overbought territory. Nonetheless, the indicator is not the sole precursor for a Bitcoin price upsurge.
On-chain analysis shows a growing bullish sentiment among market participants, especially on exchanges. Data shows that the bid-ask volume imbalance has flipped bullish at 0.86% as trading activities increasingly tend towards a Bitcoin surge rather than pushing to lower prices.

However, trading volumes have reduced in the past 24 hours, down 23% to $28.83 billion. Other indicators, such as large transaction volumes and concentration, remain neutral, sending mixed signals.
In the meantime, Bitcoin trades at $97,180, up 1.27% in the past 24 hours.
DisClamier: This content is informational and should not be considered financial advice. The views expressed in this article may include the author’s personal opinions and do not reflect The Crypto Basic opinion. Readers are encouraged to do thorough research before making any investment decisions. The Crypto Basic is not responsible for any financial losses.


