

- Both BTC and ETH have a bearish outlook based on technical analysis
- On-chain metrics showed more consistent accumulation for ETH than BTC recently
Bitcoin [BTC] and Ethereum [ETH] were both trading beneath key resistance levels at $60k and $2.6k, respectively, at press time. Their market structures on the 3-day and weekly timeframes were bearish as well.
The rapid sell-off in early August brought panic, but it also presented market participants with the conviction to load up on these top crypto assets. AMBCrypto examined these trends to understand the market sentiment. And, we found that Ethereum had an advantage.
Price action and technical indicators showed seller supremacy
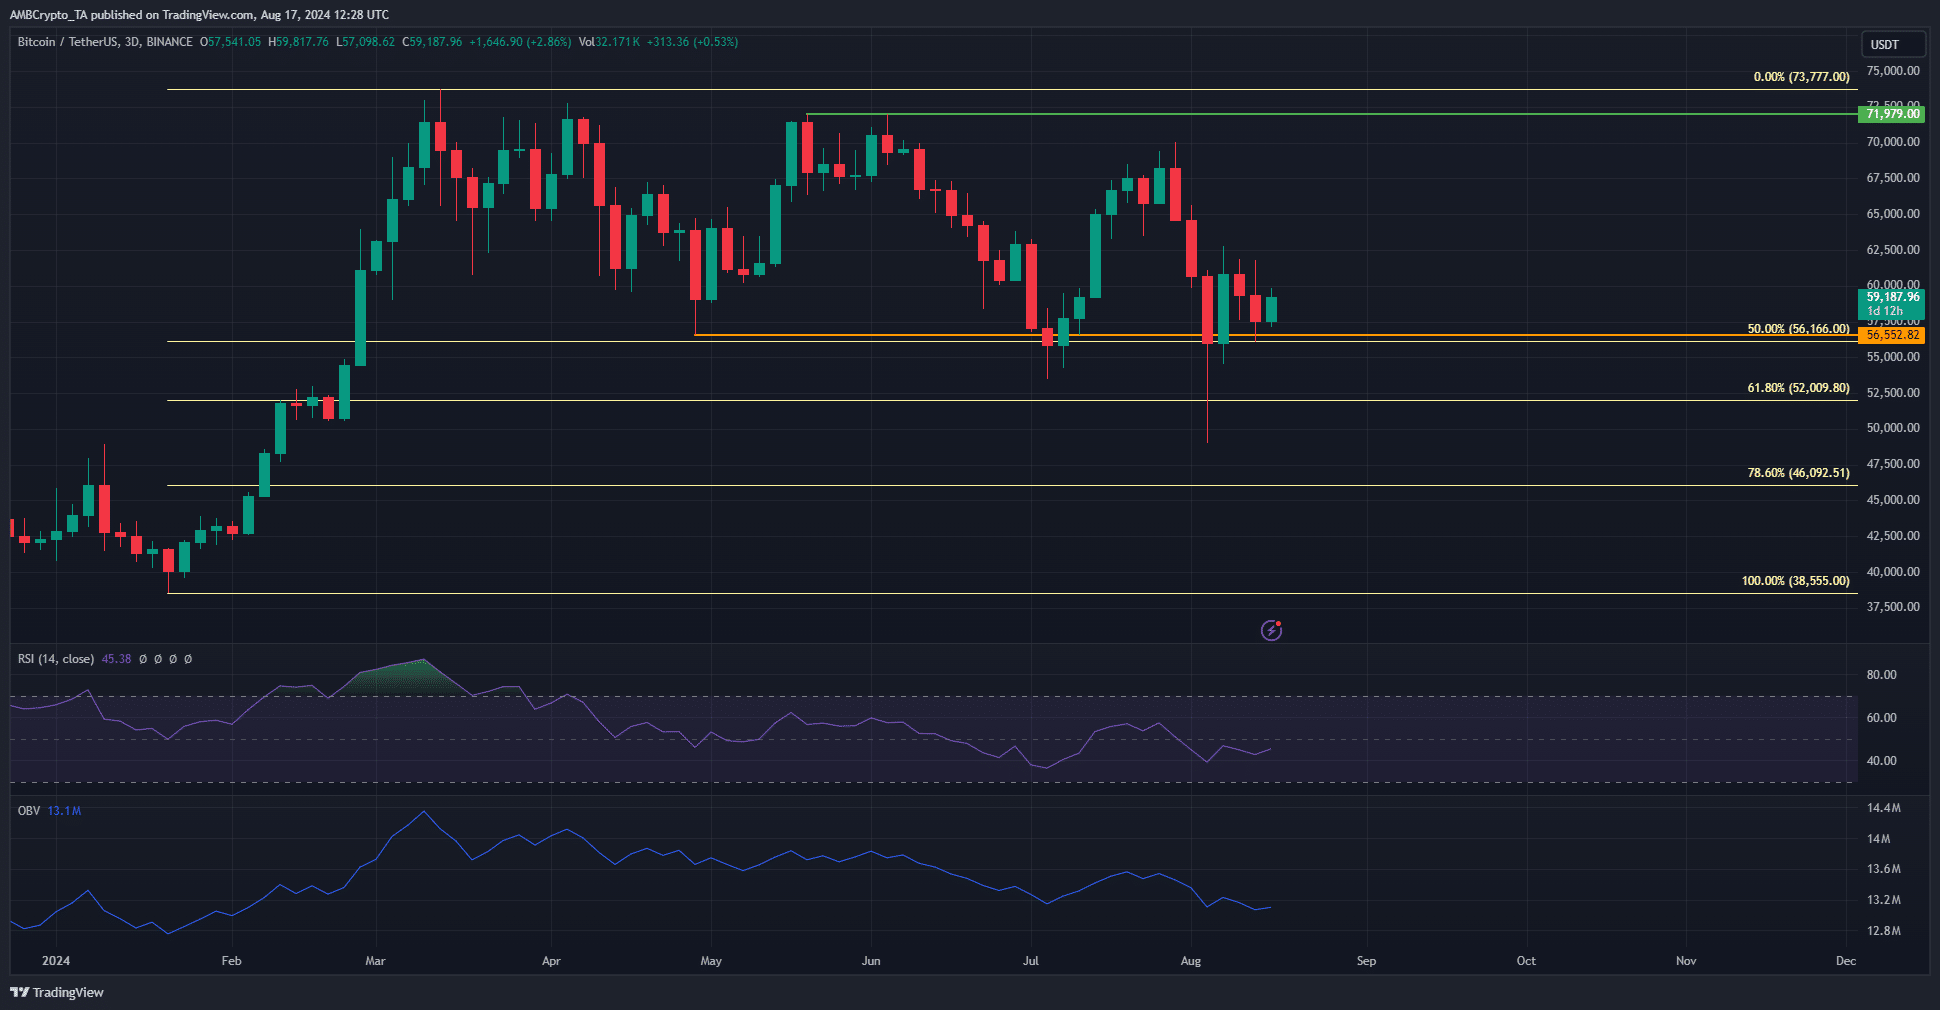
Source: BTC/USDT on TradingView
On the chart, the orange marked the bearish structure break, while the significant lower high at $72k remained undefeated. Combined with the bearish RSI on the D3 chart and the downtrend of the OBV, it is likely that the sellers force BTC below $56.1k again.
The first sign of recovery would be a sustained push beyond $60k. However, at the time of writing, the demand was not present to pull this reversal off.
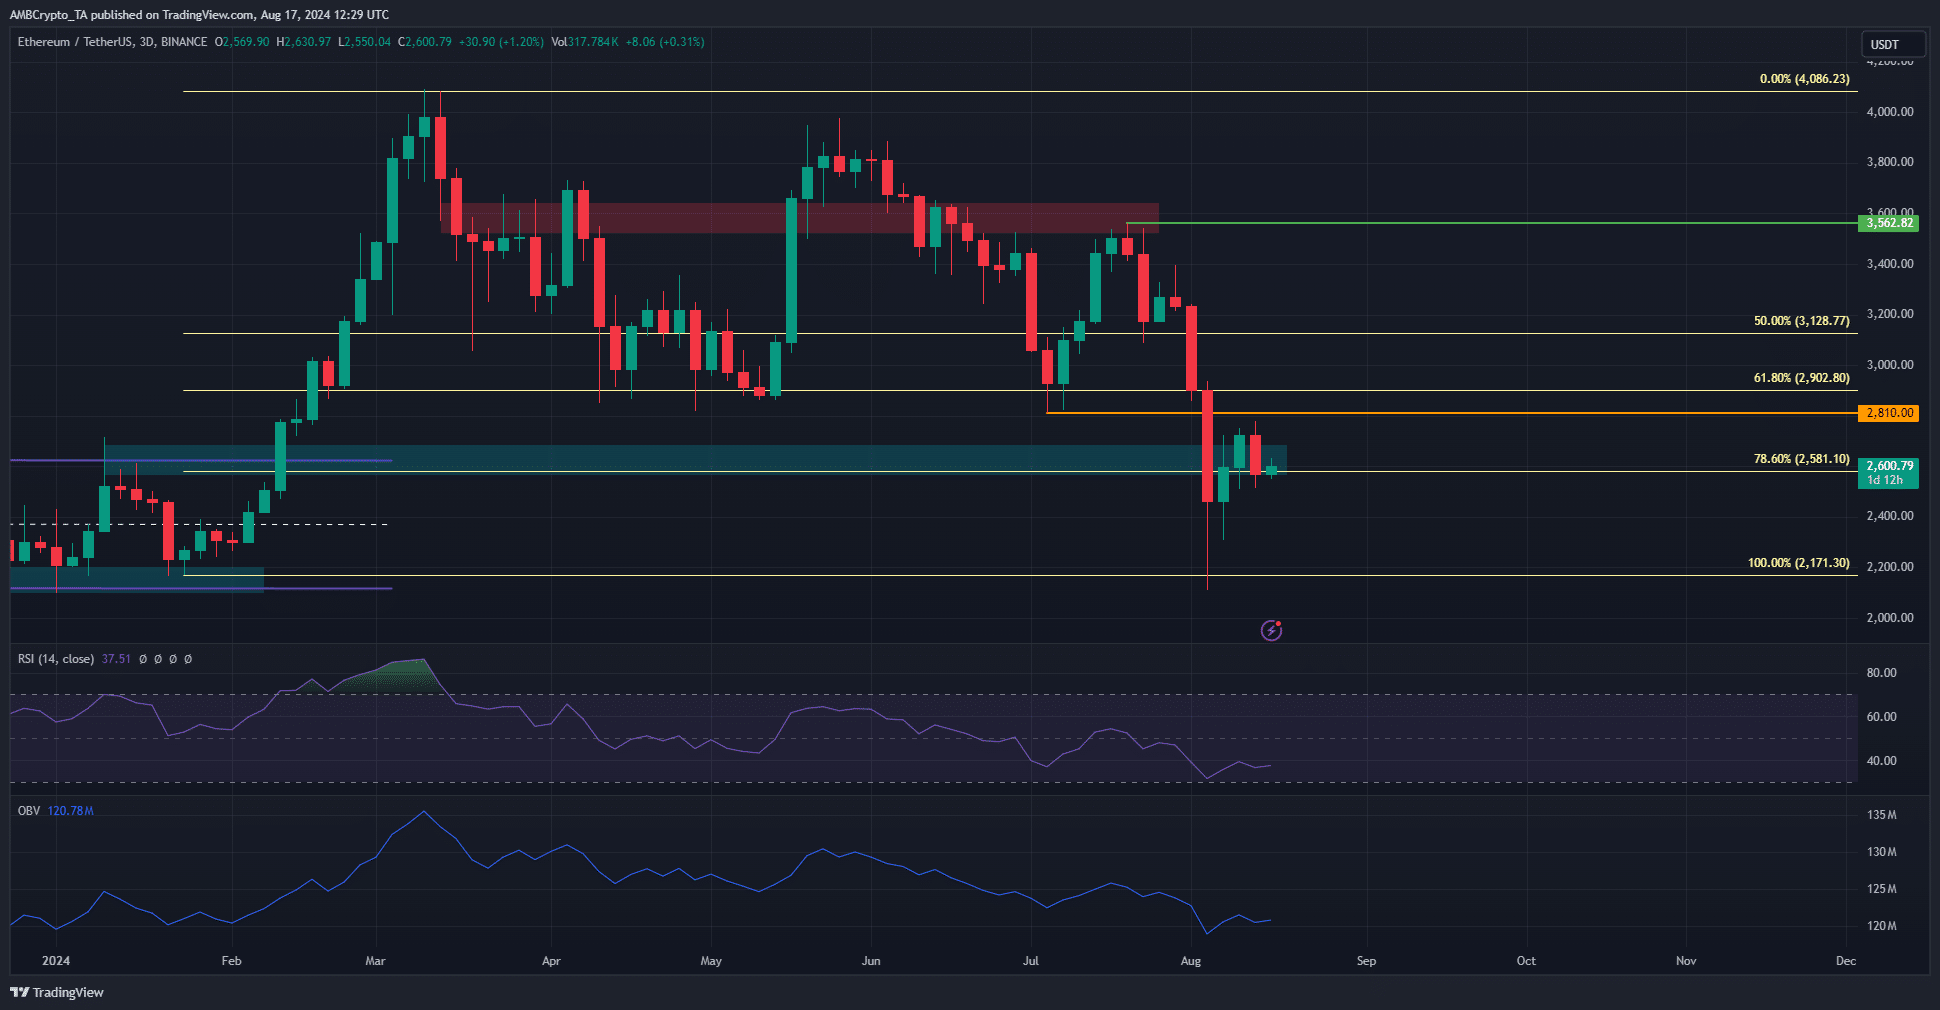
Source: ETH/USDT on TradingView
The technical outlook for ETH is even more bearish. The fair value was around the $2.8k region, with the $2.9k Fibonacci level overhead. This spelt huge trouble for Ethereum bulls.
The RSI and OBV indicated bearish pressure can be anticipated. This could pave the way for a move towards $2.2k.
Netflows revealed accumulation trends more consistent for Ethereum
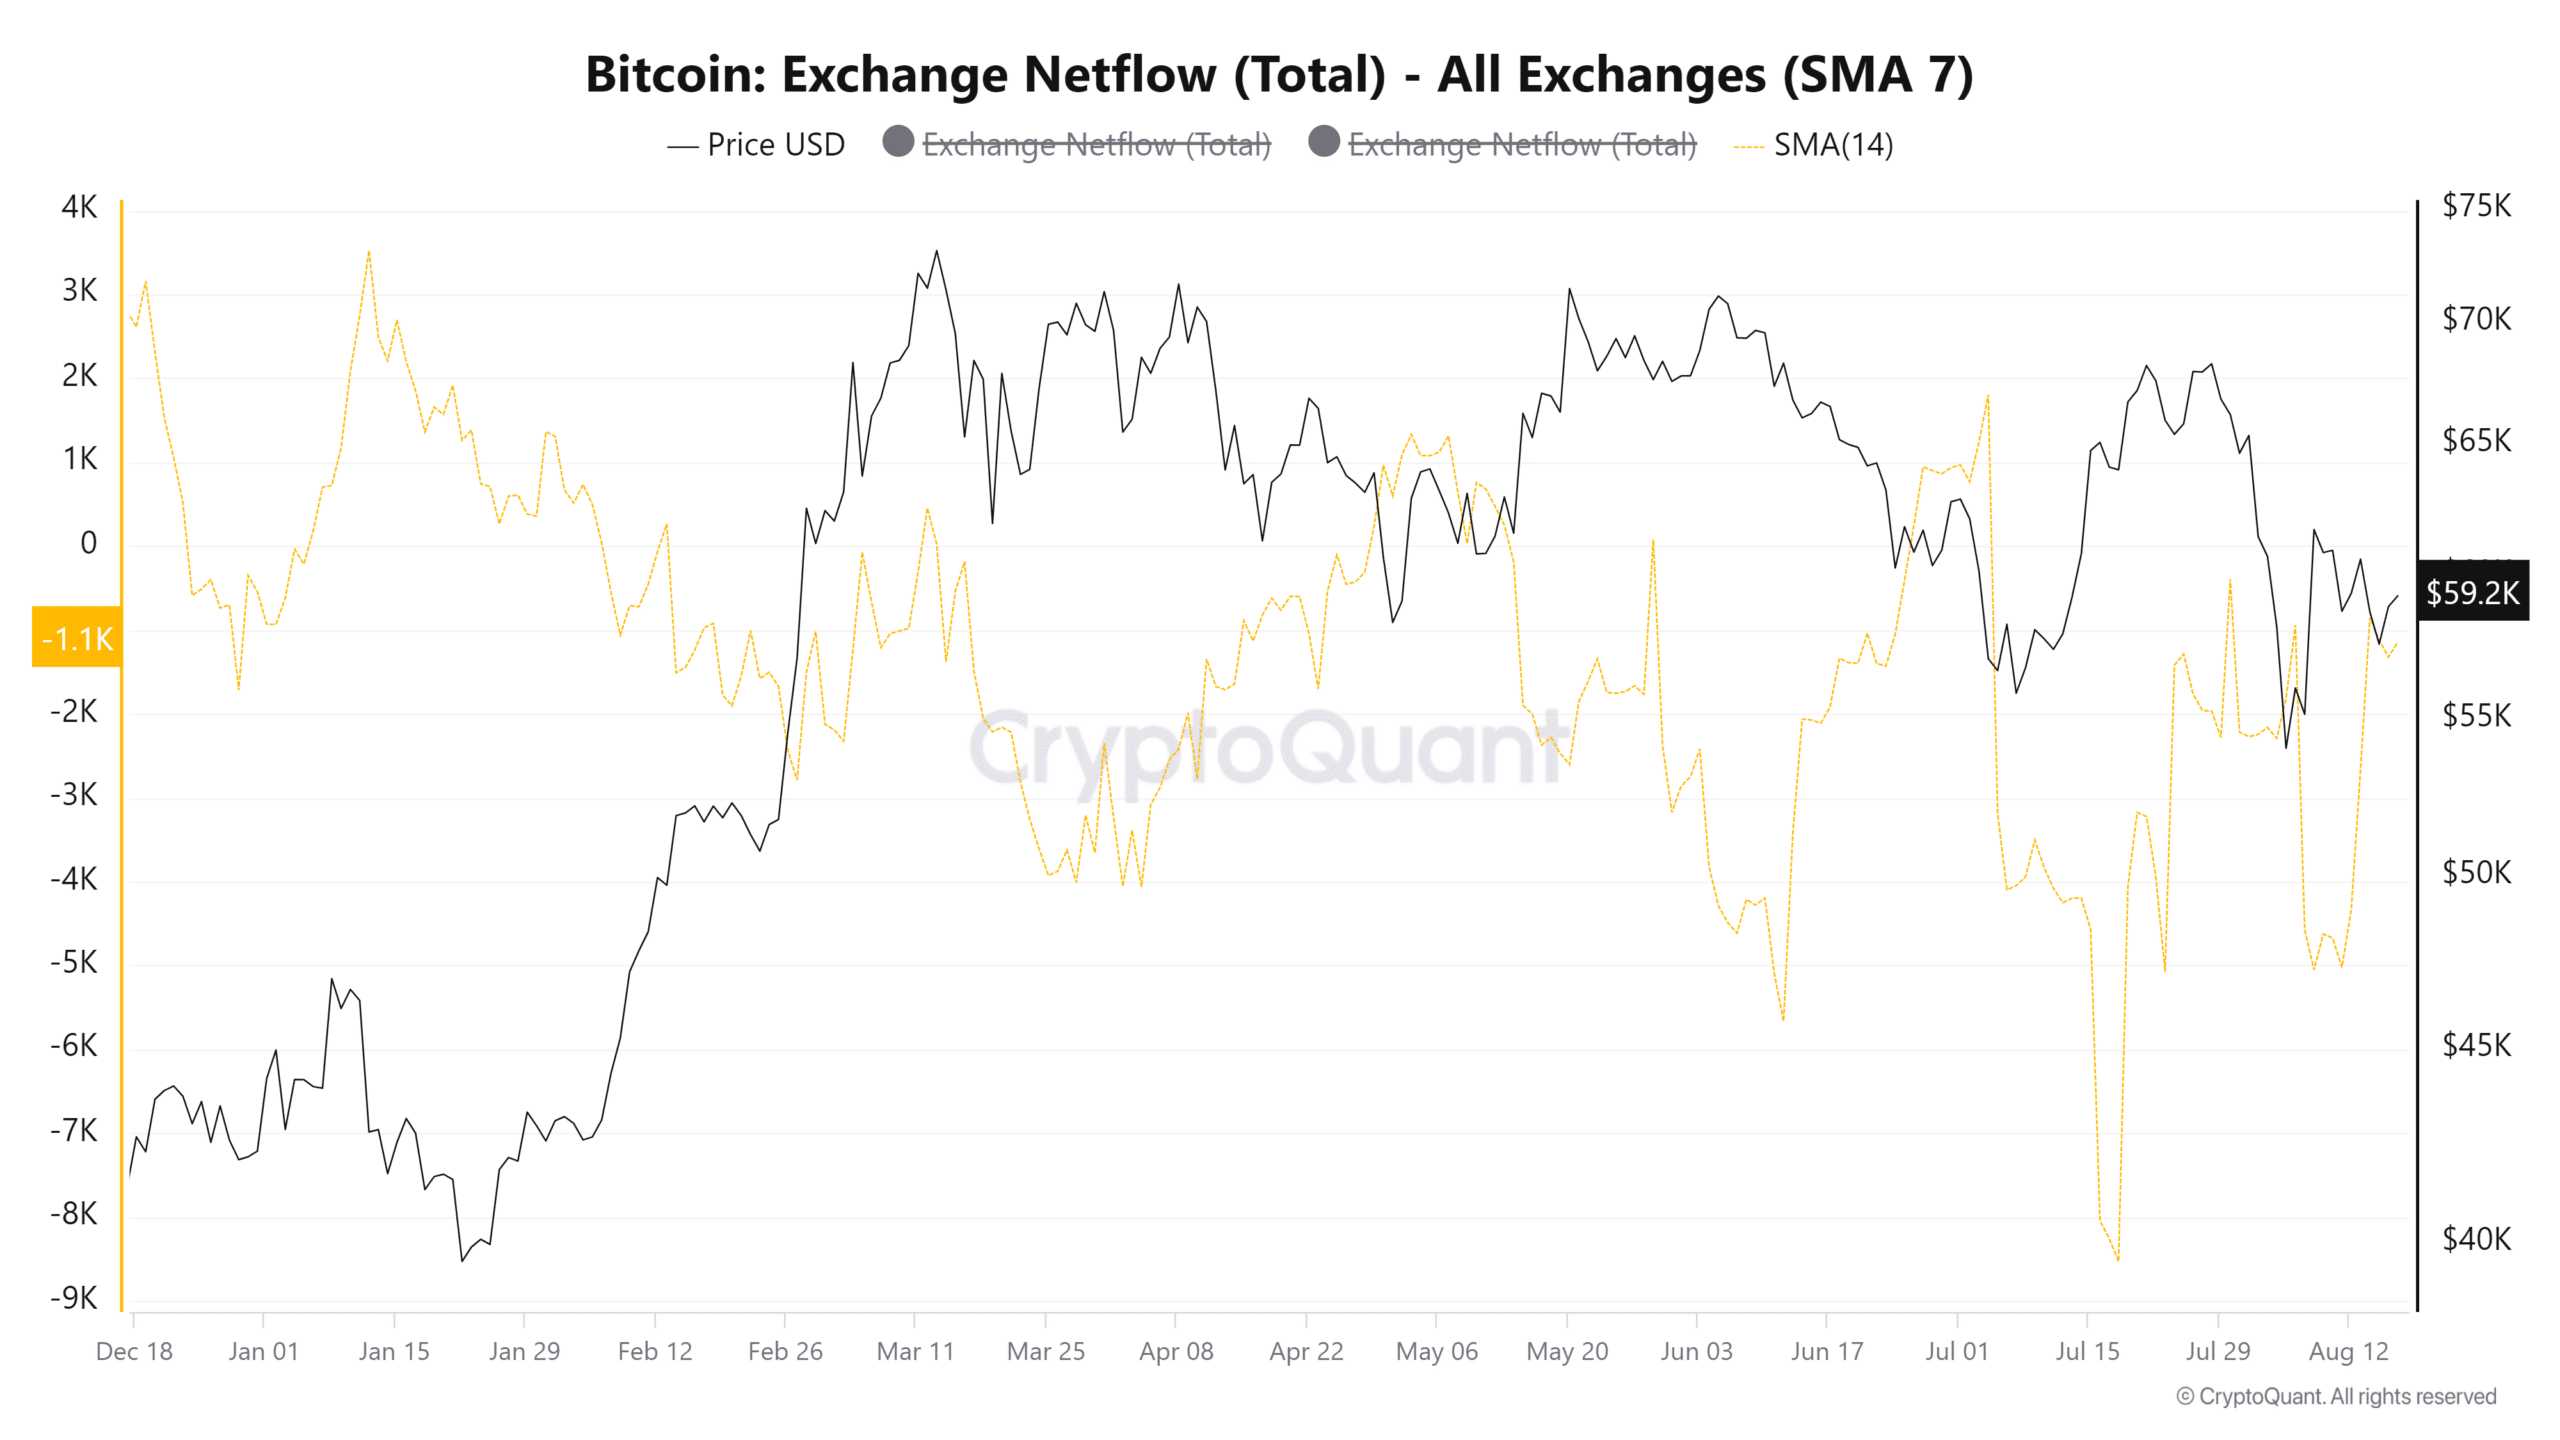
Source: CryptoQuant
The hike in stablecoin reserves covered in an earlier report highlighted the climbing buying power in the crypto market. Just after the massive price drop on 5 August, the BTC netflows were negative.
This showed coins leaving exchanges – A sign of accumulation.
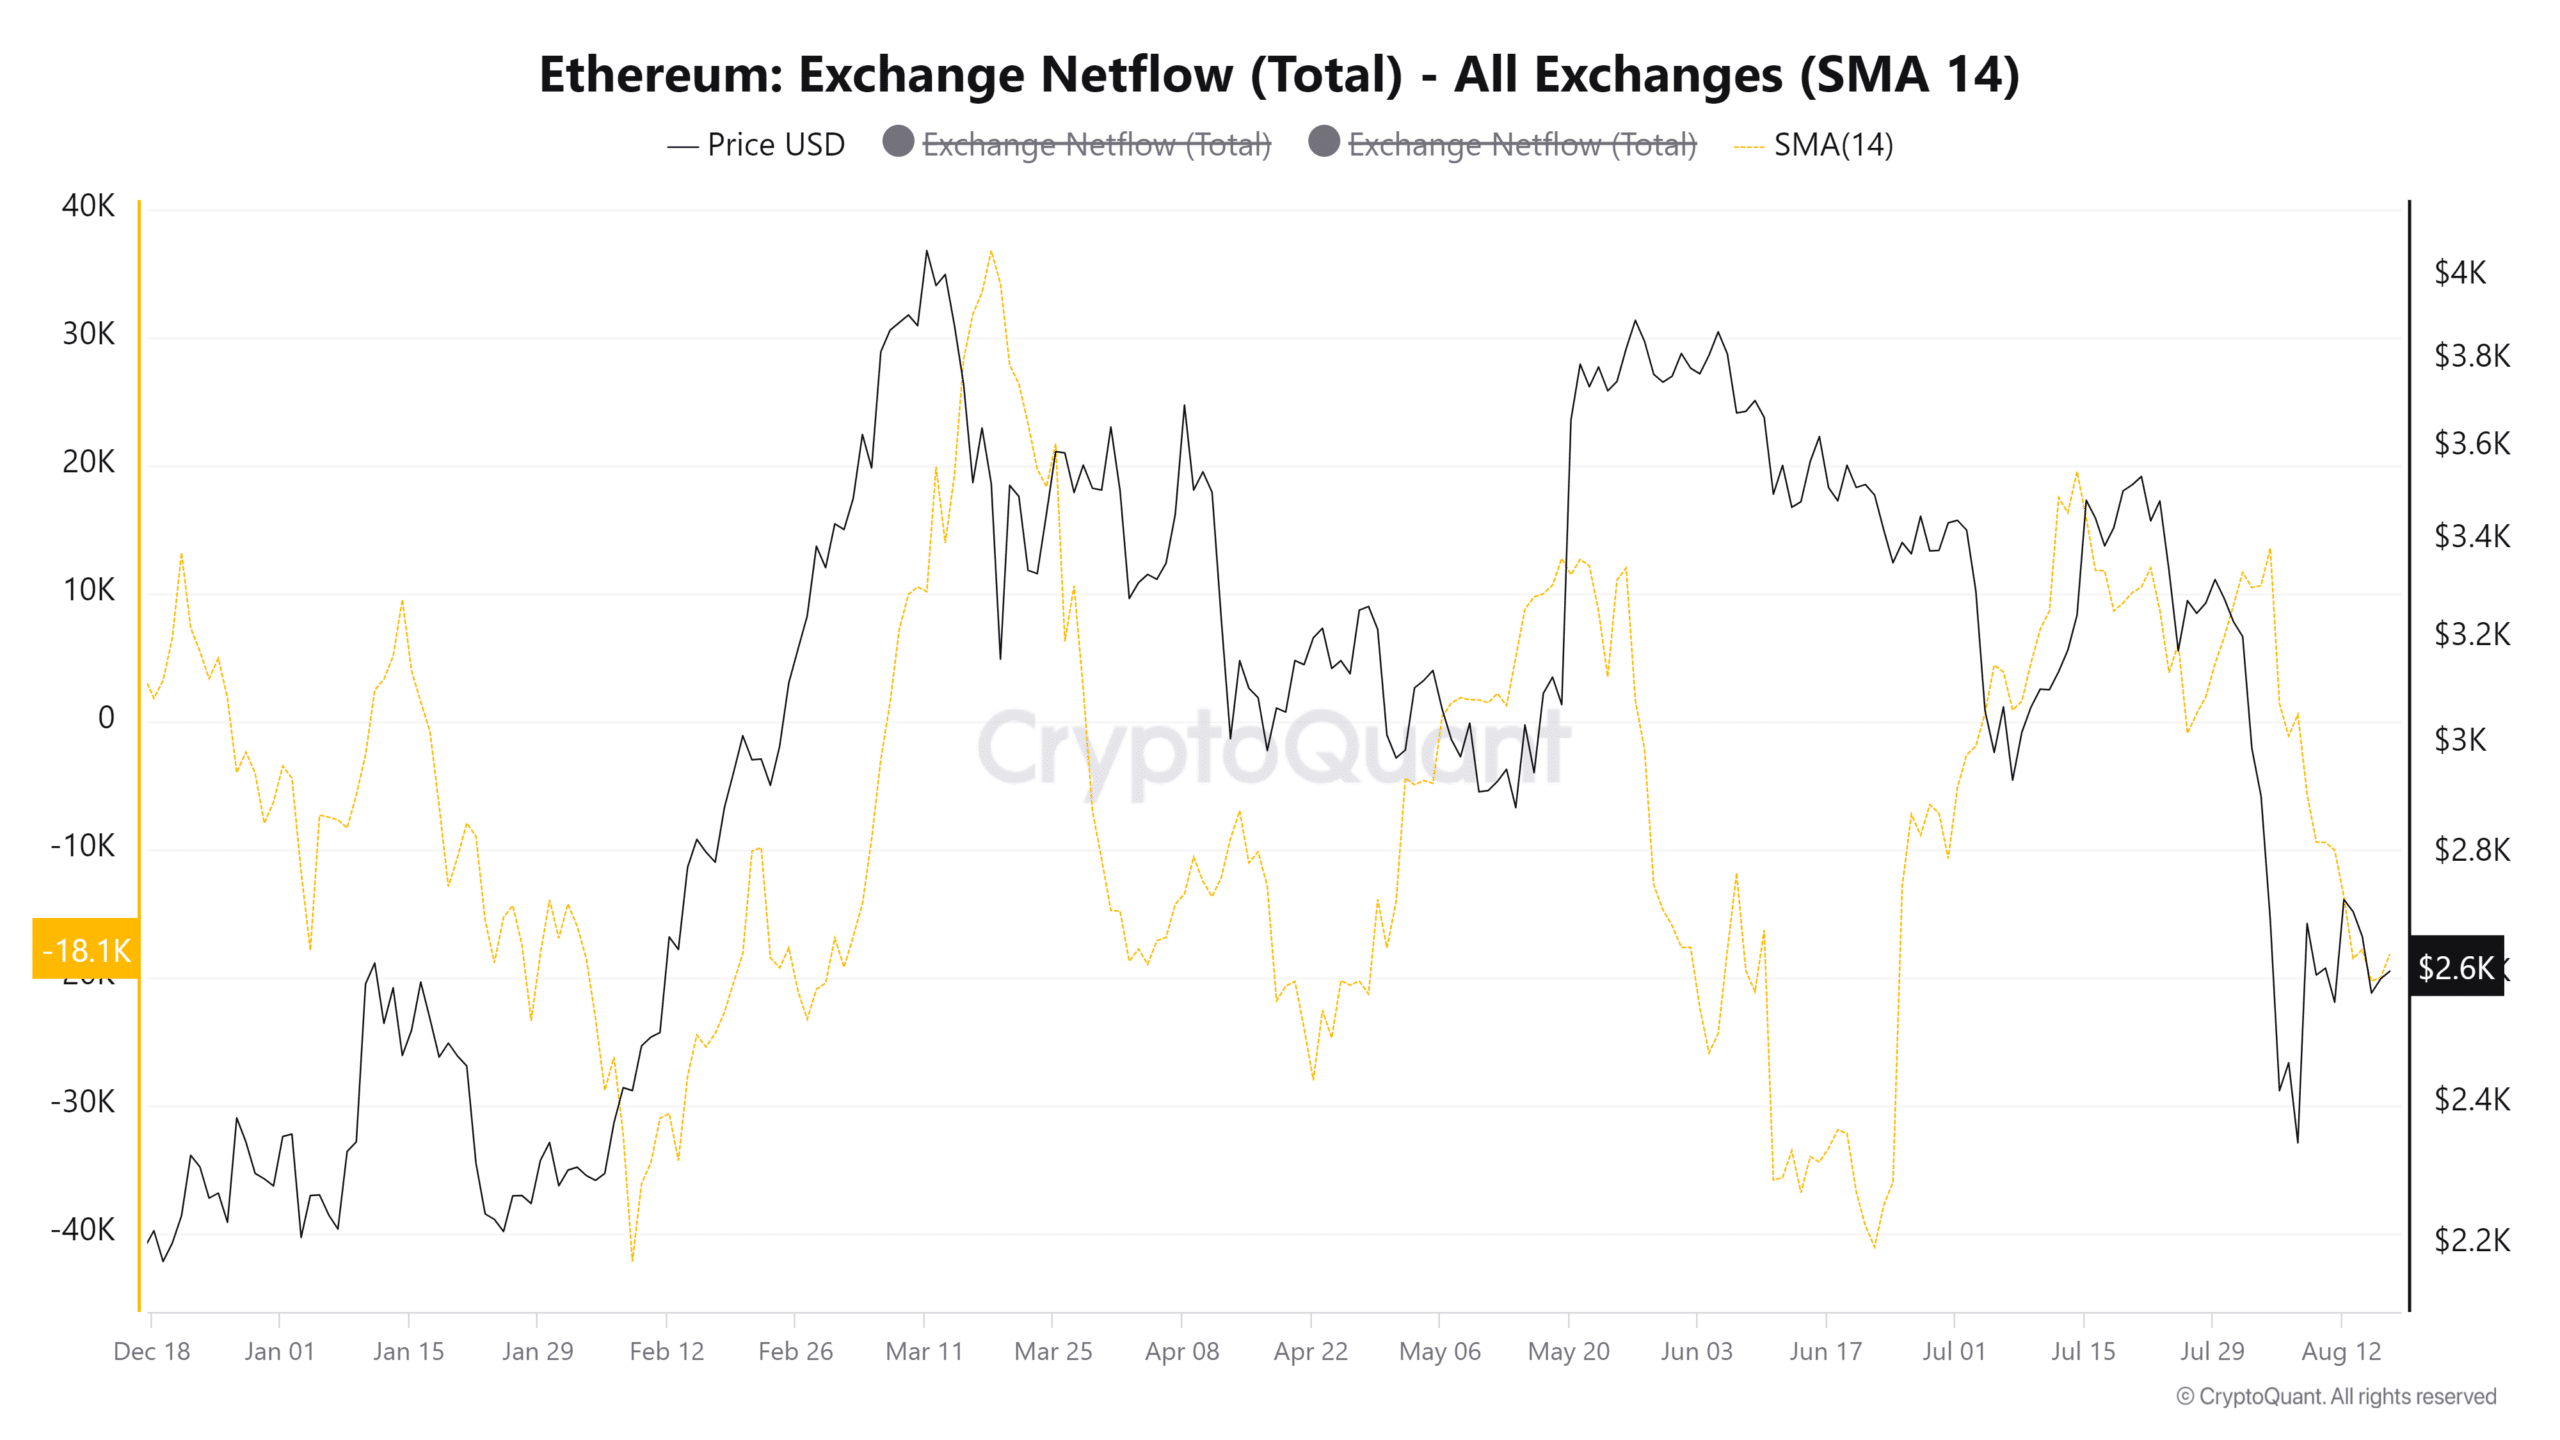
Source: CryptoQuant
Ethereum has also recorded accumulation since late July. Its netflow metric’s downtrend was steadier than BTC’s.
This is a sign that Ethereum’s accumulation proceeded apace while BTC holders wavered more. Alas, it is not a definitive guarantee that Ethereum has been more bullish.
Source: CryptoQuant
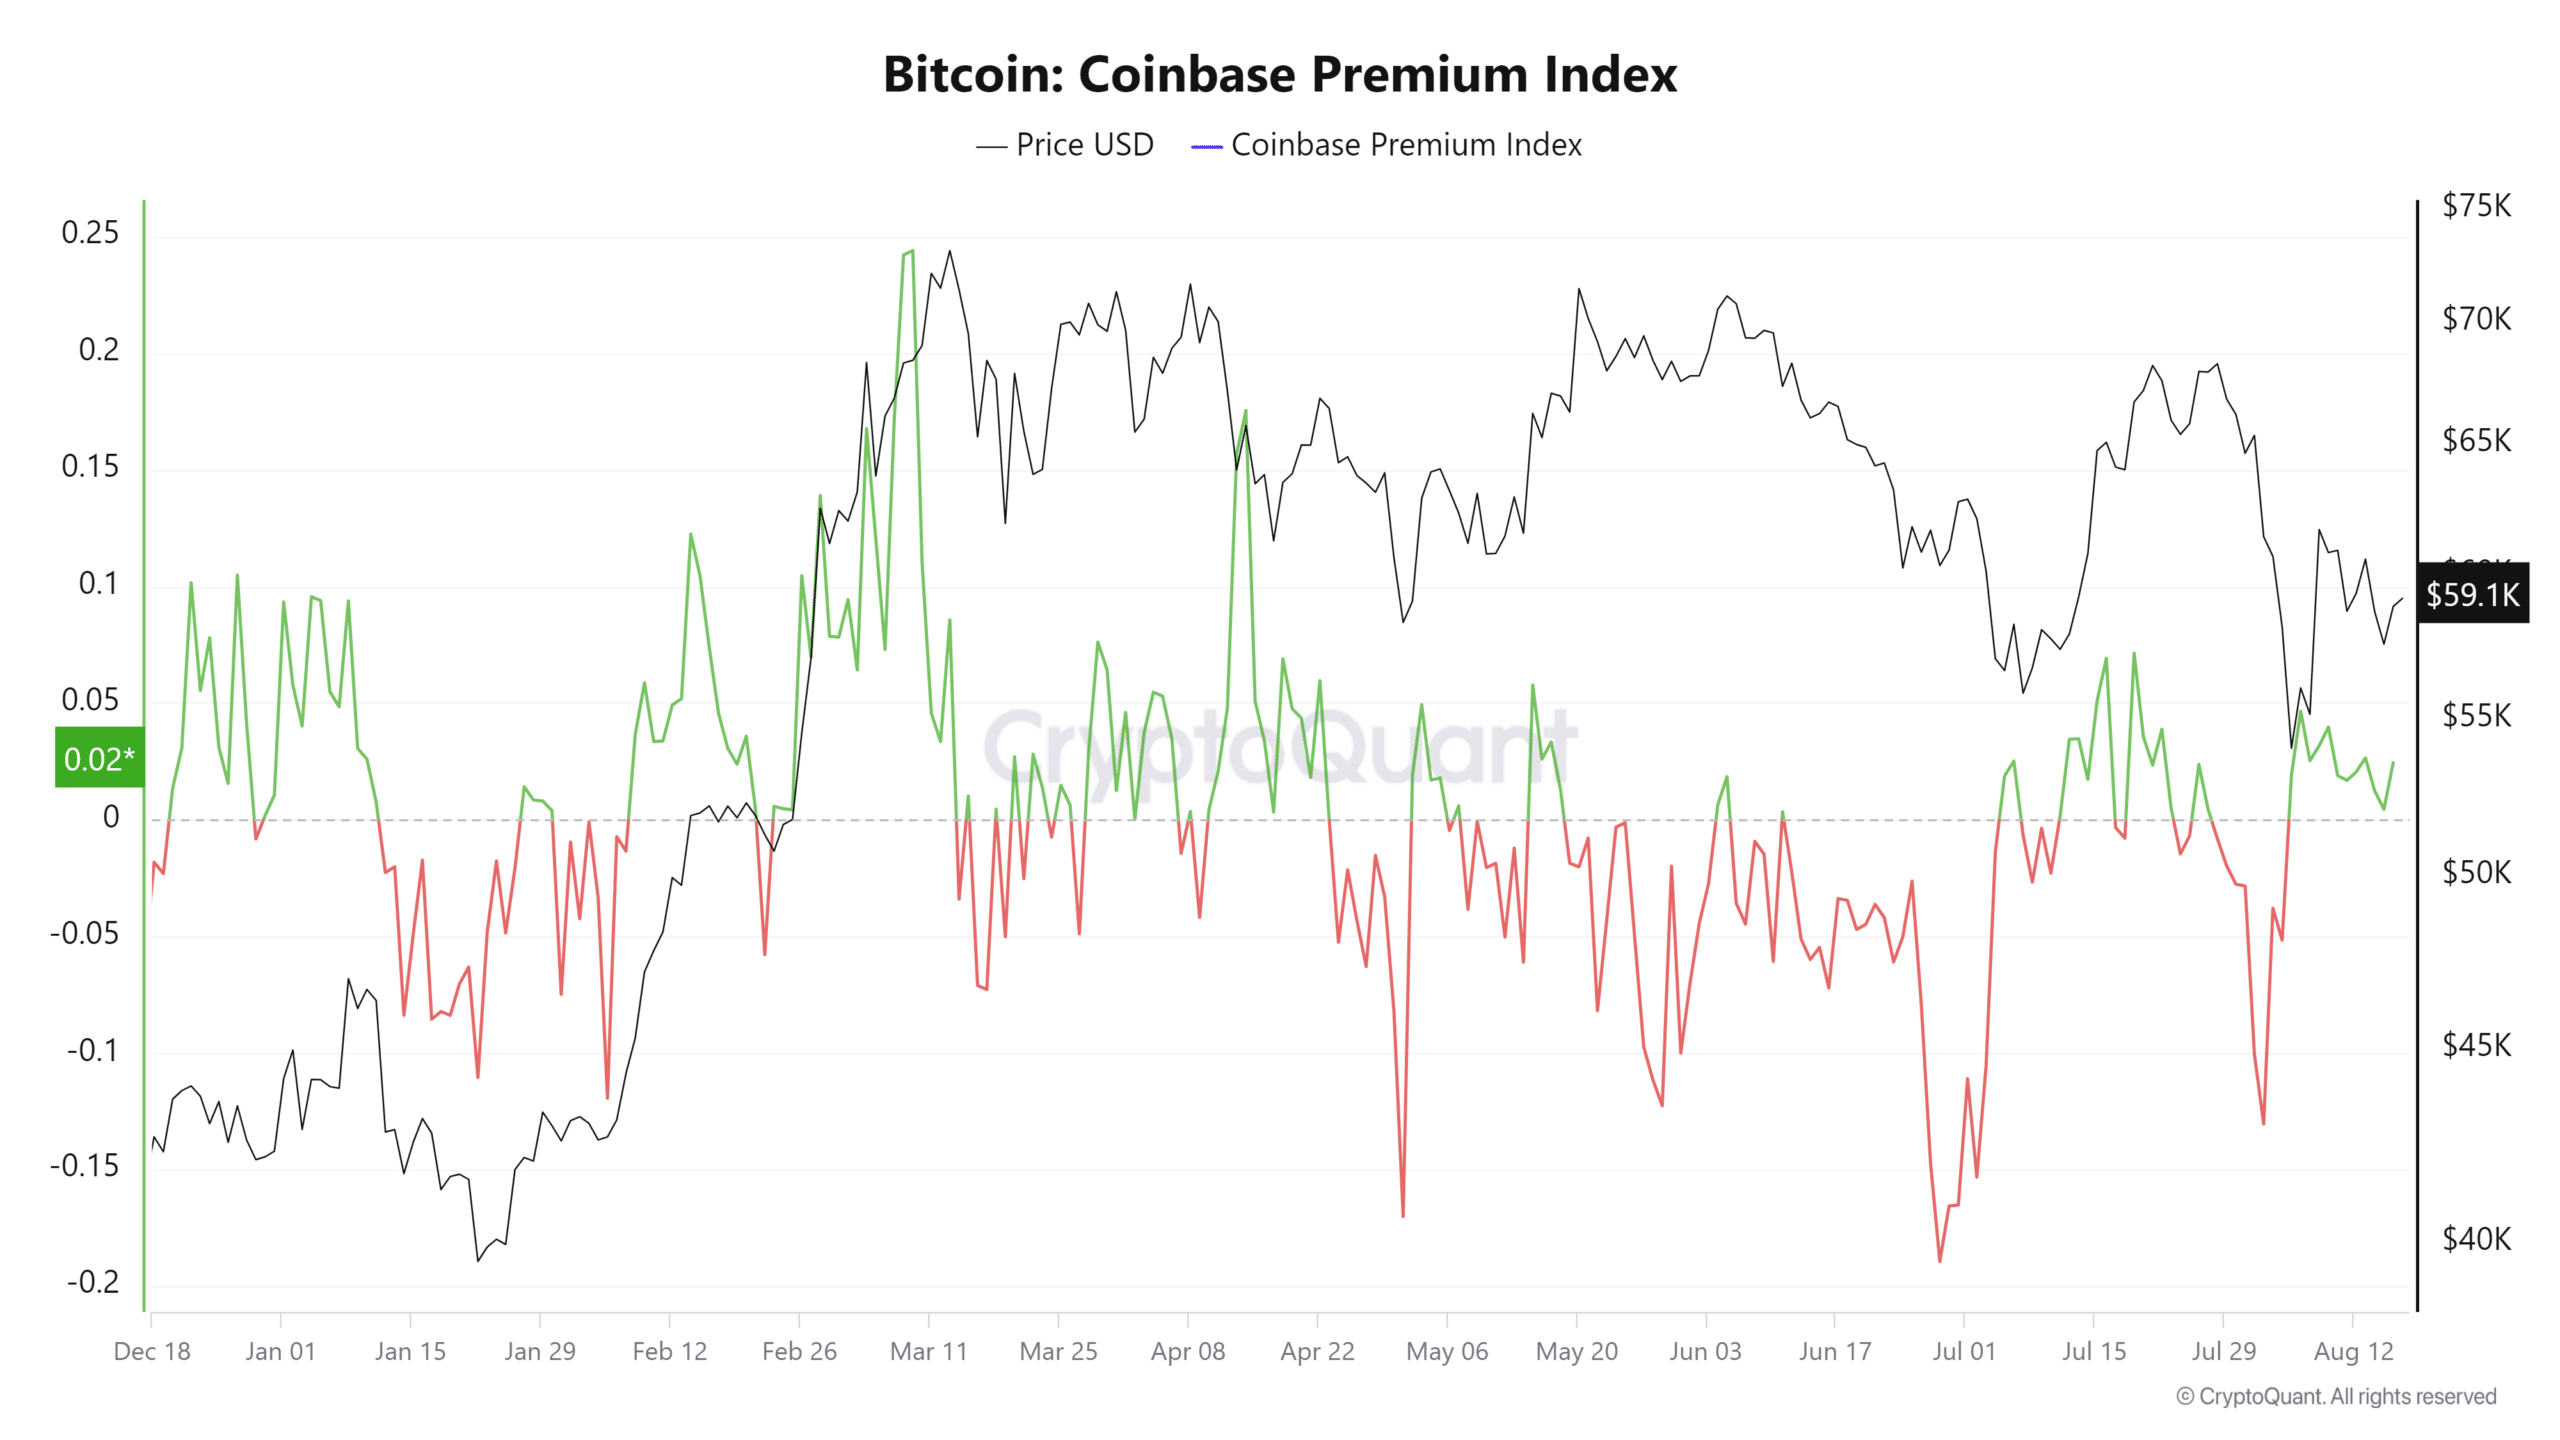
Finally, the Coinbase Premium for Bitcoin and Ethereum were both positive. This underlined greater demand from U.S.-based investors.
Even so, the premium has fallen for Bitcoin over the past two weeks.
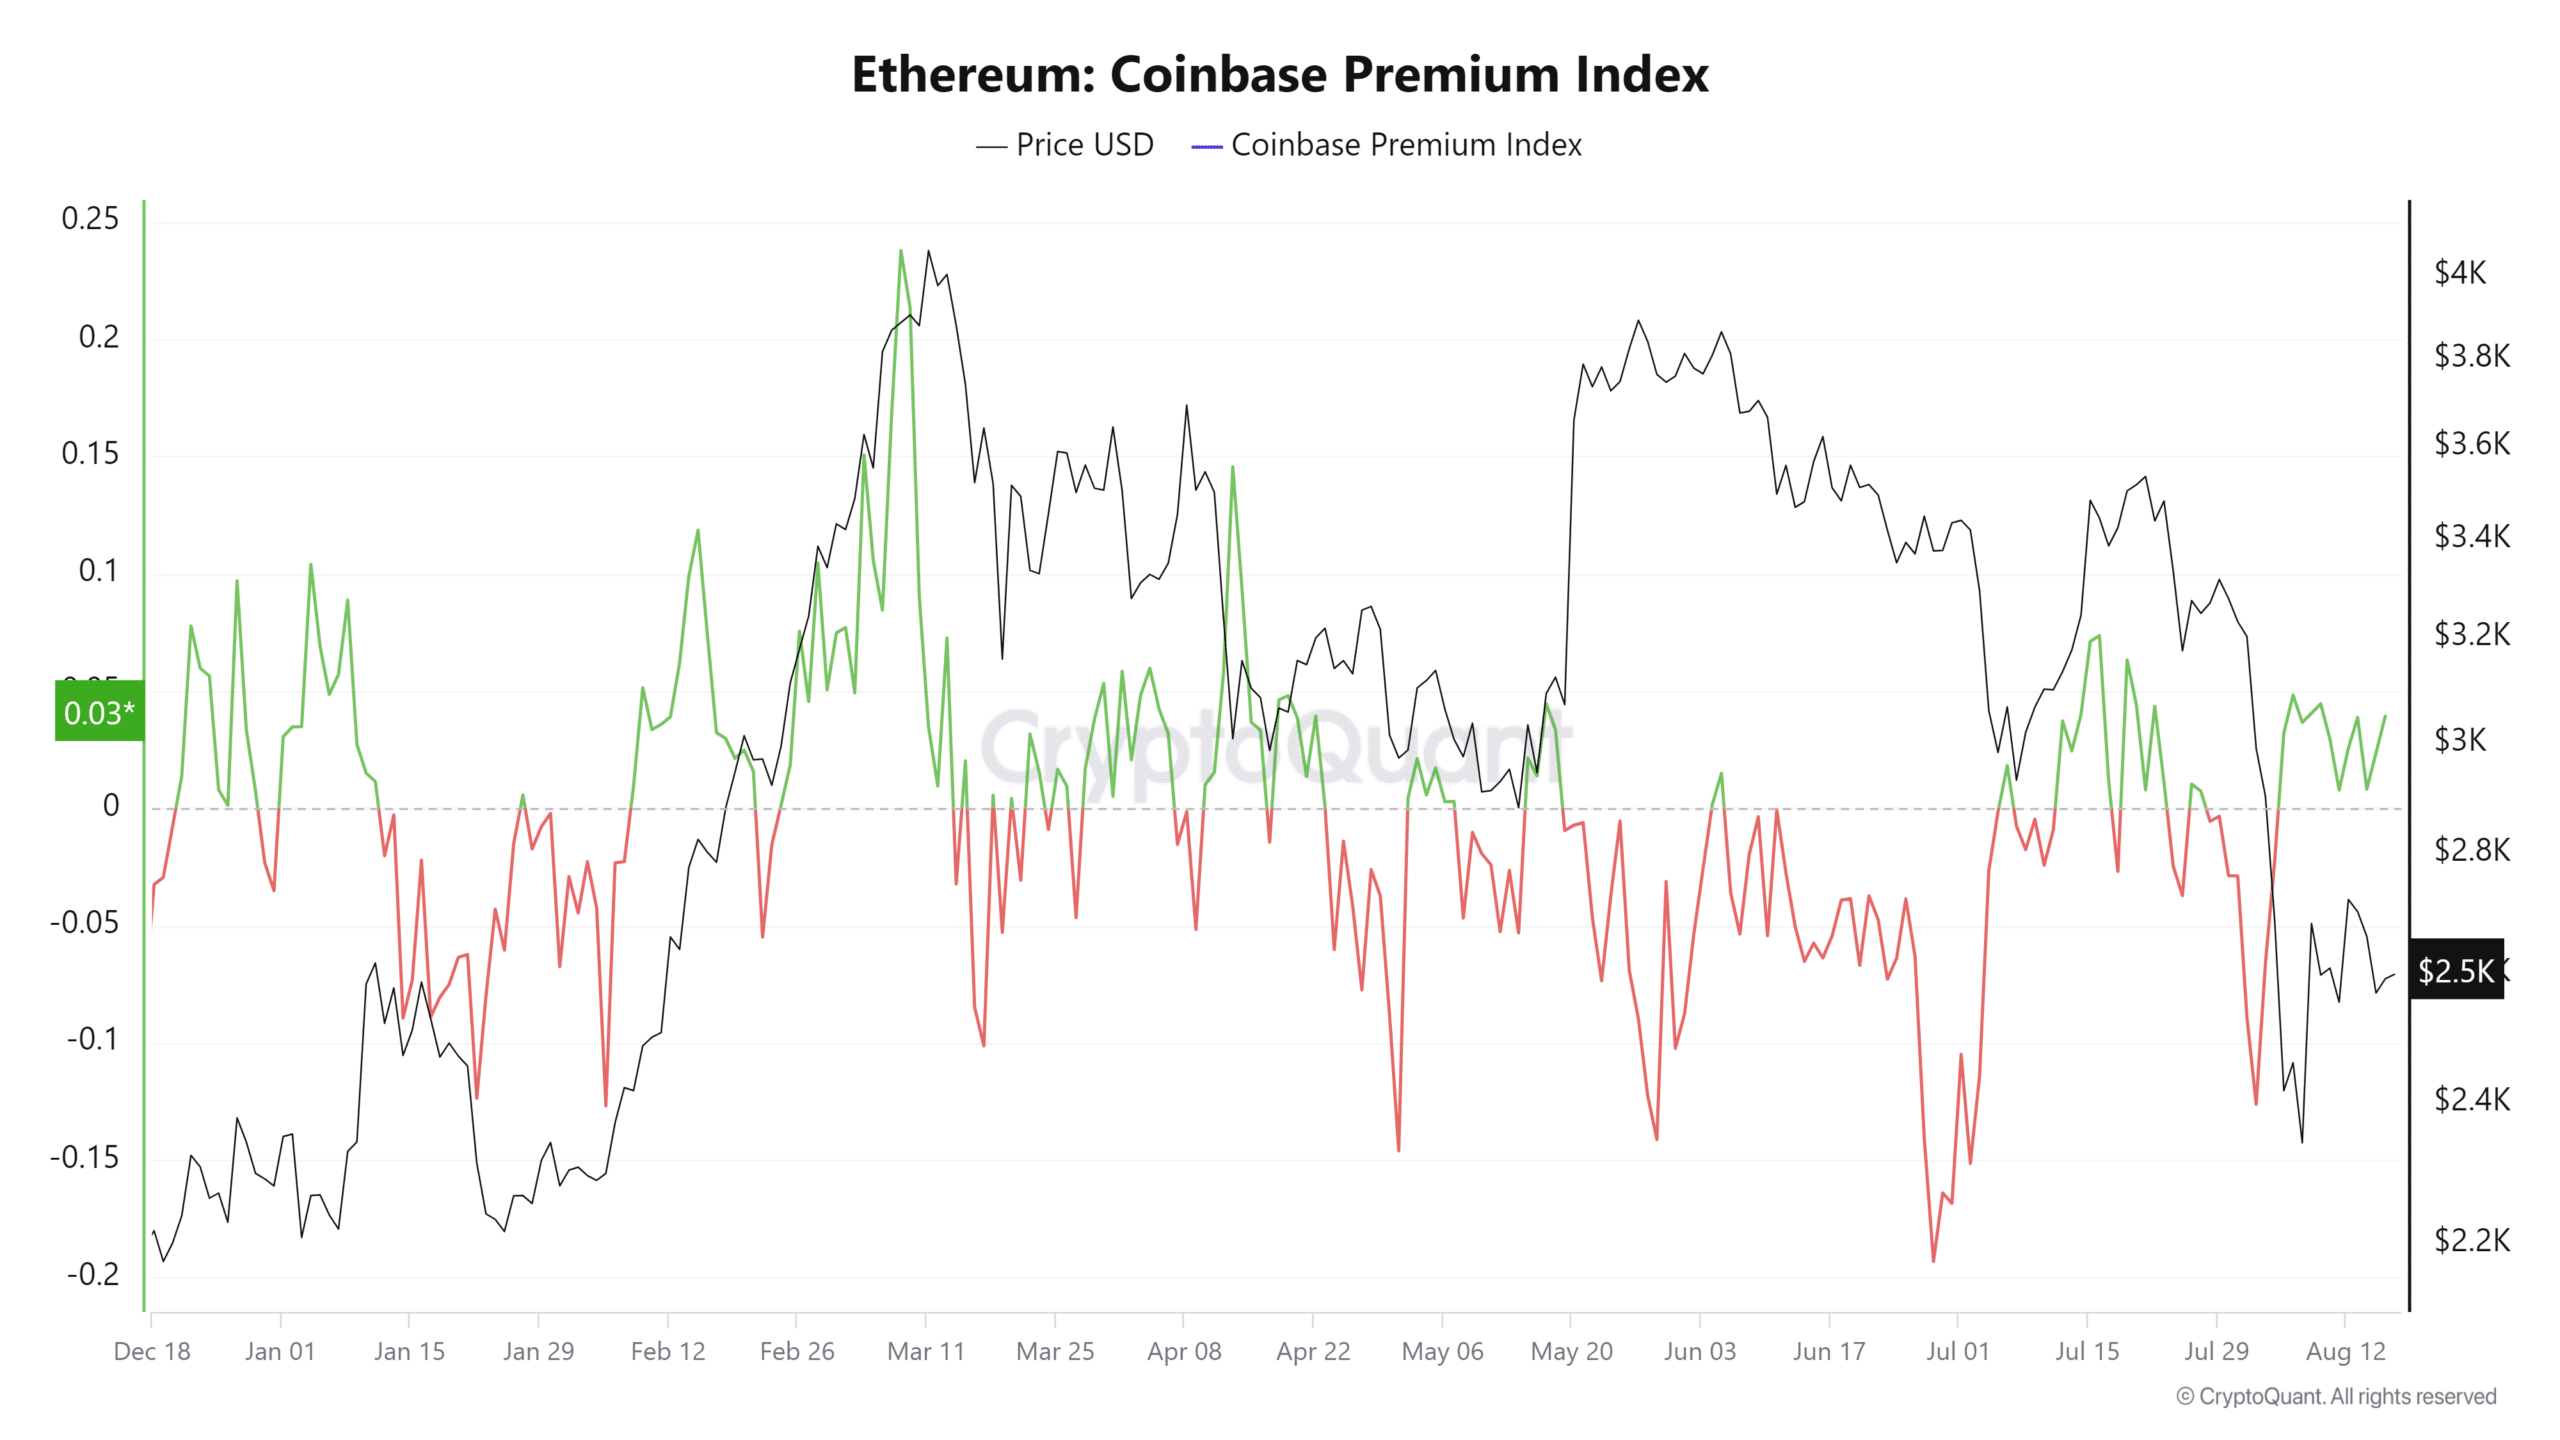
Source: CryptoQuant
Meanwhile, the Ethereum Coinbase Premium was slightly more positive, another sign that demand for ETH has been higher over the past ten days than for BTC.
Read Bitcoin’s [BTC] Price Prediction 2024-25
Overall, the metrics showed Ethereum has an advantage over Bitcoin. The price action advantage was BTC’s, though both assets were bearish on the selected timeframes.
A move past the key resistances at $60k and $2.6k could inspire confidence in the crypto markets.
