

- BTC’s NVT ratio indicated that it was undervalued on the charts
- A few metrics were bearish, hinting at a drop towards $57k
Bitcoin [BTC] investors, at press time, were having a good time as the king of cryptos’ price action once again turned bullish. The latest BTC price uptick also pushed a key indicator into the bull zone. Hence, it’s worth taking a closer look at the crypto’s current state to see how long bulls can sustain this new uptrend.
Bitcoin turns bullish again
Bitcoin crossed the $61k-level on 23 August and since then, sentiment around the coin has been bullish. In fact, the crypto was fast approaching $65k. According to CoinMarketCap, for instance, its price has appreciated by more than 5% in the last 24 hours.
At the time of writing, BTC was trading at $64,276.61 with a market capitalization of over $1.26 trillion. Thanks to this price hike, nearly 86% of BTC investors were in profit.

Source: IntoTheBlock
That’s not all though.
Ali, a popular crypto analyst, recently shared a tweet revealing a bullish development. According to the same, since early August, the BTC bull-bear market indicator has been oscillating between bearish and bullish. Now, it has switched back to bullish again.
This means that BTC’s latest upswing might continue further.

Source: X
BTC’s upcoming targets
Since the aforementioned indicator turned bullish, AMBCrypto checked other datasets to find out how likely it is for the king coin to remain bullish.
Our analysis of Glassnode’s data revealed that BTC’s NVT ratio registered a sharp decline. A drop in this metric means that an asset is undervalued, indicating a price hike on the horizon.
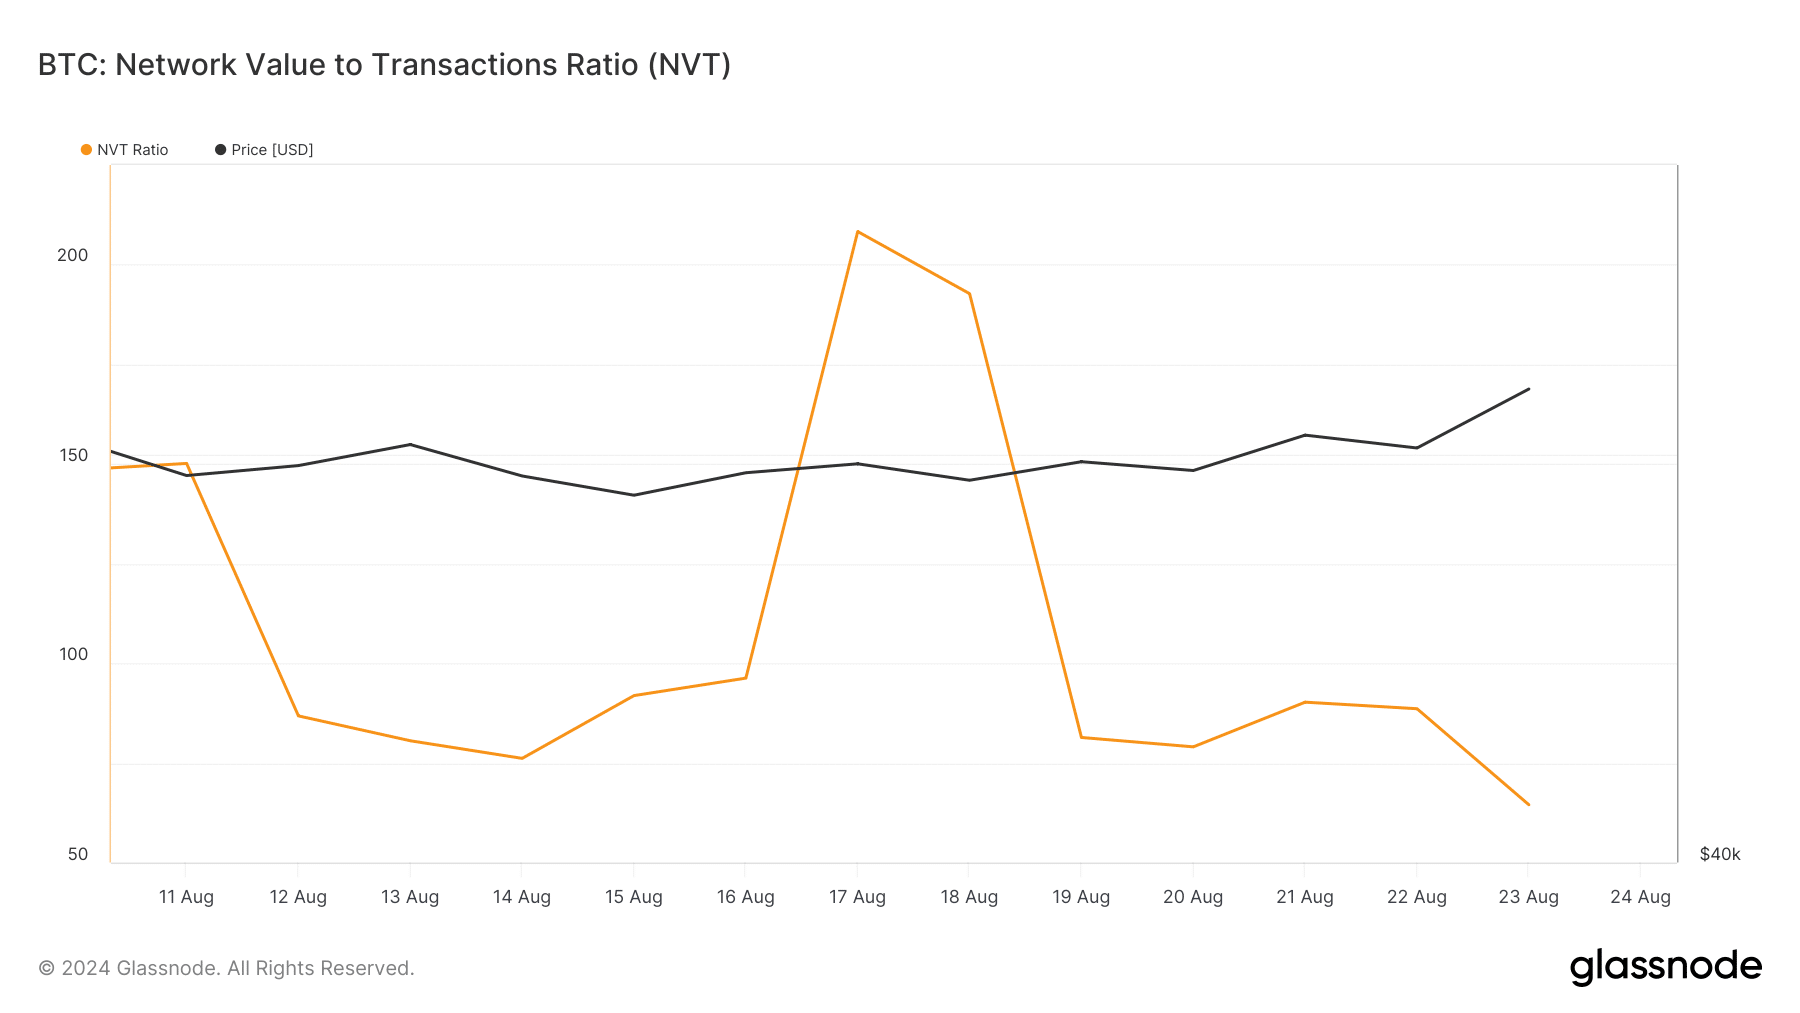
Source: Glassnode
Additionally, as per CryptoQuant’s data, BTC’s net deposit on exchanges was low compared to the last seven-day average, hinting at a drop in selling pressure. Apart from this, AMBCrypto reported previously that the NASDAQ formed a bearish divergence pattern. This means that a resurgence in sell pressure could see liquidity flow from stocks to Bitcoin.
Nonetheless, a few of the metrics did turn bearish. For example, the aSORP was red, meaning that more investors were selling at a profit. In the middle of a bull market, it can indicate a market top.
Also, its NULP pointed out that investors are in a belief phase where they are currently in a state of high unrealized profits.

Source: CryptoQuant
Therefore, AMBCrypto checked BTC’s daily chart to better understand whether it can sustain the bull momentum. The technical indicator MACD displayed a bullish crossover. Its Chaikin Money Flow (CMF) also registered an uptick.
Read Bitcoin’s [BTC] Price Prediction 2024-25
If the bull rally continues, then BTC might soon go above the $65.2k resistance and approach $68k next. However, in case of a bearish takeover, Bitcoin might drop to $57k again.


