

Binance Coin rose for the fifth consecutive day as on-chain activity showed rising active addresses and transactions in the network.
Binance chain active addresses are rising
Binance Coin (BNB) rose to an intraday high of $545, its highest level since Aug. 27, and 15% above its lowest point this month. It has surged by over 36% from its August lows.
Its recovery has mirrored that of other coins. Sui (SUI) rose to its Aug. 24 highs while, Popcat (POPCAT) and BinaryX (BNX) reached their highest levels in weeks.
BNB’s price increase was driven by on-chain metrics, which showed that the number of active addresses rose by 4% in the last 24 hours to 925.7k, while transactions increased by 15% to 4.2 million. According to data from Nansen, these transactions hit their highest level in almost a month.
However, zooming out, data shows that on-chain transactions and active addresses are not performing as well. The number of active addresses peaked at 3.58 million in December, meaning they have dropped by over 75%.
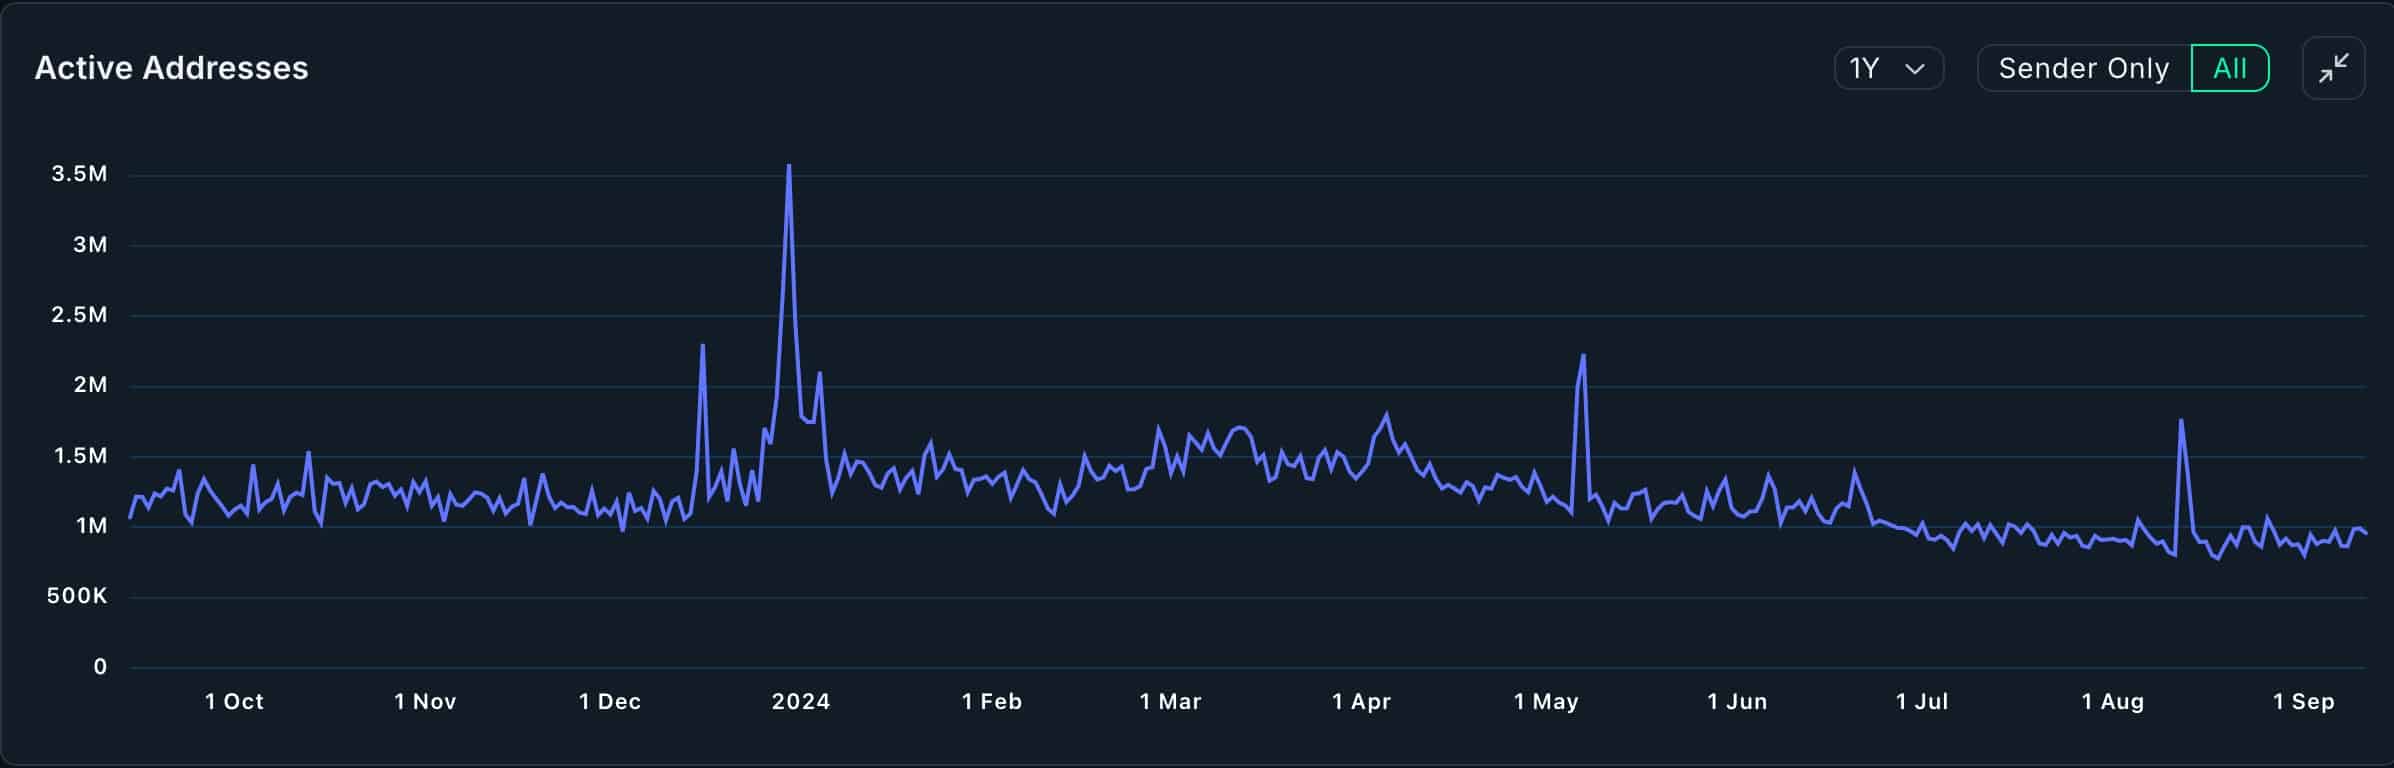
The number of transactions also peaked at 4.8 million in August and has since dropped by over 75%. BNB Smart Chain’s fees have also been in a downward trend, falling from over $1.5 million in April to $372,000.
More data by DeFi Llama shows that the total value locked in the BNB Chain’s DeFi ecosystem stood at over $4.4 billion, with Venus, PancakeSwap, and Lista DAO being the biggest apps. The TVL has dropped from over $5.8 billion earlier this year.
BNB Chain DEX platforms handled over $3.6 billion in assets in the last seven days, making it the fourth-biggest chain after Ethereum, Solana, and Arbitrum.
Another risk for Binance Coin is that it is primarily held by Binance and insiders, which could cause issues if they decide to sell. Data by CoinCarp shows that the top ten entities hold 75.6% of all tokens.
BNB has formed a bullish pattern
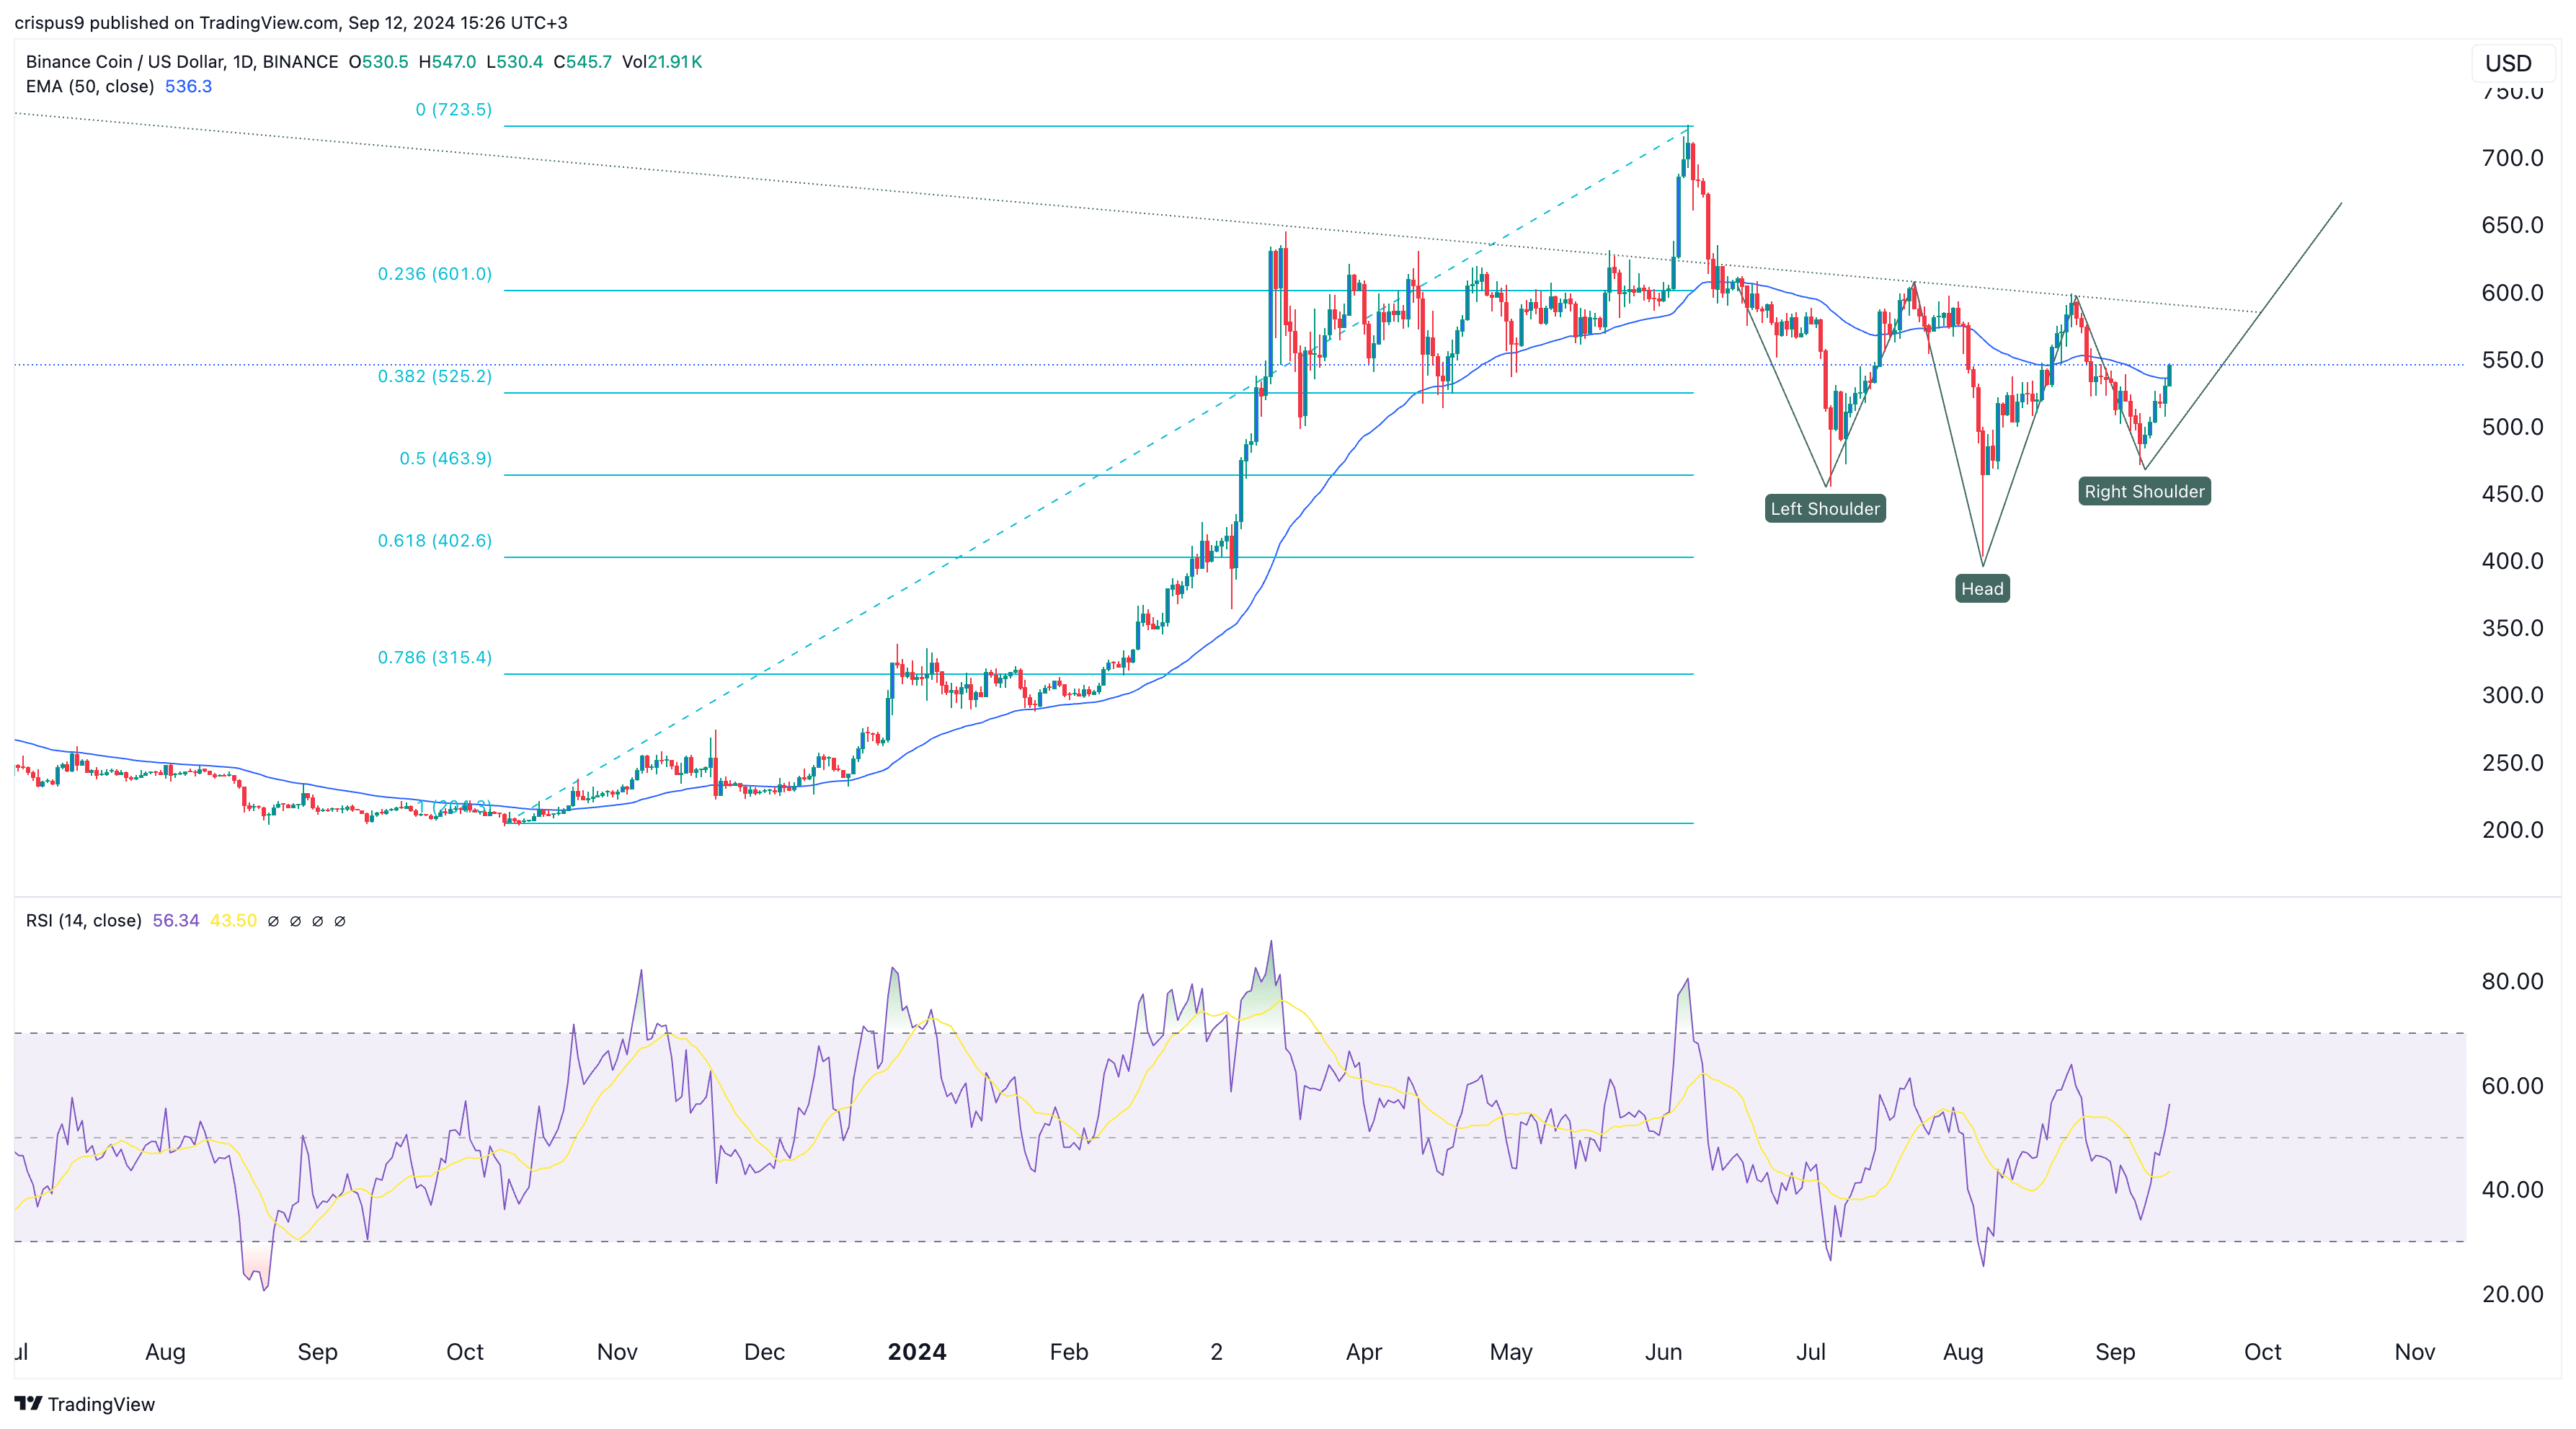
The daily chart shows that Binance Coin has formed an inverse head and shoulders chart pattern, a rare bullish signal. The recent rebound was part of the right shoulder.
BNB has moved above the 50-day moving average and the 38.2% Fibonacci Retracement point while the Relative Strength Index has crossed the neutral point at 50, meaning that it is gaining momentum.
Therefore, the coin may continue rising as bulls target the head-and-shoulders pattern’s neckline at around $600.
 Adoption Could Grow Further if China Follows U.S. Crypto Embrace")

