

The price of Bitcoin (BTC), the leading cryptocurrency, may be readying for a big move — upward, to be precise. The Bollinger Bands indicator points to such an opportunity. The thing is that on the daily time frame, Bitcoin saw a strong rebound off the lower band and made it straight to the middle band within just one daily candle.
The sell-off came as the middle band approached, but if the Bitcoin price continues to accumulate right behind the middle band represented by the 20-day moving average, it may be a precursor to further uptrend, with the upper band at $88,180 serving as an ultimate target. That is potentially a 5% move — enough for the market to feel optimistic again.
Related

Yet, one obstacle remains: Bitcoin is still below that middle band on the daily time frame, which means caution is warranted. Many have seen moves like this deflate just as quickly, a classic bull trap.
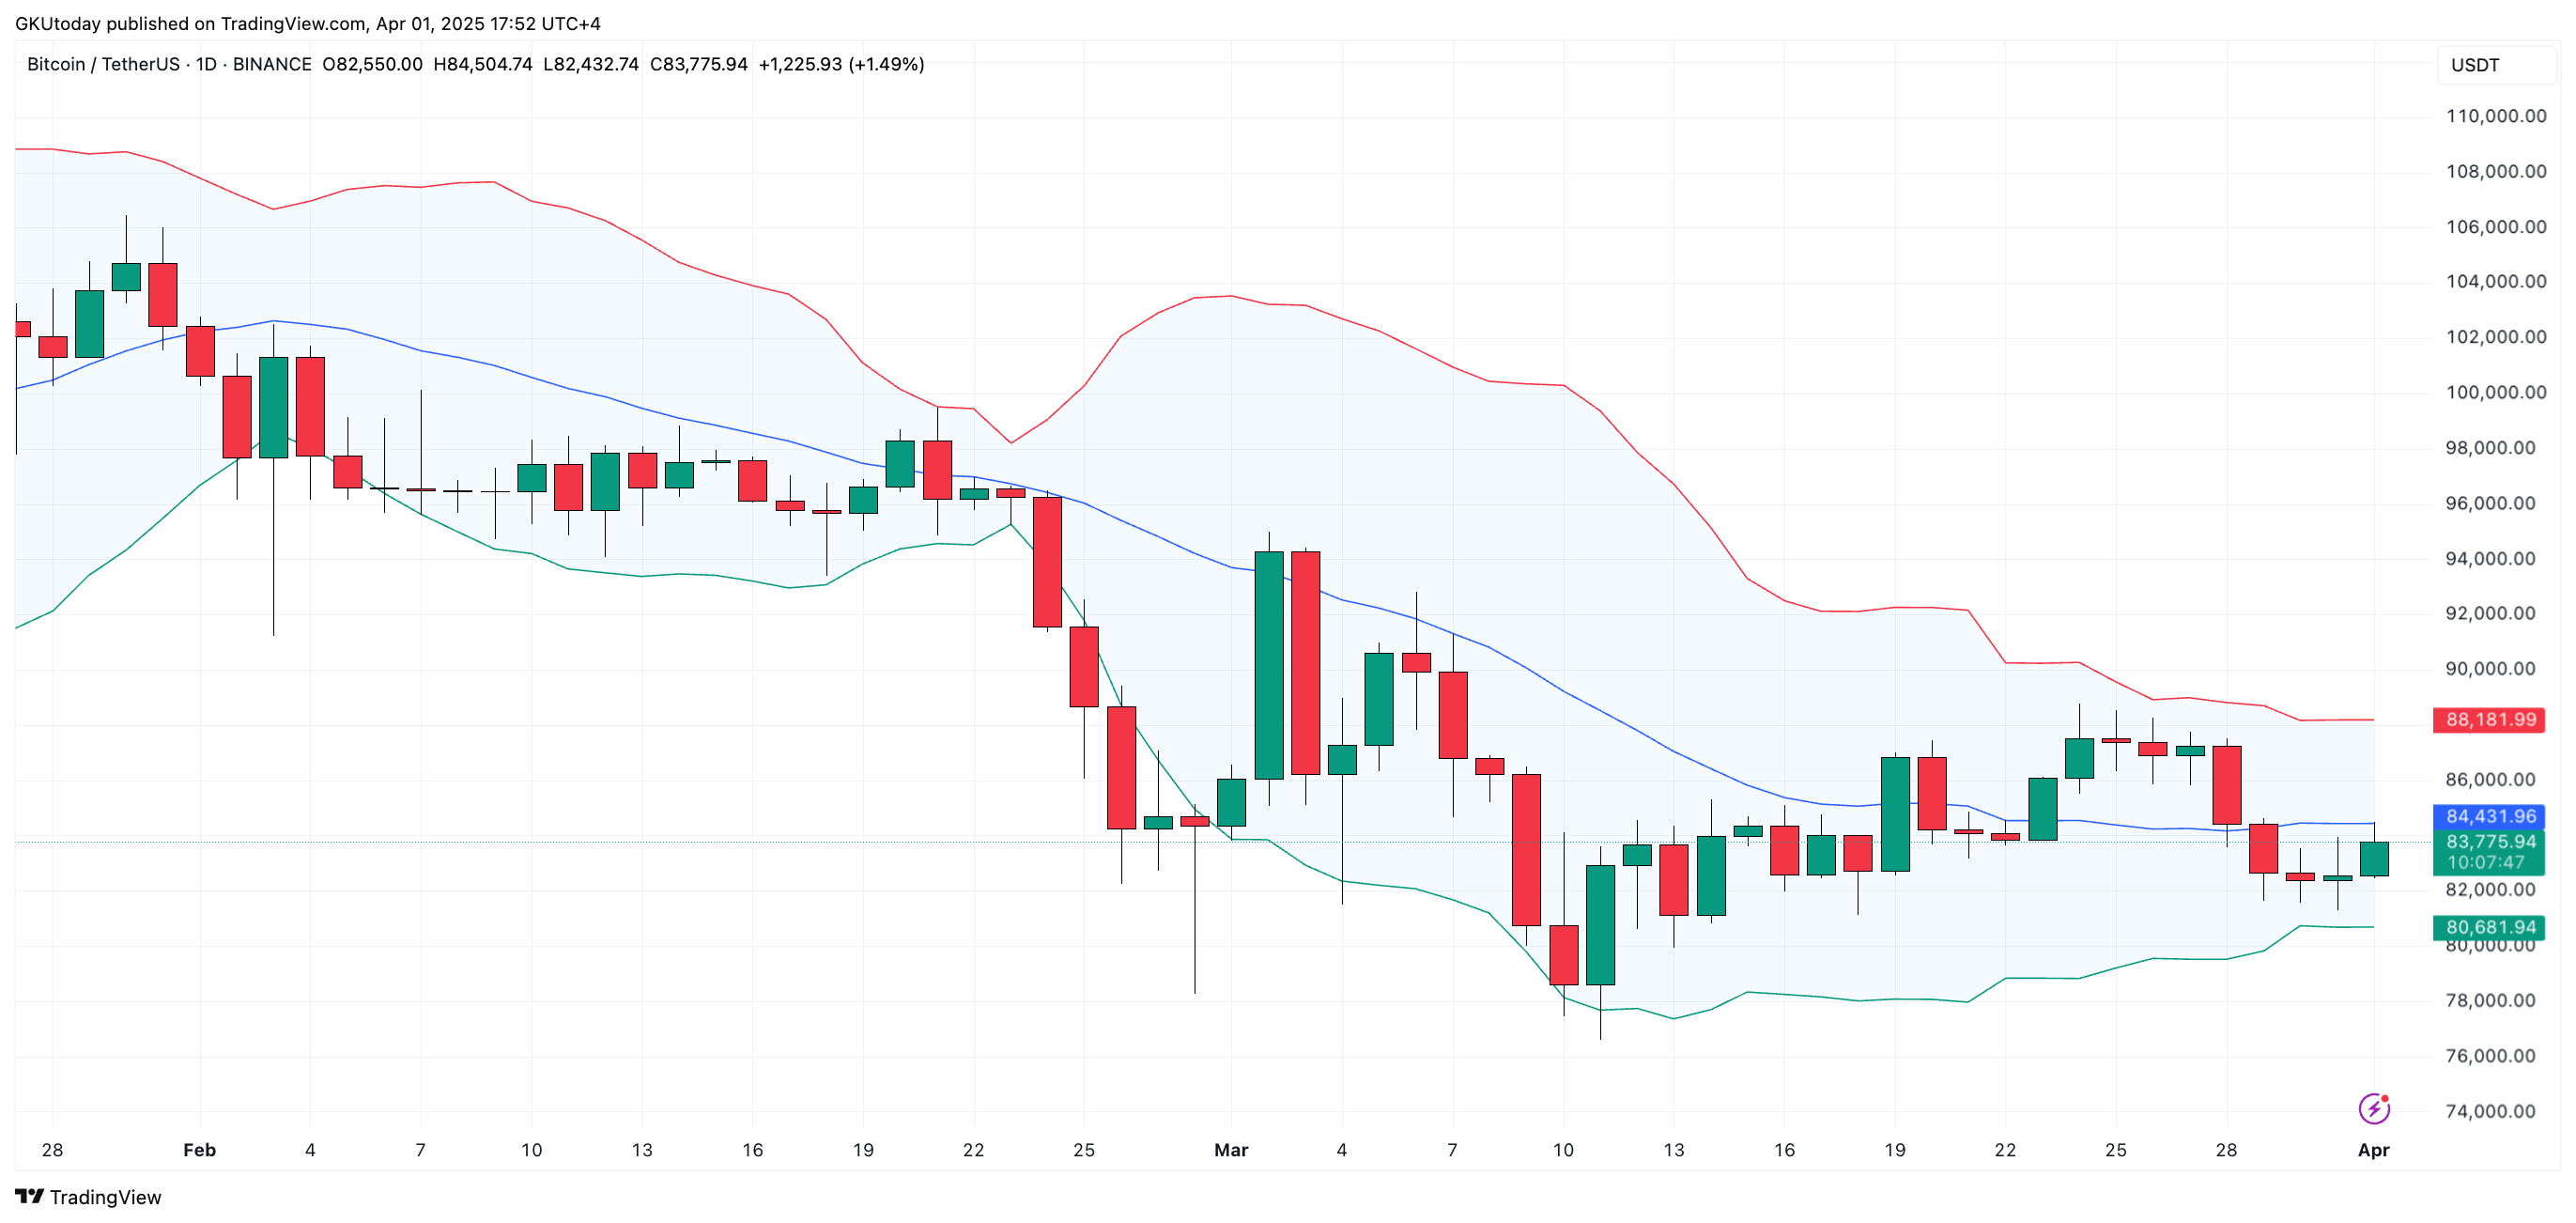
Still, slow and steady consolidation right beneath the middle band could flip the script entirely, positioning Bitcoin for an eventual break toward the upper band. The lower band, now stretched to $80,600, stands as a critical support zone — an area that, for now, holds firm.
Related

If buyers keep stepping in at higher levels, that is a signal of strength. But if Bitcoin wobbles here, that support level will need to do some serious heavy lifting.
So, Bitcoin bulls, buckle up. The market may be gearing up for one of those classic, blink-and-you-miss-it, vertical moves. The kind that, in hindsight, seemed obvious. And as always, one five-minute candle can redraw the picture completely.


