

- Bitcoin extends its decline on Monday after correcting 4.29% in the last week.
- Ethereum price closes below its daily support of $1,861, suggesting downside action ahead.
- XRP price falls below its 100-day EMA, indicating a correction on the horizon.
Bitcoin (BTC) continues its decline, trading below $82,000 on Monday after falling 4.29% the previous week. Ethereum (ETH) and Ripple (XRP) followed BTC’s footsteps and declined by 9.88% and 12.40%, respectively.
According to a Wall Street Journal (WSJ) post on Monday, President Trump’s team is considering “broader and higher tariffs” ahead of Wednesday’s reciprocal tariffs deadline. President Trump reportedly weighs “an across-the-board hike of up to 20%.” Again, April 2 is not just the end of tariff uncertainty, according to a post from the Kobeissi Letter on X.
BREAKING: President Trump’s team is weighing “broader and higher tariffs” ahead of Wednesday’s reciprocal tariffs deadline, per WSJ.
President Trump is reportedly weighing “an across-the-board hike of up to 20%.”
Again, April 2nd is NOT the end of tariff uncertainty. pic.twitter.com/1R568CP4U4
— The Kobeissi Letter (@KobeissiLetter) March 31, 2025
Bitcoin shows weakness as it closes below its lower consolidation boundary
After breaking and closing above the 200-day Exponential Moving Average (EMA) on Sunday, Bitcoin’s price has been consolidating between $85,000 and $88,000 until Thursday. However, BTC closed below its lower consolidation boundary on Friday and declined 5.53% until Sunday. At the time of writing on Monday, it continues to trade down below $82,000.
If BTC continues to correct, it could extend the decline to retest its next support level at $78,258.
The Relative Strength Index (RSI) indicator on the daily chart reads 40 below its neutral level of 50 and points downward, indicating strong bearish momentum.
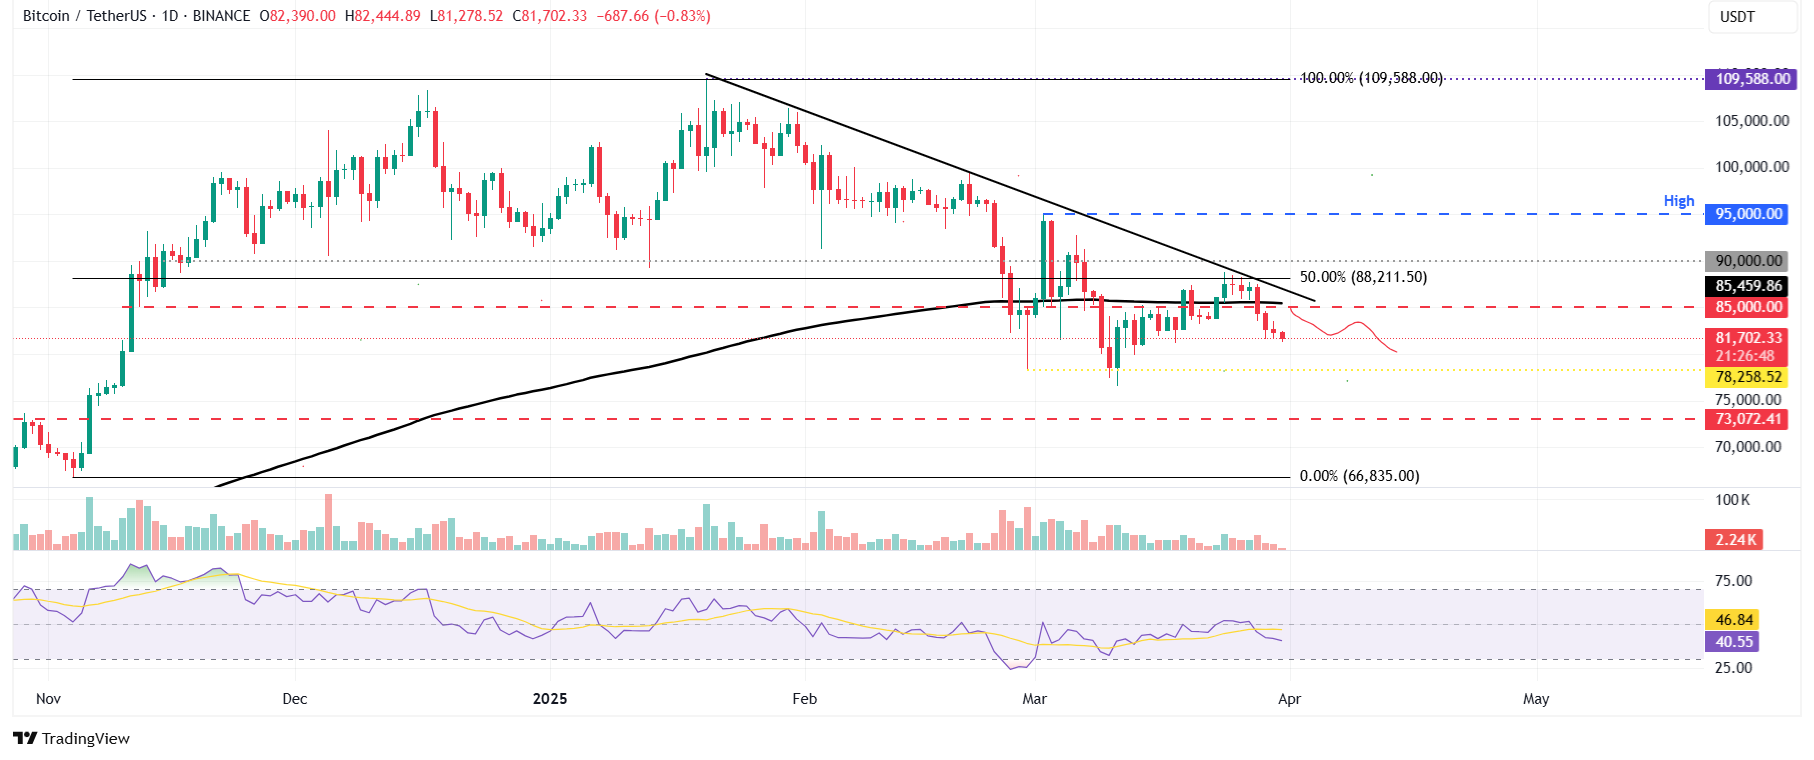
BTC/USDT daily chart
However, if BTC breaks and closes above the descending trendline (drawn by connecting multiple high levels since mid-January), which roughly coincides with the top boundary of the recent range, it could extend the recovery to retest the key psychological level of $90,000 and the March 2 high of $95,000.
Ethereum faces a correction as it closes below its daily support at $1,861
Ethereum price closed below its daily support level of $1,861 last week and declined 9.88%. On Monday, the start of this week, it hovers around $1,800.
If ETH continues its downward trend, it could extend its decline to retest its important psychological level of $1,700.
The RSI reads 34, below its neutral level of 50, indicating strong bearish momentum.
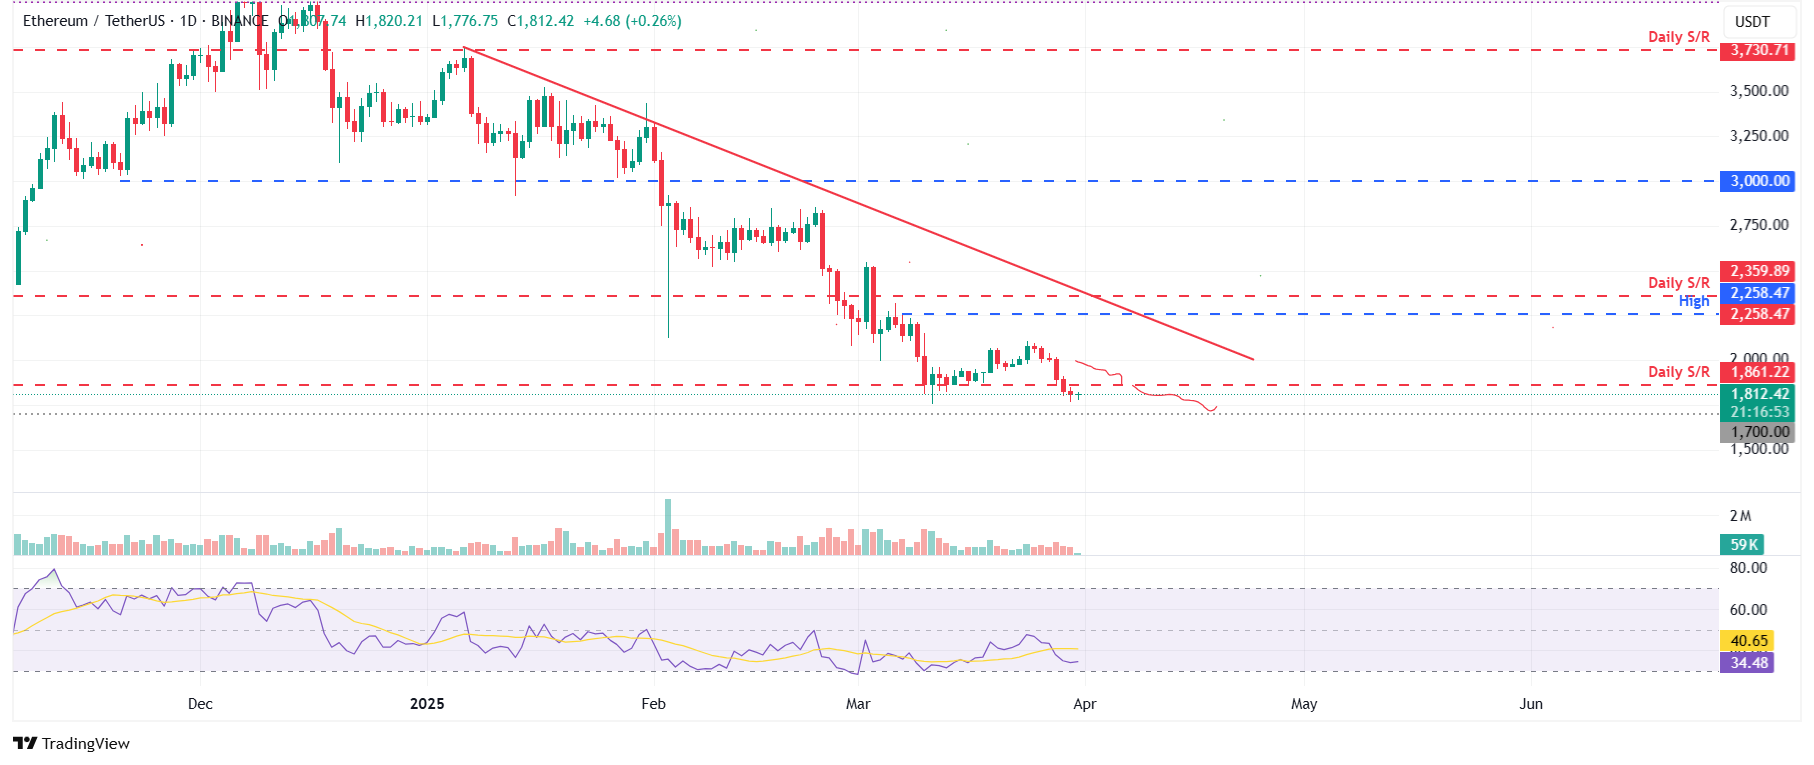
ETH/USDT daily chart
Conversely, if it continues to recover, it could extend the recovery to its previously broken daily support level of $1,861.
Ripple shows weakness as it closes below its 100-day EMA
Ripple price closed below its 100-day EMA at $2.30 last week and declined 12.40%. At the time of writing on Monday, it continues to trade down at around $2.11.
If XRP continues correcting, it could decline to test its next support level at $1.96.
The RSI on the daily chart reads 39, below its neutral level of 50, like Bitcoin and Ethereum, indicating bearish momentum.
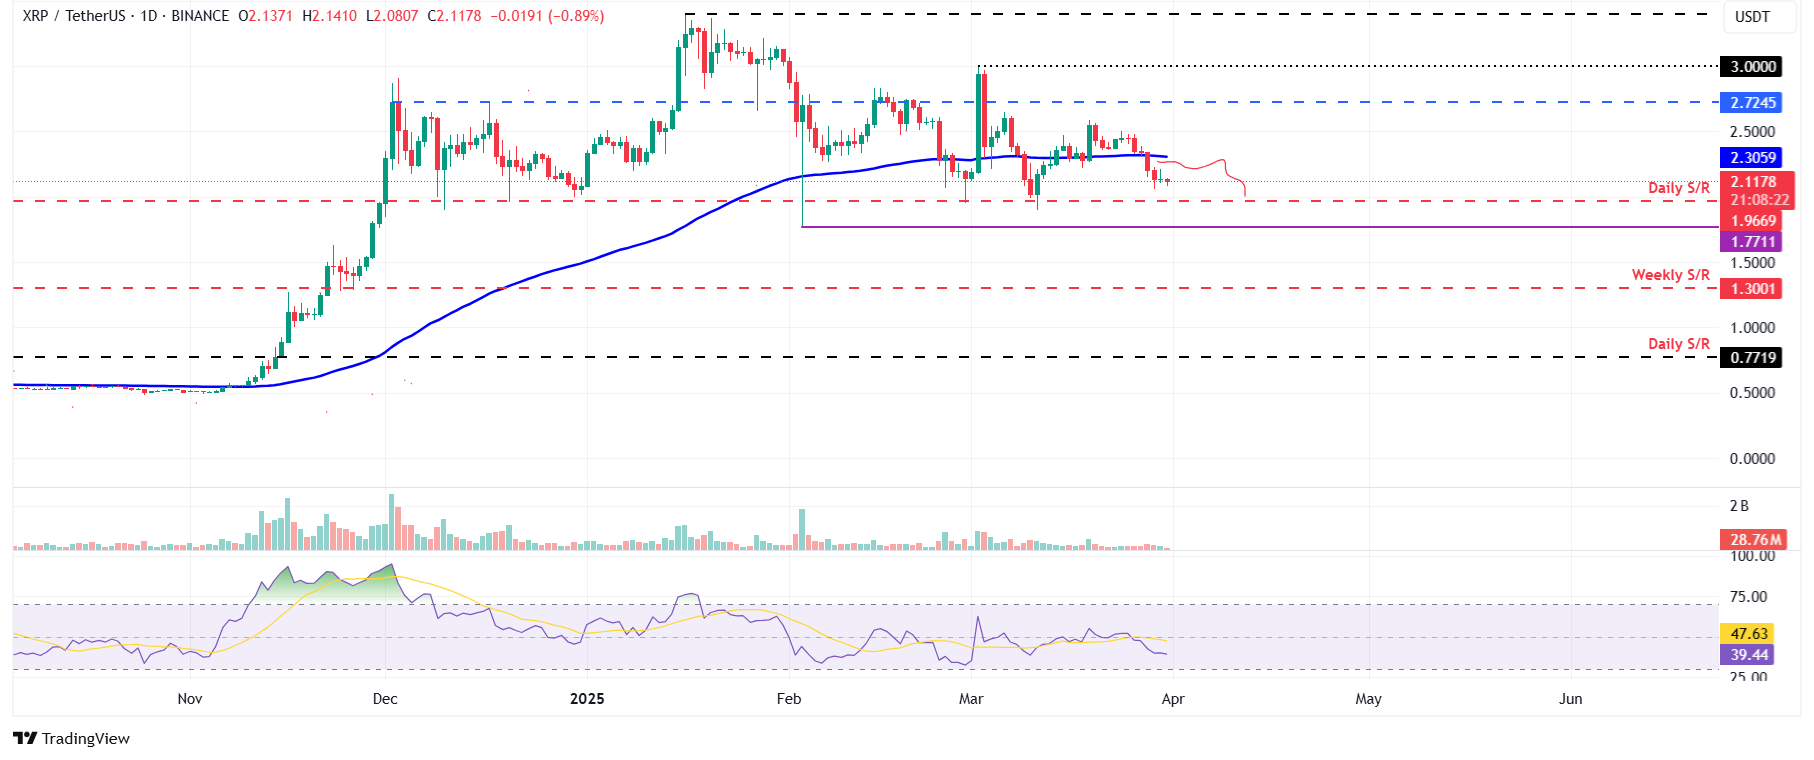
XRP/USDT daily chart
On the other hand, if it continues to recover, it could extend the recovery to its previously broken 100-day EMA at $2.30.
Bitcoin, altcoins, stablecoins FAQs
Bitcoin is the largest cryptocurrency by market capitalization, a virtual currency designed to serve as money. This form of payment cannot be controlled by any one person, group, or entity, which eliminates the need for third-party participation during financial transactions.
Altcoins are any cryptocurrency apart from Bitcoin, but some also regard Ethereum as a non-altcoin because it is from these two cryptocurrencies that forking happens. If this is true, then Litecoin is the first altcoin, forked from the Bitcoin protocol and, therefore, an “improved” version of it.
Stablecoins are cryptocurrencies designed to have a stable price, with their value backed by a reserve of the asset it represents. To achieve this, the value of any one stablecoin is pegged to a commodity or financial instrument, such as the US Dollar (USD), with its supply regulated by an algorithm or demand. The main goal of stablecoins is to provide an on/off-ramp for investors willing to trade and invest in cryptocurrencies. Stablecoins also allow investors to store value since cryptocurrencies, in general, are subject to volatility.
Bitcoin dominance is the ratio of Bitcoin’s market capitalization to the total market capitalization of all cryptocurrencies combined. It provides a clear picture of Bitcoin’s interest among investors. A high BTC dominance typically happens before and during a bull run, in which investors resort to investing in relatively stable and high market capitalization cryptocurrency like Bitcoin. A drop in BTC dominance usually means that investors are moving their capital and/or profits to altcoins in a quest for higher returns, which usually triggers an explosion of altcoin rallies.


