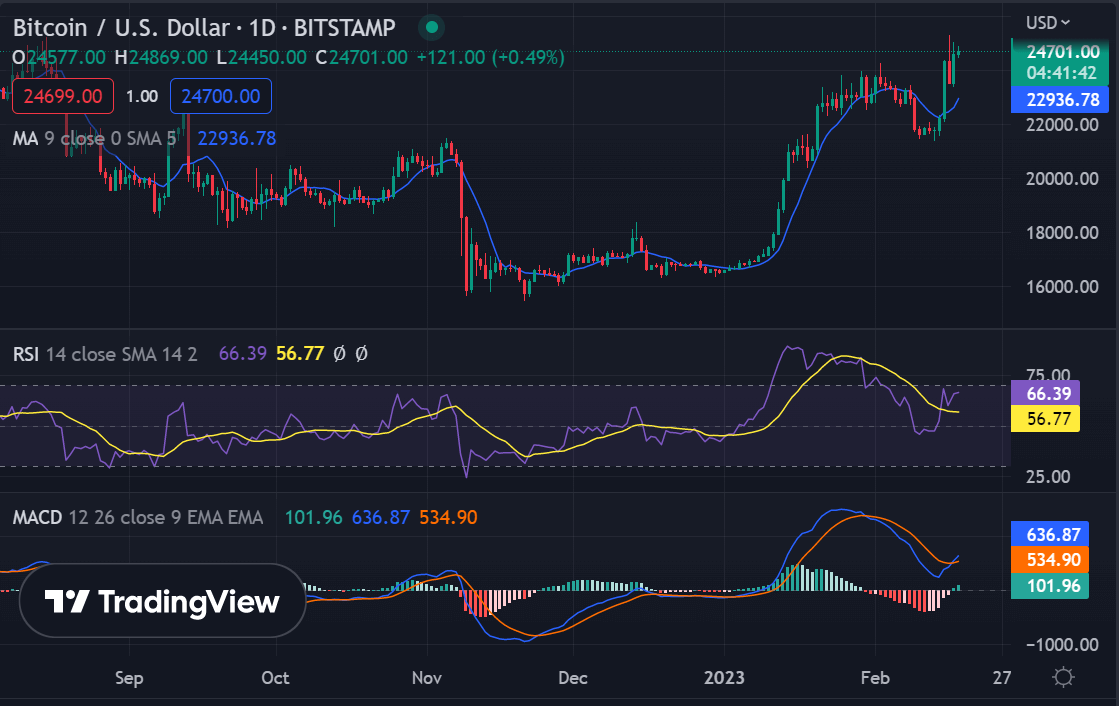
Bitcoin price analysis is showing an impressive surge as the bulls take charge and push BTC/USD above $24,676. The last few hours have seen a significant increase in coin value, and the bullish momentum has made BTC one of the top gainers in today’s market. The environment is favorable to buyers, and if the purchasing momentum picks up, the current bullish wave is likely to continue to intensify. The current resistance for BTC/USD is present at the $24,924 mark. If this level can be broken down, Bitcoin price could surge towards the next major resistance point of $25,000. However, if buyers fail to break through the resistance, we may see a slight pullback in prices.

On the downside, the current support for BTC/USD is present at $24,168. This level has been tested a few times and buyers have managed to protect it from being broken down. If this support fails to hold, Bitcoin could potentially enter a bearish cycle and prices could slide back toward the psychological support of $22,000.
Bitcoin price analysis 1-day price chart: Bullish momentum revives again
The daily chart for the Bitcoin price analysis shows that the coin is bouncing off of a descending triangle pattern. Since the previous 24 hours, the bulls have been in charge of the market as the price has broken above the $24,924 local resistance. More gains for Bitcoin buyers appear to be imminent as the price has just surpassed the $24,676 high, increasing in value by more than 1.61%.

The purchasers continue to make efforts, therefore it appears that there are more opportunities for resurrection. Additionally, the moving average (MA) number on the daily price chart is $222,936, signaling a bullish market trend. The increasing size of the green histograms on the chart suggests that the bulls are in control and are likely to continue pushing prices higher. In addition, the MACD indicator line is above the signal line and has given a buy signal. The Relative Strength Index (RSI) is at 56.77 and is trending upward, with more gain potential.
Bitcoin price analysis 4-hour chart: Buyers’ momentum gathering steam
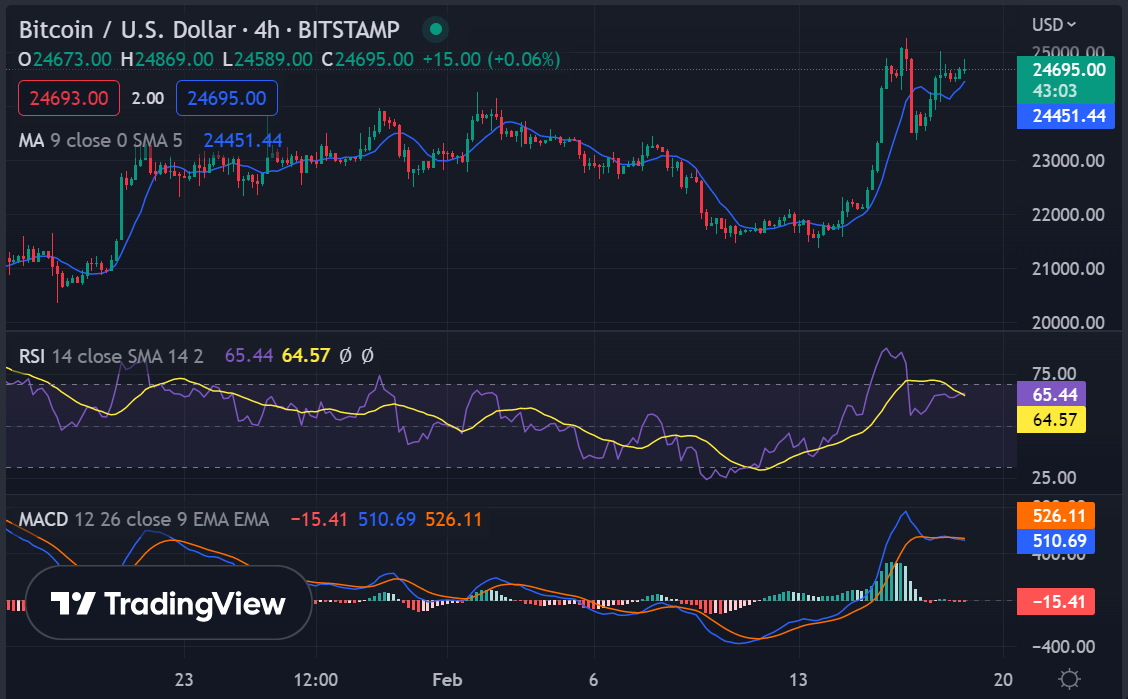
The 4-hour chart for the Bitcoin price analysis shows that the bulls are also in favor of this time frame. The majority of the increase was seen during the past four hours as bulls gathered tremendous momentum, making BTC one of the top gainers among the top 100 cryptocurrencies. The bullish momentum had previously been modest, so this is good news for buyers. A further point to consider is the moving average value, which is $24,451 in the case of the four-hour price chart.

Technical indicators do suggest a strong uptrend momentum in the hourly chart. The relative Strength Index showcases that BTC has just broken out of neutrality and is now heading toward the overbought territory. The MACD exhibits the strong uptrend momentum of the BTC coin. The MACD line is ahead of the signal line after a positive crossover.
Bitcoin price analysis conclusion
In conclusion, Bitcoin price analysis indicates that BTC is likely to continue rallying higher in the short term as buyers’ momentum begins to build up. However, investors should remain alert for any pullback or reversal as resistance levels are being tested. If support at the $24,168 level can be maintained, Bitcoin may reach an all-time high of $25,000 or higher.
While waiting for Bitcoin to move further, see our Price Predictions on XDC, Polkadot, and Curve


![Bitcoin nearing wave three completion [Video]](https://techtelegraph.co.uk/wp-content/uploads/2025/02/BTC-neutral-object-1_Large-218x150.png)
