

Bitcoin (BTC) shows a growing momentum and could drive the market north for a time, but only if this is sustained. The reverberations of this whim have reached Ethereum (ETH) and Ripple (XRP), but there is a lot to be proven before traders can trust any impetus that shows for now. Meanwhile, market players continue to hold out hope for spot BTC Exchange Traded Funds (ETF) approvals even though experts do not see it happening under the current regime.
Cryptocurrency metrics FAQs
The developer or creator of each cryptocurrency decides on the total number of tokens that can be minted or issued. Only a certain number of these assets can be minted by mining, staking or other mechanisms. This is defined by the algorithm of the underlying blockchain technology. Since its inception, a total of 19,445,656 BTCs have been mined, which is the circulating supply of Bitcoin. On the other hand, circulating supply can also be decreased via actions such as burning tokens, or mistakenly sending assets to addresses of other incompatible blockchains.
Market capitalization is the result of multiplying the circulating supply of a certain asset by the asset’s current market value. For Bitcoin, the market capitalization at the beginning of August 2023 is above $570 billion, which is the result of the more than 19 million BTC in circulation multiplied by the Bitcoin price around $29,600.
Trading volume refers to the total number of tokens for a specific asset that has been transacted or exchanged between buyers and sellers within set trading hours, for example, 24 hours. It is used to gauge market sentiment, this metric combines all volumes on centralized exchanges and decentralized exchanges. Increasing trading volume often denotes the demand for a certain asset as more people are buying and selling the cryptocurrency.
Funding rates are a concept designed to encourage traders to take positions and ensure perpetual contract prices match spot markets. It defines a mechanism by exchanges to ensure that future prices and index prices periodic payments regularly converge. When the funding rate is positive, the price of the perpetual contract is higher than the mark price. This means traders who are bullish and have opened long positions pay traders who are in short positions. On the other hand, a negative funding rate means perpetual prices are below the mark price, and hence traders with short positions pay traders who have opened long positions.
Bitcoin price shows growing momentum
Bitcoin (BTC) price shows growing momentum after a prolonged stagnation. The people’s crypto is up 2%, which is not a mean achievement considering how close-knit the price was moving along the equilibrium level at $29,399 over the weekend.
At the time of writing, Bitcoin price is $29,657, after breaking above the equilibrium level, volatility seems to have been restored, and now BTC is on a course north and will potentially tag $30,476 if bulls nurture their current buying appetite.
With the Relative Strength Index (RSI) pointing upwards, some growing momentum could see Bitcoin price continue north. After flipping the 50-day Exponential Moving Average (EMA) from a resistance level to support, upwards is now the path with the least resistance. An increase in buying pressure could see BTC complete the rally to the forecasted $30,400 range.
In a highly bullish case, Bitcoin price could shatter past this hurdle to record a new range high around the $31,804 psychological level.
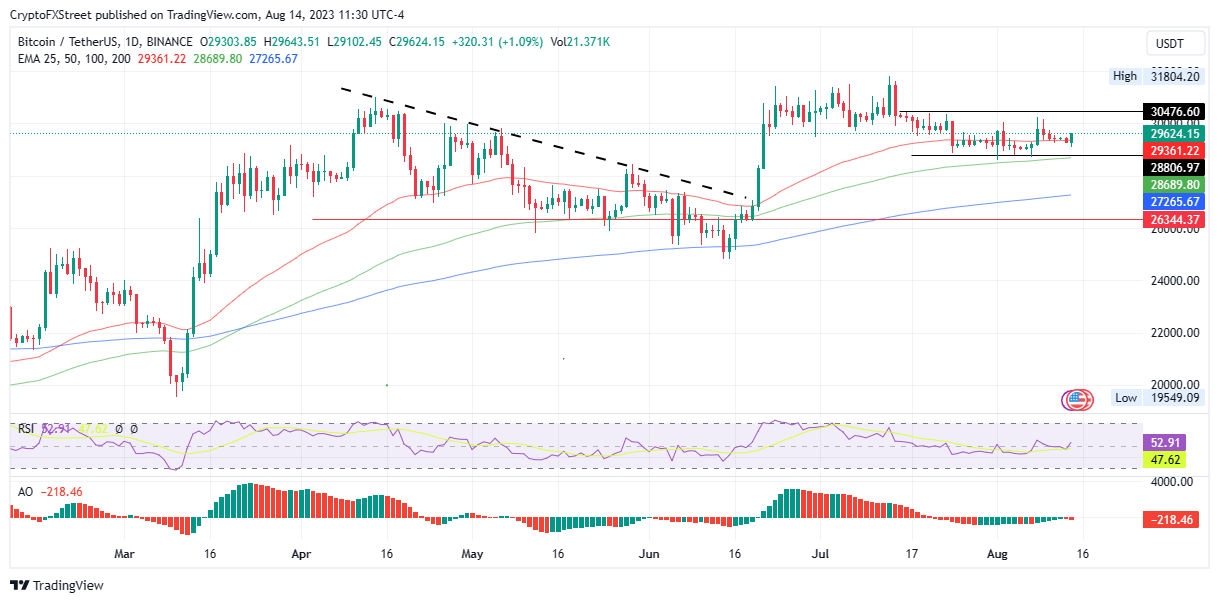
BTC/USDT 1-day chart
On the flipside, a rejection from the $30,476 level could see Bitcoin price move back below the 50-day EMA and lower to break below the $28,806 support level before tagging the 100-day EMA at $28,690. If this support level fails to hold, BTC could continue south to tag the 200-day EMA at $27,265 or, in the dire case, extend to the June 19 low at around $26,344.
Such a move would constitute a 10% drop from the current level. Notably, the position of the Awesome Oscillator (AO) histograms in negative territory points to the presence of bears in the market, which could threaten the current uptrend.
Also Read: Bitcoin ETF potential approval could come close to BTC halving
Ethereum price waits for BTC confirmation
Ethereum (ETH) price remains in a bind, tucked between the 50-day and 100-day EMA at $1,859 and $1,843, respectively. If BTC makes a strong move north, ETH could shatter past the 50-day EMA to forge north, potentially breaching the next roadblock at $1,891.
This assumption stands considering Bitcoin’s correlation to Ethereum has proven strong of late, with the two giants painting the same price action during the weekend on the four-hour timeframe.
In a highly ambitious case, the largest altcoin by market capitalization could extend into the $2,000 zone to tag $2,005, a level last tested in mid-July.
The RSI, like in the case of BTC, is edging north to show rising momentum. If this is nurtured, Ethereum price could complete the 10% climb to $2,005.
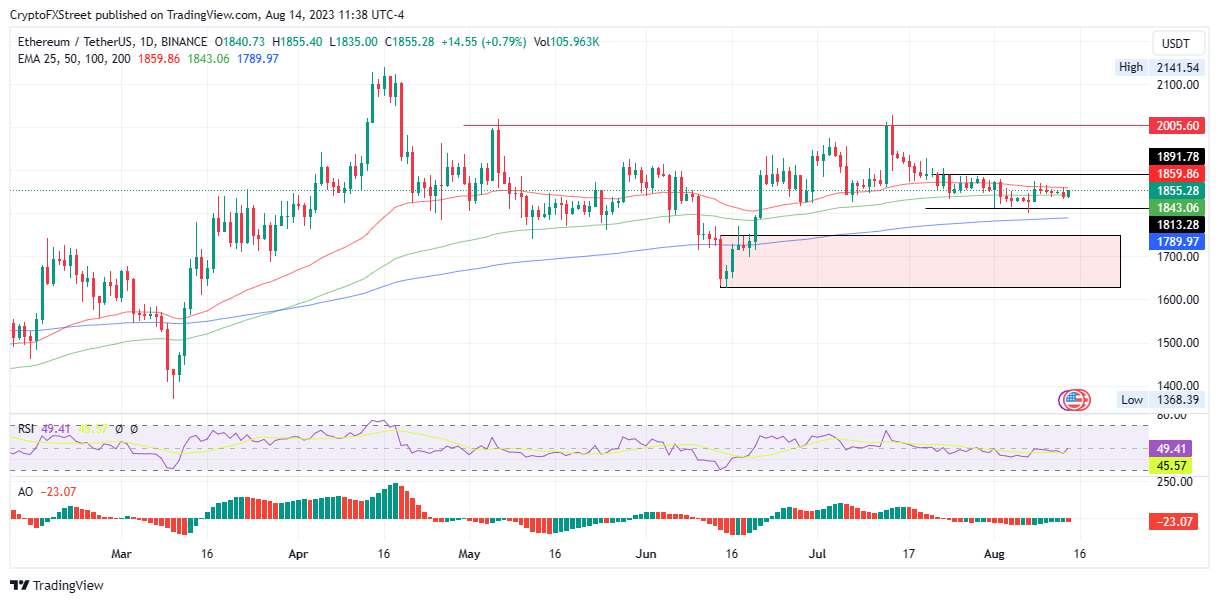
ETH/USDT 1-day chart
On the other hand, if current bullish momentum fades and bears take charge, Ethereum price could slide below the 100-day EMA at $1,843 and tag the $1,813 support level. Increased selling pressure below this level could push ETH to the 200-day EMA at $1,789.
In the dire case, Ethereum price could approach or dip into the demand zone marked in pink. This would be the likely turnaround point considering it represents an order block where bulls are likely to buy aggressively.
It is worth considering the possibility of the demand zone failing to hold as support, in which case it could transform into a bearish breaker, clearing the path for further losses.
Also Read: Ethereum price hovers around equilibrium as ETH future-based ETF filings await October verdict.
Ripple price readies for a 20% slump
Ripple (XRP) price is trading within a narrow range, a move that has led to doji candlesticks forming. As markets grow damp, this repetitive pattern could see XRP continue the downtrend, going down as far as 20% to tag the $0.5048 support level.
The position of the RSI below 50 and the AO histograms in the negative zone show that bears have the advantage, increasing the odds for a downtrend. Moreover, the Ichimoku Cloud hovering above the Ripple price action adds credence to the bearish momentum.
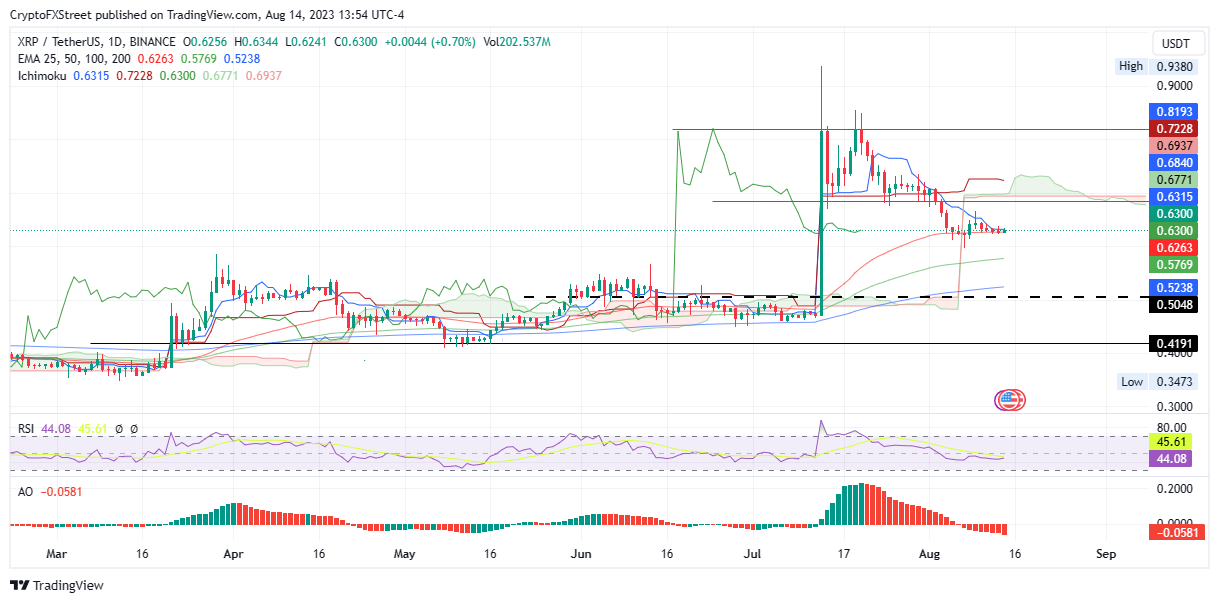
XRP/USDT 1-day chart
Conversely, a break above the conversion line of the Ichimoku (blue) at $0.6315 could clear the path for Ripple price to head north, possibly reaching the cloud itself. However, Ripple price remains in mucky waters unless XRP breaks about the baseline of the Ichimoku (red) at $0.6937.
Ripple price must decisively break past the $0.8193 for a confirmed uptrend. Such a move would constitute a 30% ascent from current levels.


