

Coinbase stock slipped for eight straight days, the longest losing streak since July, as cryptocurrencies continued falling.
Coinbase is facing major headwinds
Decentralized and centralized exchanges have come under pressure as cryptocurrency volume has dropped in the past few months.
Data from DeFi Llama shows that the volume traded in DEXs peaked at $260 billion in March and then retreated to $175 billion in August. More data shows that the volume traded on CEX platforms stood at $1.2 trillion in August, down from $2.48 trillion in March.
This volume has dropped due to the weak performance of Bitcoin (BTC) and other altcoins. Bitcoin remains in a bear market after falling by over 23% from its highest point this year. Similarly, Ethereum (ETH) has dropped by 41% from its year-to-date high, while Solana (SOL) is down by over 36%.
In most cases, the volume on crypto exchanges closely correlates with price movements. For example, Coinbase’s total volume in Q1 was over $300 billion as cryptocurrencies surged. Its volume dropped to $226 billion in Q2 as prices fell.
Coinbase stock’s retreat has also coincided with the sluggish performance of spot Ethereum and Bitcoin ETFs. Data from SoSoValue shows that spot Bitcoin ETFs have shed assets over the last seven consecutive days. Ethereum ETFs have also lost assets in six of the last seven weeks. ETF asset flows are important for Coinbase since it is the custodian of choice for most funds.
Meanwhile, Base, the company’s layer-2 network, has also lost assets in the last seven days. It has over $1.4 billion in assets, making it the sixth-biggest chain in the industry. The volume of coins traded in its DEX platforms fell by 10% to $3.06 billion, bringing its cumulative total to over $93 billion.
Coinbase stock has formed risky patterns
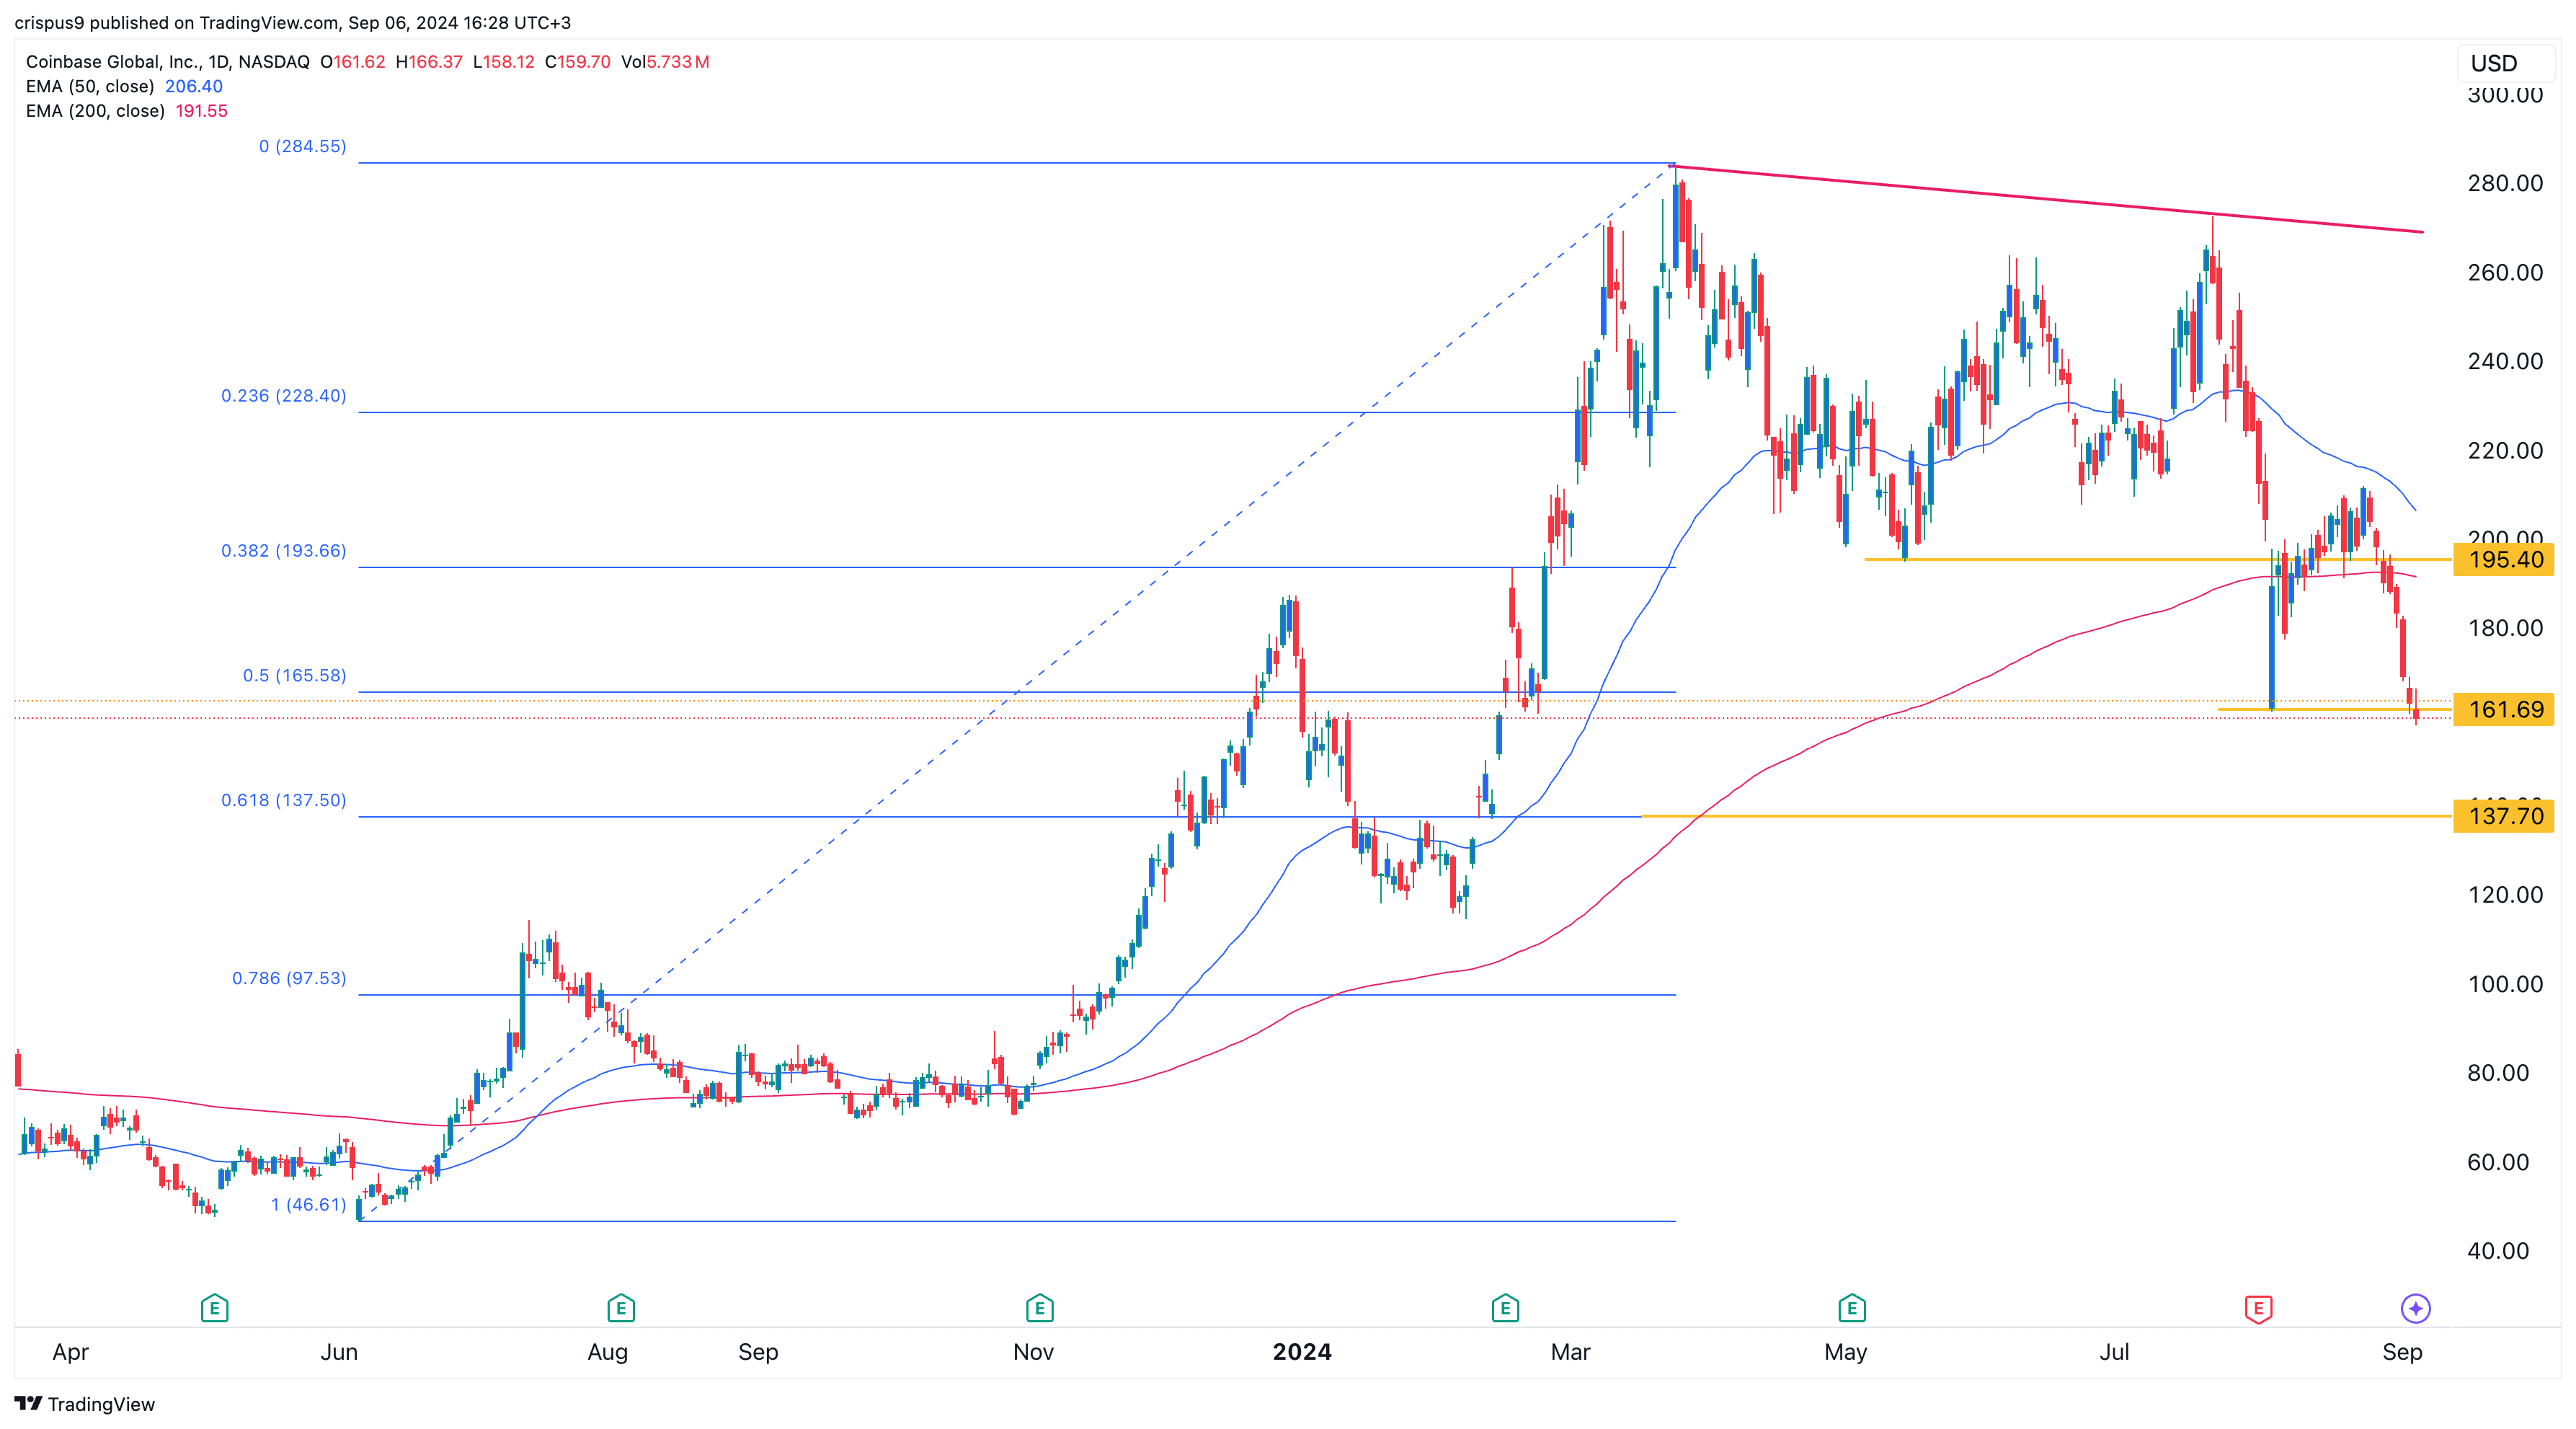
Technically, Coinbase stock has formed several bearish patterns, signaling more downside. It formed a slanted double-top pattern, with its neckline at $195.40, its lowest swing on May 14. It dropped below this neckline last week.
The stock has also moved below the 50% Fibonacci retracement level and the 200-day Exponential Moving Average. Most notably, it fell below the crucial support level at $162, its lowest swing in August, invalidating the double-bottom pattern that was forming.
Therefore, the path of least resistance is downward, with the next reference level to watch at $137.70, the 61.8% retracement point, and 15% below the Sep. 6 level.


