

Bitcoin’s global electricity usage
Using network hash rate data from January 2016 through December 2021 and data on mining equipment power consumption and efficiency5,30, Fig. 1 presents global electricity usage of mining BTC and prices per coin. On the basis of these estimates, in 2020 BTC mining used 75.4 TWh yr−1 of electricity, which is more energy than used by Austria (69.9 TWh yr−1 in 2020) or Portugal (48.4 TWh yr−1 in 2020)31. There is a general upward time trend in BTC electricity use and a close correlation between BTC prices and mining energy usage. The decline in BTC exchange prices and mining energy use in the summer of 2021 is likely due in part to China’s banning of financial institutions and payment companies from providing cryptocurrency-related transactions32.
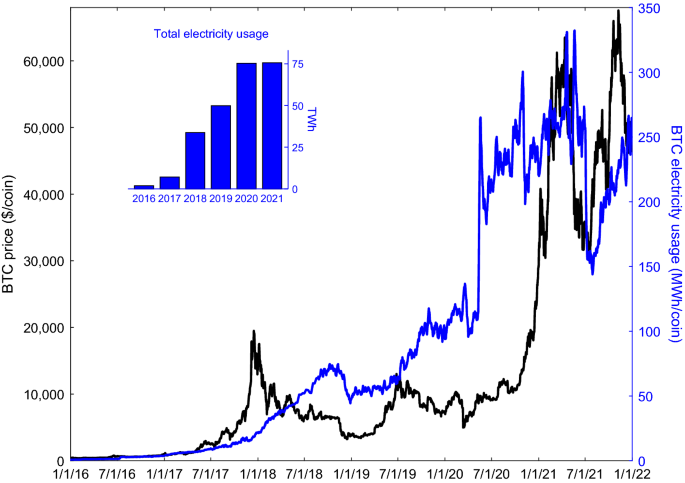
Global 7-days averaged daily electricity usage of mining activity (right axis) and coin exchange price in US$ (left axis) for Bitcoin (BTC). Data from January 1, 2016 to December 31, 2021 shown. Electricity usage is calculated based on network hash rate data downloaded from Blockchain Charts (https://www.blockchain.com/charts) and mining rig efficiency (see Methods section). Prices downloaded from Yahoo! Finance (https://finance.yahoo.com/cryptocurrencies/). All network hash rate and price data are supplied in the Supplementary Data.
Estimates from Cambridge University suggest the majority of electricity used to mine POW cryptocurrencies comes from coal and natural gas, though hydropower use was likely prominent in China until cryptocurrency mining was banned there32,33. Globally, it is estimated that 39% of POW mining is powered by renewable energy, meaning that non-renewables, such as fossil fuels, power the majority (~ 61%)33. Due to its considerable fossil fuel energy use, cryptocurrency mining contributes to global carbon emissions30,34 with associated environmental damages35. Goodkind et al.29 estimated that in 2018 each $1 (US$) of BTC market value created through mining was associated with $0.49 (US$) in combined health and climate damages in the US and $0.37 (US$) in China. Krause and Tolaymat5 estimated that BTC, Ether, Litecoin, and Monero coins were responsible for 3–15 million tonnes of CO2 emissions over January 2016 to June 2018. For comparison, in 2018, similar amounts of CO2 were emitted from Afghanistan (7.44 million tonnes), Slovenia (14.1 million tonnes), and Uruguay (6.52 million tonnes)36.
Climate damages associated with bitcoin mining
As mining efforts have increased over time, we estimate steeply increasing CO2e (carbon dioxide equivalent) emissions per coin created. Using a global estimate of the location of BTC miners and the local electricity mix, and regional CO2e emission coefficients by generation type37, a BTC mined in 2021 is responsible for emitting 126 times the CO2e as a BTC mined in 2016—increasing from 0.9 to 113 tonnes (t) CO2e per coin from 2016 to 2021 (Fig. 2A).
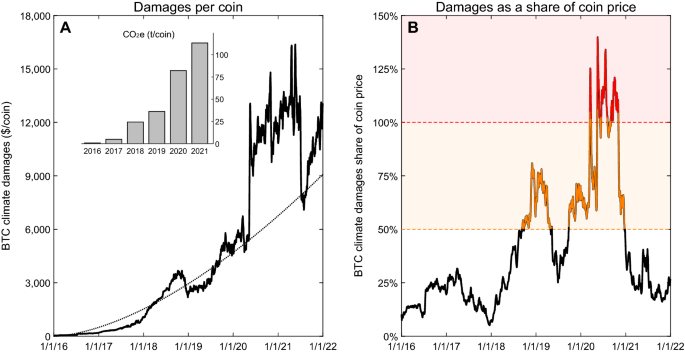
Global estimates of Bitcoin (BTC) mining’s climate damages, CO2e emissions, and climate damages as a share of coin price. (A) Estimated climate damages ($/coin mined) and CO2e emissions (t/coin mined; bar chart) of BTC. A non-linear trend line has been fit to the damages per coin data to illustrate time trends (dotted line). (B) Climate damages as a share of the coin’s price for BTC. Values displayed are the 7-days running average. Climate damages per coin mined in (A) were divided by the daily market price of the coin and multiplied by 100 to put into percentage terms for calculation in (B). $100 t−1 damage coefficient used for CO2e emissions based on ranges in the peer-reviewed literature. Damages are in US$. Estimates span January 1, 2016 to December 31, 2021. See the Supplementary Data for emissions factors used and the climate damages data.
With increasing CO2e emissions per coin created, climate damages of producing BTC increased over time (Fig. 2A). Using a $100 t−1 damage coefficient for CO2e emissions (dollar values in US dollars (US$) unless otherwise noted), commonly referred to as the social cost of carbon (SCC), each BTC created in 2021 resulted in $11,314 in climate damages, on average, with total global damages of all coins mined in 2021 exceeding $3.7 billion. Between 2016 and 2021, total global BTC climate damages are estimated at $12 billion. With rapid price increases in BTC at the end of 2020, climate damages of mining represented 25% of market prices for 2021 (Fig. 2B). This percentage is useful to normalize the scale of externalities to the market price of the product. We offer two potential ranges of concern in Fig. 2B—when the climate damages as a share of the coin price are between 50 and 100% (shown in amber), and when they are > 100% (shown in red). The former would be above those found on average in Goodkind et al.29, while the latter represents times when BTC was “underwater” on a per coin basis (i.e., climate damages exceeding the coin’s market price). With much lower prices in 2019 and 2020, BTC climate damages were 64% of market price, on average. For more than one-third of the days in 2020, BTC climate damages exceeded the price of the coins sold. Damages peaked at 156% of coin price in May 2020, suggesting each $1 of BTC market value created in that month was responsible for $1.56 in global climate damages.
By our first sustainability criterion that “the trend of the estimated climate damages per BTC mined should not be increasing, as the industry matures,” BTC fails. There is a clear upward trajectory in per coin estimated climate damages, as seen from the non-linear trend line in Fig. 2A. Rather than declining as the industry matures, each new BTC coin mined is, on average, associated with increasing climate damages.
BTC also fails our second sustainability criterion that “per BTC mined, its market price should always exceed its estimated climate damages.” From Fig. 2B, at multiple periods of time in 2020, BTC climate damages as a share of the coin’s price were greater than 100% (areas indicated in red). BTC was “underwater” at these intervals, meaning that each coin mined produced climate damages exceeding the market price of the coin. Over 2016–2021, BTC was underwater on 6.4% of days, and the damages exceeded 50% of coin price on 30.6% of days.
What if the social cost of carbon is varied?
One key parameter where we assume a range of values from available evidence is the SCC. For our baseline estimate, we follow Pindyck38 in choosing $100 t−1. SCC is the estimated present value of monetary damages from emitting an additional tonne of carbon today and monetizes the negative social externalities of carbon emissions38. From a policy and regulatory perspective, SCC is a key parameter for evaluating the social costs (i.e., those not considered in the market price) of a high-energy use product or service. Carleton and Greenstone39 note the central role of the United States (US) Government’s official SCC estimate in both domestic US and international climate policy. SCC estimation has extensive history in economics40,41,42, and such values are widely used39.
However, while analyses that use SCC estimates must make assumptions on its value or range, there is no consensus38. There is a growing literature on both estimating the SCC and modeling the optimal SCC for pricing the externality43. The current US Government estimated SCC value is $51 t−1 CO2e in 2020 inflation-adjusted dollars44. However, President Biden’s Executive Order #13,990 (January 20, 2021) directed an updating of this value45.
Even a select review of recent SCC estimation studies encompasses a broad range of values38,40,43. Depending on varying assumptions and approaches, recent empirical studies can easily support a range of values around our SCC baseline coefficient of $100 t−1 CO2e, from + /−$50 t−1 on either side. Thus, to represent some of this variability we use two alternative SCC values to augment the $100 t−1 baseline: (i) $50 t−1 CO2e (essentially equivalent to the 2020 value of the 2010 US Government estimate), and; (ii) $150 t−1 CO2e.
We re-estimate climate damages of BTC using these alternative SCC values (Supplementary Table 1). The high and low values of the SCC adjust the estimated climate damages proportionally to the baseline value of $100 t−1 CO2e, and greatly impact the magnitude of the estimated damages. At $150 t−1 CO2e, BTC climate damages per coin mined averaged $4632 over 2016–2021, compared to $1544 at $50 t−1 CO2e, versus $3088 at $100 t−1 CO2e from the results in Fig. 2A. With the high SCC, the climate damages were underwater 17% of the time between 2016 and 2021 (69% of days in 2020), whereas with the low SCC the climate damages were never underwater. Regardless of SCC value, climate damages of BTC mining increased substantially from 2016 to 2021, with a continuing upward trajectory.
What if mining used more renewable energy?
The CO2e emission estimates and climate damages depend, critically, on assumptions of the share of renewable electricity sources used in cryptocurrency mining. Due to the decentralized and anonymized nature of cryptocurrency mining, determining actual energy sources is a challenge and no primary data sources exist30. This has led to a range of estimates in the literature. Prior work suggests the share of renewables (e.g., solar, wind, hydropower) used by POW mining processes may vary considerably, from 25.1% of mining’s total electricity use37, to 39%33 and even up to 73%46. Some of the differences in estimates are due to the time periods studied. China, once a large source of global Bitcoin mining that likely used significant amounts of renewable hydropower30, banned all cryptocurrency mining in 202132. This appears to have drastically altered the global share of renewables used by Bitcoin miners, resulting in an increased use of fossil fuels37. Thus, renewable share estimates before and after the China ban would be expected to be different, and perhaps considerably so. Other differences, such as the methods used to locate miners, assumptions on mining rig efficiency and cooling needs, and assumptions on electricity sources can also drive differences in the range of estimates found in prior work30,37.
Given the large ranges found, we expand our analysis with an alternative higher renewable electricity scenario. In this scenario, we increase the share of renewable generation used to mine cryptocurrencies from the baseline of 38.5% (plus 5.2% nuclear power) to a scenario with 50% more renewables (to 57.8% in total plus 5.2% nuclear). This scenario represents a hypothetical situation in which cryptocurrency miners use substantially more renewables than the baseline and a large majority (63%) of electricity from directly carbon free sources (renewables and nuclear combined).
Compared to the baseline renewable share, increasing use of renewables in BTC mining reduces associated climate damages per coin mined (Supplementary Table 2). With a 50% increase in the renewable share, BTC climate damages are approximately two-thirds of the baseline magnitude. Yet, even for this high renewable scenario the climate damages still average 23% of the coin’s price (2016–2021), despite miners only using 37% of their electricity from fossil fuels. Thus, even if BTC miners obtained the majority of their electricity from renewables and directly carbon free sources, there are still large and growing climate damages.
Comparison to other commodities
Recall from Fig. 2B, which showed climate damages per coin market price, that the ratio of BTC damages to price declined from 2020 to 2021. This does not necessarily imply that the POW mining process is sustainable. To contextualize these ratios, we make climate damage comparisons against some other relevant commodities and economic products: (i) electricity generation by source (hydropower, wind, solar, nuclear, natural gas, and coal), (ii) crude oil processed and burned as gasoline, (iii) automobile use and manufacturing (sport utility vehicles (SUVs) and mid-sized sedans), (iv) agricultural meat production (chicken, pork, and beef), and; (v) precious metals mining (rare earth oxides (REOs), copper, platinum group metals (PGMs), and gold). Figure 3 shows climate damages per unit market price (% of price) for BTC compared to lifecycle climate damages of these 16 other commodities.
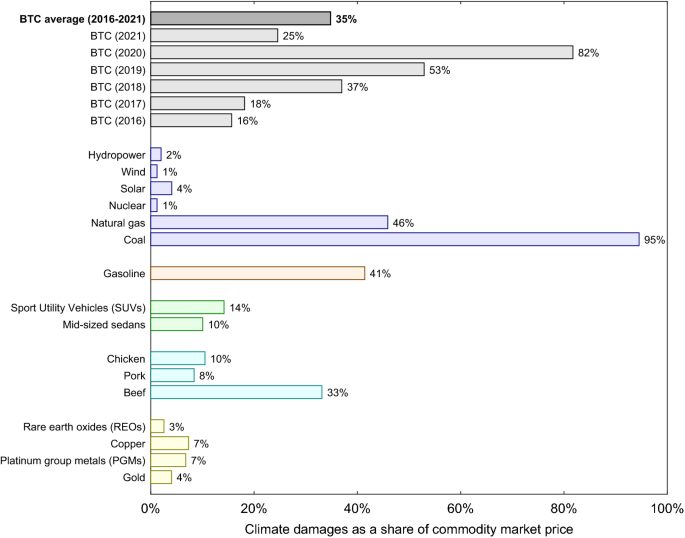
Bitcoin (BTC) mining’s climate damages as a share of coin market price (2016–2021), compared with full lifecycle analysis climate damages as a share of market price for other commodities (for a single year). Damages are expressed in percentage terms (% of market price). BTC climate damages only include energy use and emissions from running mining rigs, and do not include climate damages associated with cooling and manufacturing of mining rigs or other potential sources of carbon equivalent emissions. This makes estimated BTC damages a lower bound compared to the full lifecycle damages for the other commodities shown. Climate damages for the other commodities and economic products shown are calculated using lifecycle estimates from the peer-reviewed literature and US government agencies combined with publicly available price data. All commodity prices and lifecycle climate damage data are in the Supplementary Data.
Climate damages of BTC averaged 35% of its market value (2016–2021), and 58% (2020–2021). This places BTC in the category of other energy intensive or heavily-polluting commodities such as beef production, natural gas electricity generation, or gasoline from crude oil, and substantially more damaging than what we might consider to be more sustainable commodities like chicken and pork production and renewable electricity sources like solar and wind. For solar and wind specifically, their full lifecycle climate damages as a share of their market prices are an order-of-magnitude below those of BTC over 2016–2021. BTC mining also generates climate damages per unit price that are an order-of-magnitude above those generated from the mining of precious metals such as gold, copper, PGMs, and REOs, which all average < 10% per unit market value compared to BTC’s 35% average over 2016–2021. For the specific case of gold, which is considered by some to be an important store of value and a hedge against volatility in stocks, bonds, and the US dollar47, BTC’s climate damages are a relative outlier. As a share of gold’s market price, its climate damages average 4%; BTC’s 2016–2021 average climate damages are 8.75 times greater.
Given the high share of climate damages to BTC market price, we ask: “What utilization share of renewable electricity sources would make BTC production similar in climate damage impact to more sustainable commodities?” Our results suggest that if the share of renewable electricity sources for 2016–2021 increased from 38.5 to 88.4% (with additional 5.2% from nuclear)—a 129% increase—the climate damages as a share of coin price for BTC would drop from 35 to 4.0%; similar in magnitude to the climate damages of solar power or gold.
Absent such an extreme increase in the share of renewable electricity used in mining, BTC’s climate damages will remain an outlier compared to more sustainable commodities. Thus, BTC mining presently fails our third sustainability criterion that “estimated climate damages per coin mined should favorably compare to some reference percentage benchmark of the climate damages per unit market value of other sectors and commodities.” Though not as climate damaging as coal electricity generation, BTC mining generates similar damages as gasoline, natural gas generation and beef production, as a share of market prices; none of which would generally be considered sustainable48,49.

