

Ethereum Classic (CRYPTO: ETC) was trading more than 4% higher on Wednesday in a relief bounce propelled by Bitcoin (CRYPTO: BTC) and Ethereum (CRYPTO: ETH), which were trading up over 2% and 4%, respectively, on Wednesday afternoon.
The cryptocurrency sector has been in turmoil since Nov. 10 when Bitcoin and Ethereum reached new all-time highs of $69,000 and $4,867.81, respectively, before entering into long-term downtrends. Comparatively, Ethereum Classic has been weaker than the apex cryptocurrencies, unable to make any meaningful recovering back toward its May 6, 2021, all-time high of $175.
Ethereum Classic could be in for a larger reversal to the upside if the crypto is able to buck a trendline that has been holding it down since Nov. 11 and on Wednesday, the Ethereum Classic was attempting to make the break.
The Ethereum Classic Chart: The descending trendline is most likely a recognized pattern for the algorithms and bots programmed to trade the crypto because it has tested the line as resistance 16 times previously and rejected. A trendline is considered to be valid when it acts as support or resistance at least three separate times on a given time period.
On Wednesday, Ethereum Classic looked to be in the process of printing a bullish Marubozu candlestick on the daily chart while trying to break up from the trendline. The crypto may need higher volume to come in order to complete that task because as of the late afternoon, Ethereum Classic’s trading volume was measuring in at about 77,784 compared to the 10-day average of 96,423.
Traders can watch for the level of volume on lower timeframes to increase if Ethereum Classic breaks up from the trendline although bullish momentum will be needed following the break to help the crypto make a trend change. Currently, Ethereum Classic is still trading in a confirmed downtrend with the most recent lower low printed on Monday at $27.31 and the most recent lower high created at $35.91 on Jan. 2.
Wednesday’s bullish price action has caused Ethereum Classic to regain the eight-day exponential moving average (EMA) as support, which is bullish but the eight-day EMA is still trending below the 21-day EMA, which is a bearish indicator. The crypto is also trading about 17% below the 50-day simple moving average, which indicates longer-term sentiment is bearish.
Want direct analysis? Find me in the BZ Pro lounge! Click here for a free trial.
- Bulls want to see big bullish volume push Ethereum Classic up through the descending trendline and then for the crypto to pop up above the 21-day EMA and make a higher high. There is resistance above at $32.17 and $36.82.
- Bears want to see Ethereum Classic to continue to reject the trendline and for it to push the crypto down further until losing support at 27.67, which would cause Ethereum Classic to print another lower low. Below the level, there is support at $20.45 and $15.27.
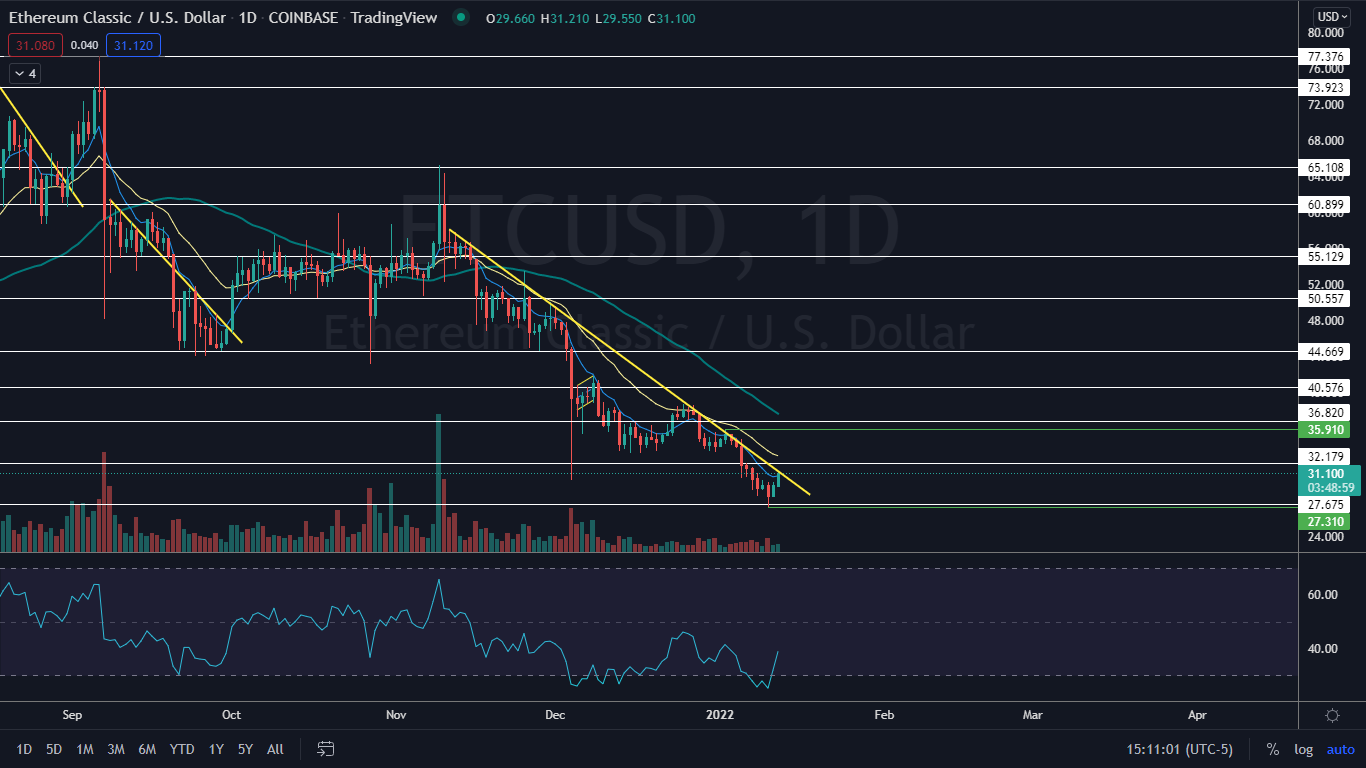
Photo by Myriam Zilles on Unsplash


