

- The Pi Cycle Top indicator predicted ETH’s market bottom to be $3,285.
- Metrics revealed that buying pressure on the token was rising.
Latest data revealed that Ethereum [ETH] had underperformed since the beginning of this bull market. However, the trend has changed over the last week as the king of altcoin has showcased promising performance.
Ethereum’s volatility shot up
Matrixport, an all-in-one crypto financial services provider, recently posted a tweet highlighting an interesting development. As per the tweet, the 30-day realized volatility spread between Ethereum and Bitcoin [BTC] has stayed within a 1.0 to 1.5 ratio.
This indicated that at its peak, Ethereum had been 50% more volatile than Bitcoin. Ethereum has underperformed since the beginning of this bull market. That’s why its increased volatility has made it a less desirable asset to buy.
The tweet also mentioned,
“However, as long as the volatility ratio stays within this range, buying Ethereum volatility at the lower end could present an attractive opportunity.”
Therefore, AMBCrypto checked Glassnode’s data to find out whether metrics also suggested that this was the right time to accumulate ETH. The Pi Cycle top indicator revealed that ETH was trading below its possible market bottom of $3,285.
This suggested that the token’s price might soon gain bullish momentum, allowing it to reach that mark at the least. Notably, the metric also revealed that ETH’s possible market top was $5,378.
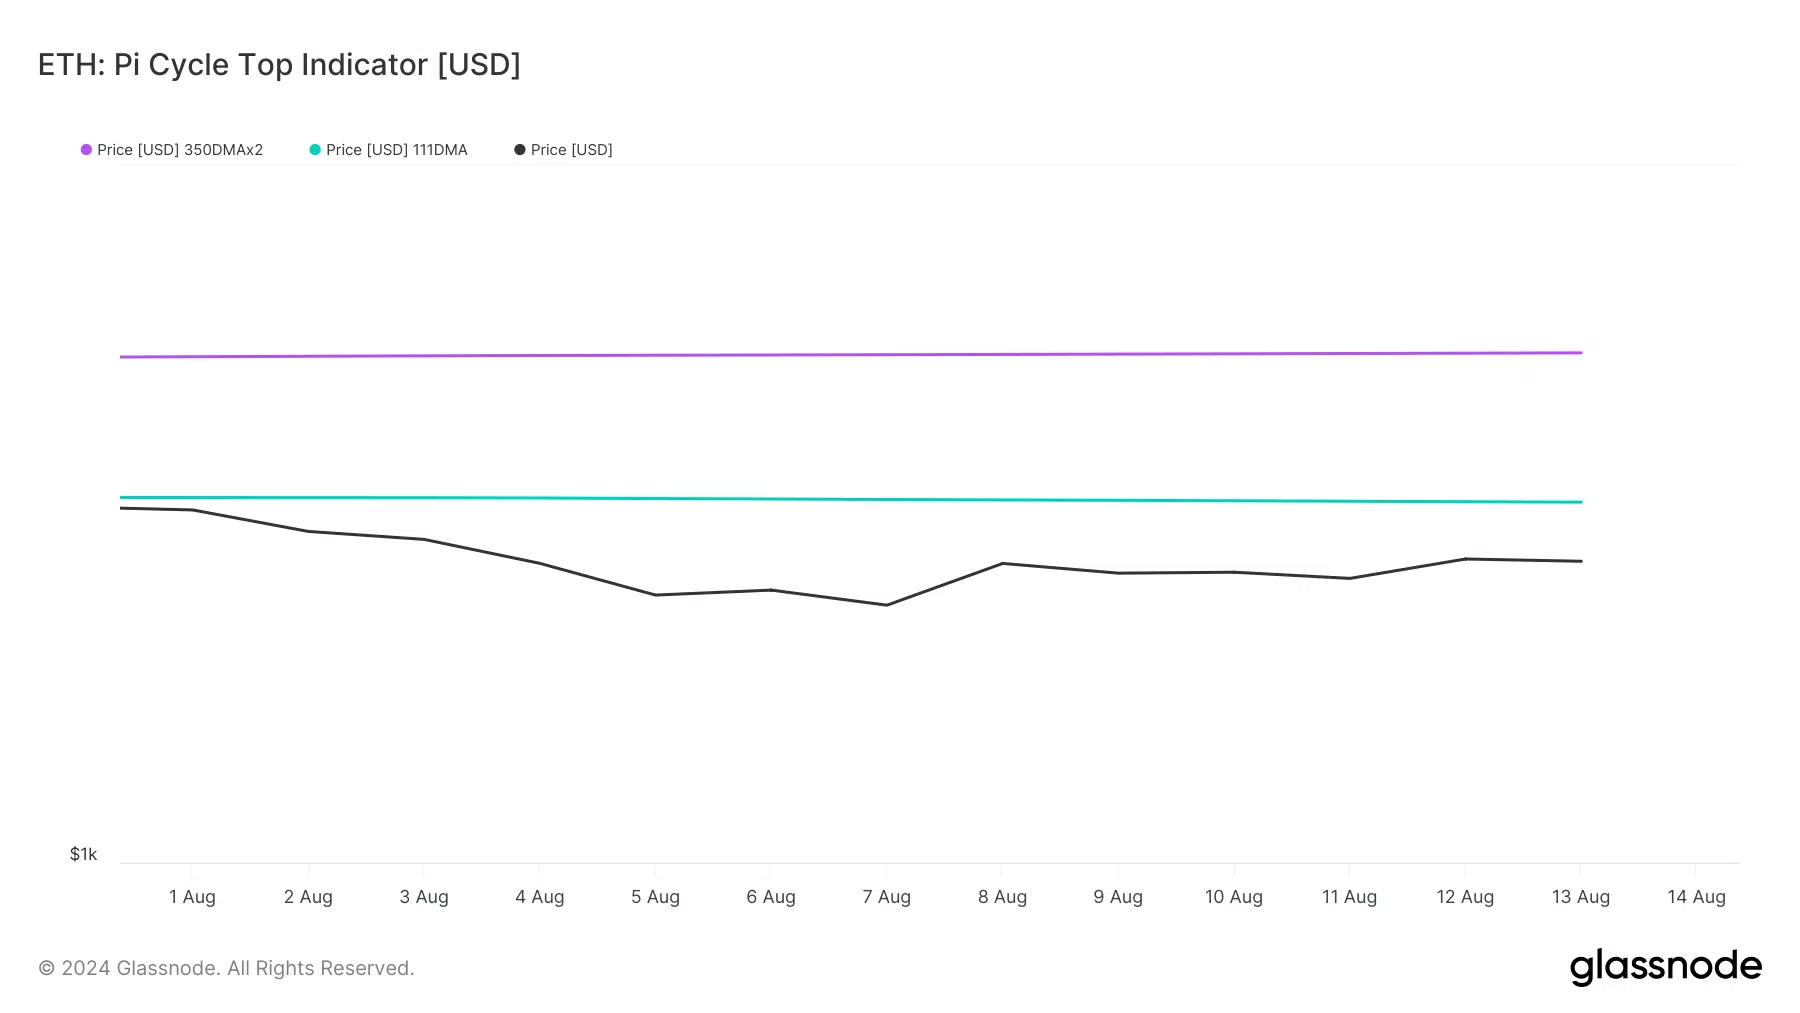
Source: Glassnode
Is buying pressure rising?
Since the aforementioned data revealed that there was an opportunity to accumulate ETH at a lower price, AMBCrypto checked CryptoQuant’s data to find out whether investors have already started to stockpile.
We found that ETH’s exchange reserve was dropping, meaning that buying pressure was on the rise. Additionally, Ethereum’s Coinbase Premium pointed out that buying sentiment was relatively strong among U.S. investors.

Source: CryptoQuant
CoinMarketCap’s data revealed that the bulls have already buckled up, as the token’s price had surged by more than 7% in the last week. At the time of writing, ETH was trading at $2,727.75 with a market capitalization of over $328 billion.
However, at press time, ETH’s fear and greed index was in a “greed” position. Whenever the metric hits that level, it indicates that there are chances of a price drop.
Therefore, AMBCrypto checked ETH’s daily chart to find out whether this newly gained bullish momentum would last.
Read Ethereum (ETH) Price Prediction 2024-25
The technical indicator MACD displayed a bullish crossover. ETH’s Chaikin Money Flow (CMF) registered an uptick. The Relative Strength Index (RSI) also followed a similar path.
These market indicators suggested that ETH bulls might continue to dominate this week.
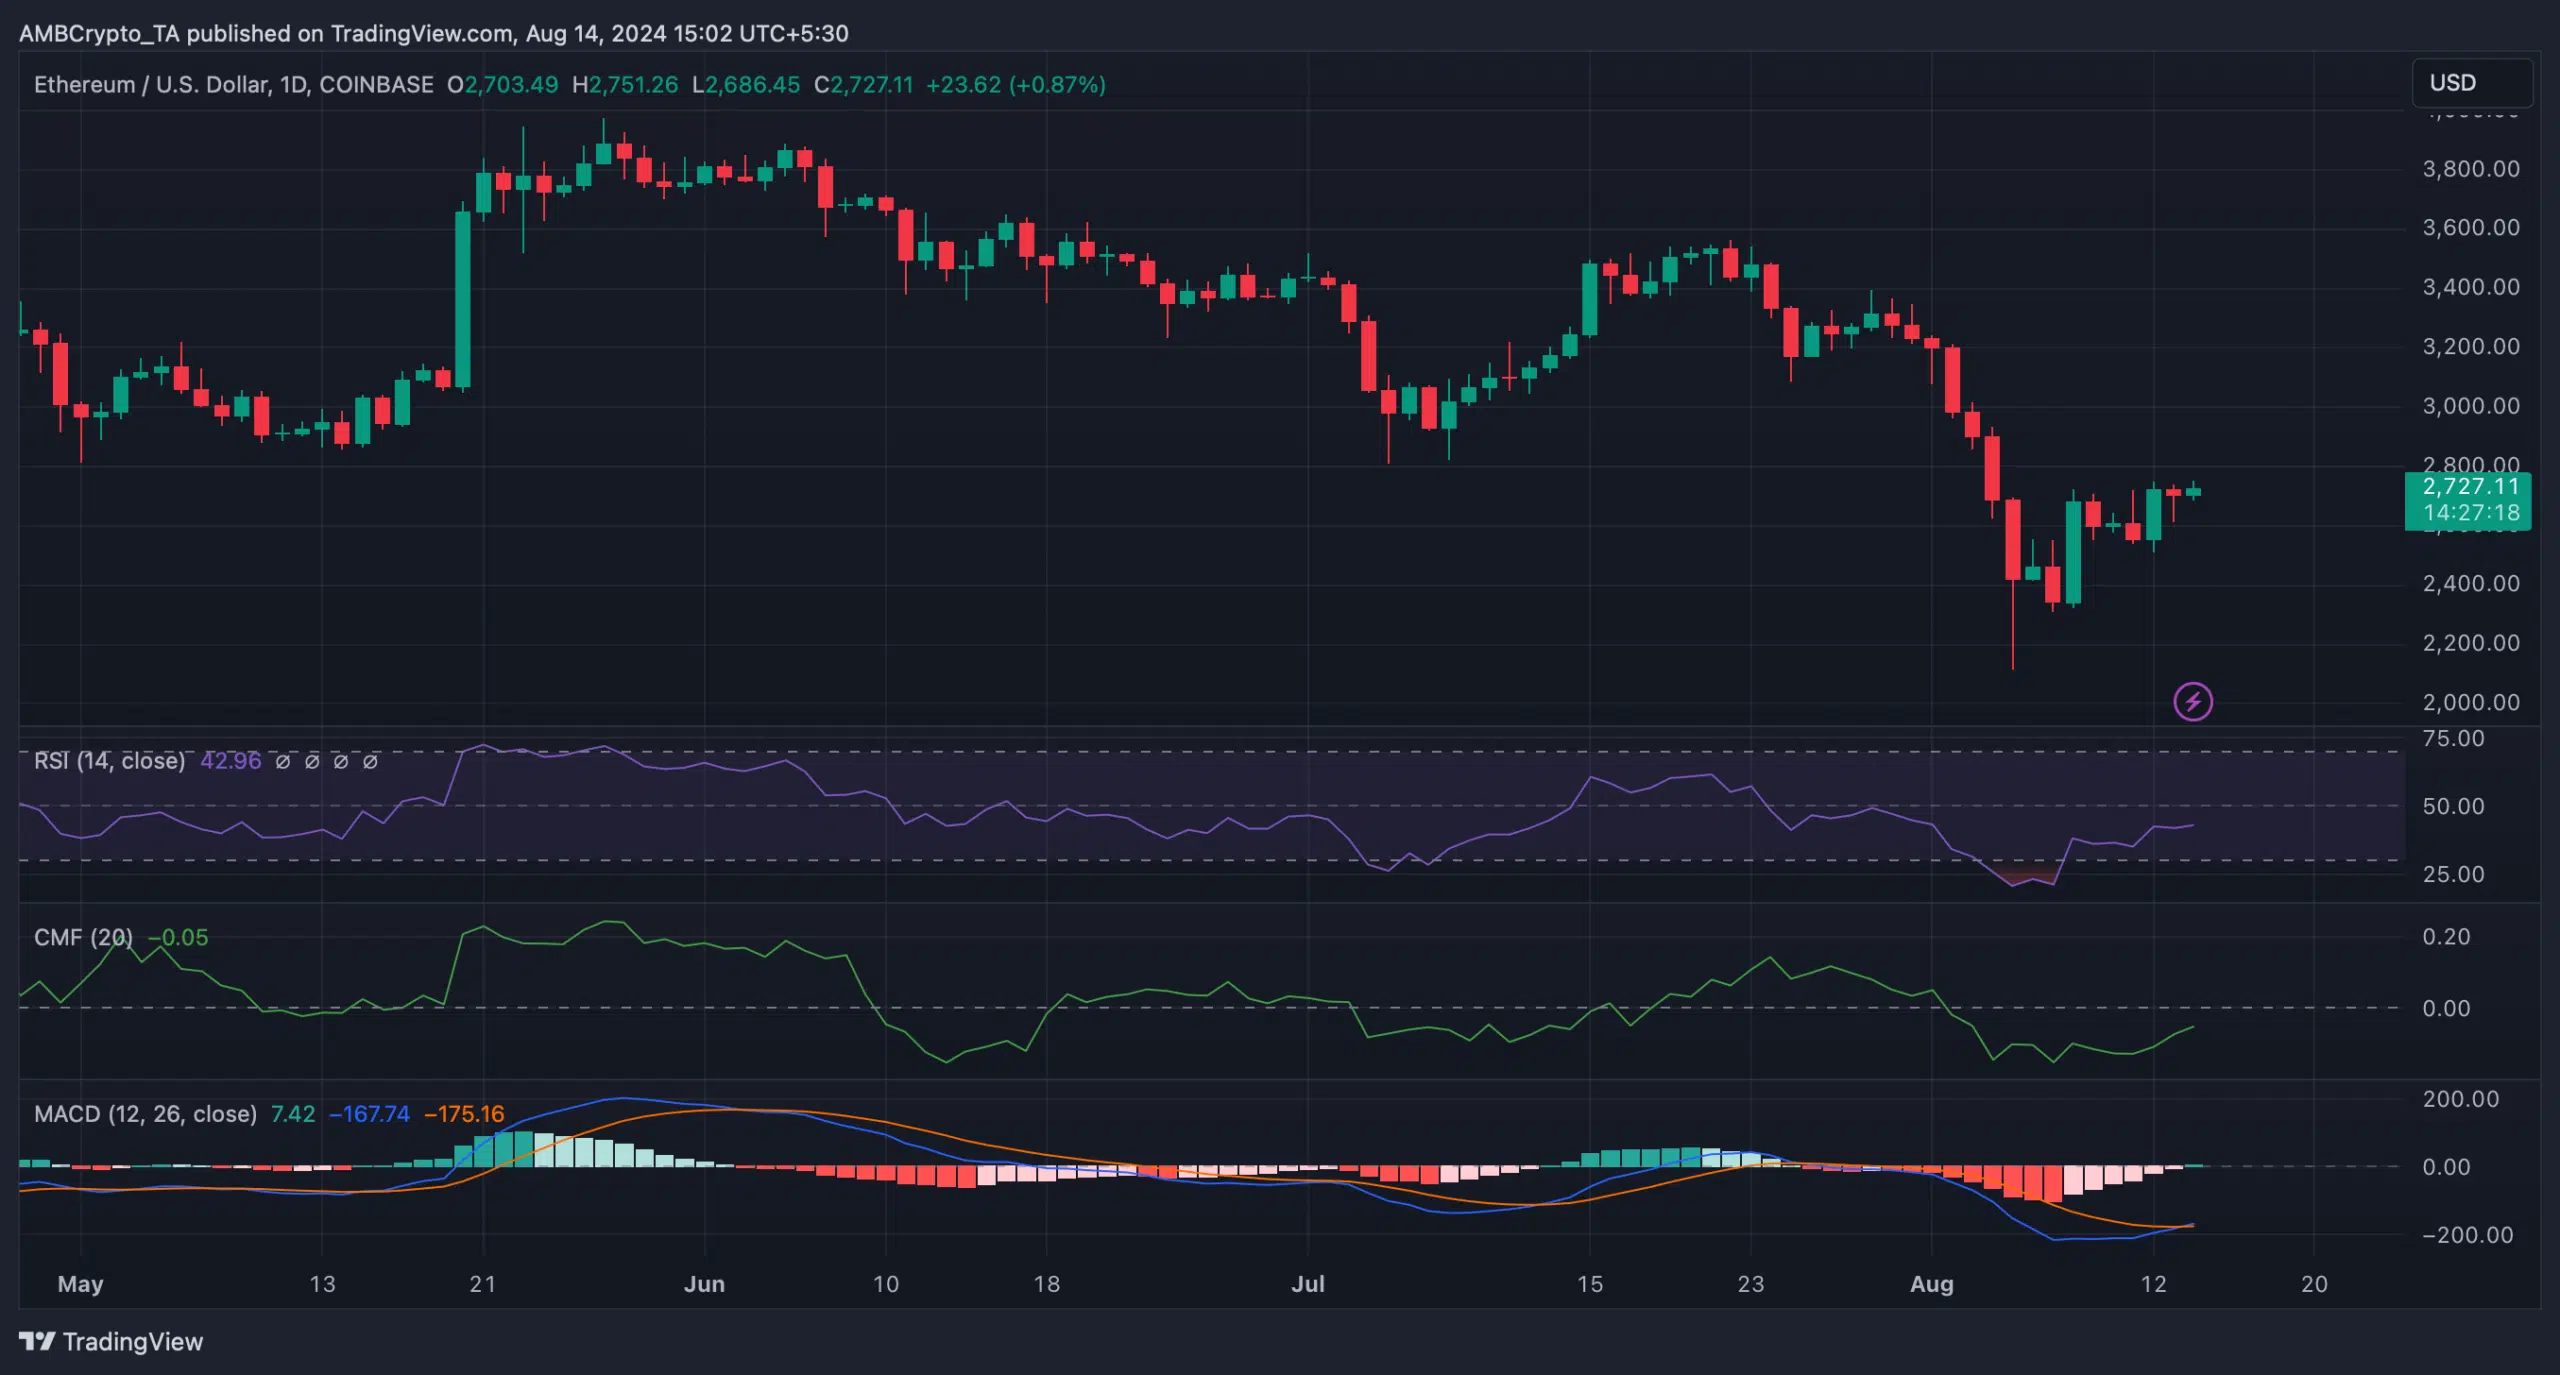
Source: TradingView


