

Amid mixed opinions, prominent market analyst Sam Price has identified key market macro signals that indicate that the bull cycle is still on.
In a tweet today, he insisted that several indicators suggest that Bitcoin is closer to the price bottom than it is to the top. As a result, he stated that those not considering leveraging the recent dip to stack the pioneering cryptocurrency are “just not using clear logic.”
Notably, the analysis comes on the back of growing curiosity among market participants if the Bitcoin 2024/2025 bull cycle peaked at $109,000. It also follows a bold assertion from CryptoQuant’s CEO, Ki Young Ju, that the bull market is over.
Analyst Highlights Bullish Indicators
Price highlighted the first metric as the Pi Cycle Indicator, a Phillip Swift-developed tool that has accurately predicted Bitcoin’s top historically. The indicator flashes a top when the 111-day moving average crosses the 350-day moving average x2 (350DMA x2).
An accompanying chart shows that these moving averages are still far from overlapping, with the analyst insisting that Bitcoin is closer to the bottom than its top.

Furthermore, Price stated that Bitcoin’s recent dip correlates with a forming macro higher-low price action, which precedes a strong rebound to higher highs. However, the professional trader noted that a close between $58,000 and $56,000 on the weekly timeframe would invalidate the macro trend.
Hidden Bullish Divergence Shows Uptrend Continuation
Furthermore, the analyst pointed out a hidden bullish divergence on the asset’s weekly timeframe, a strong signal of an uptrend continuation. For perspective, this metric is characterized by the formation of a higher low on the price chart and an oscillator trending in a lower low pattern.
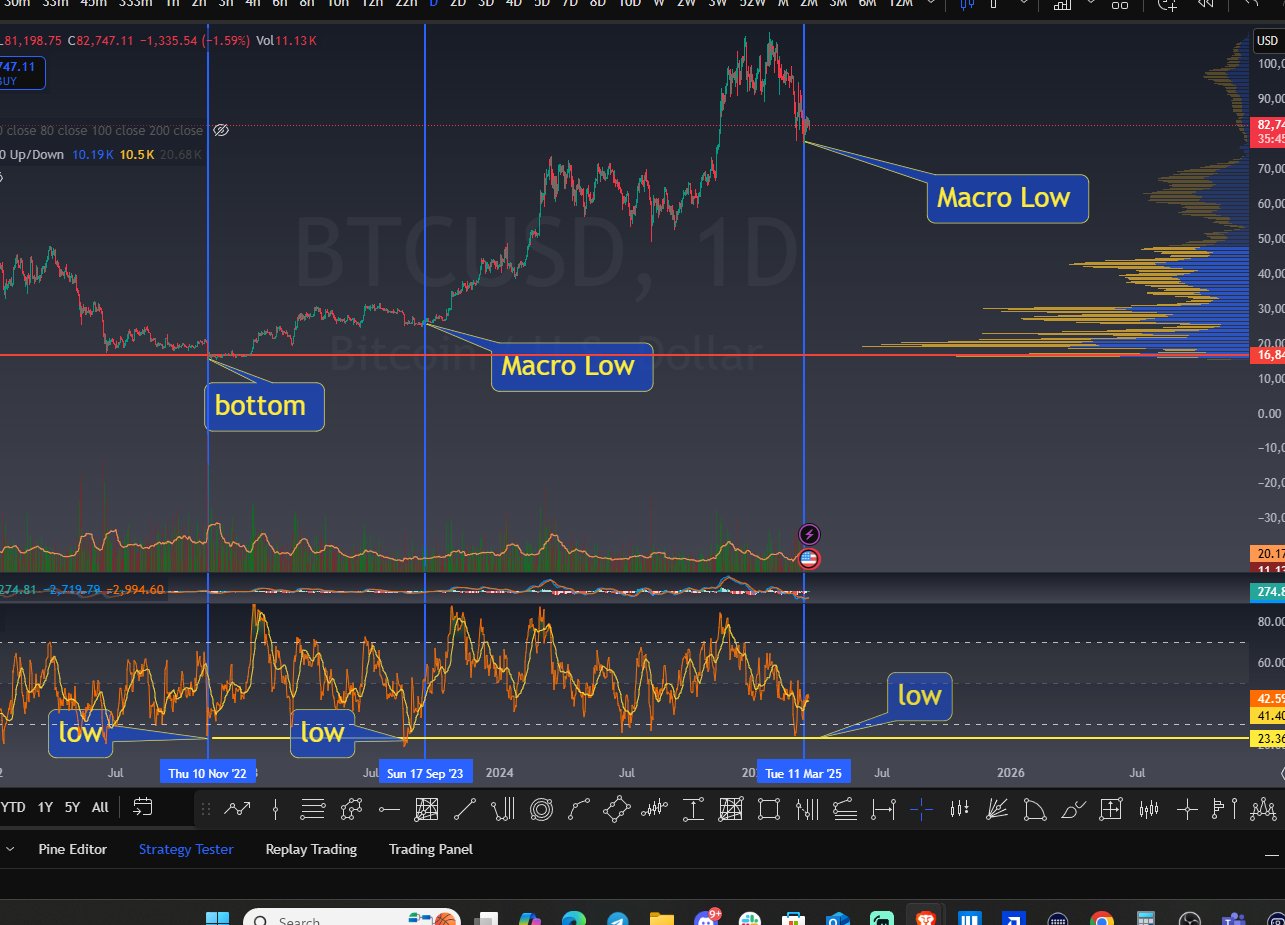
A price chart shows that while Bitcoin formed a higher low with an over 23% correction from its January 20 high, the relative strength index (RSI) has formed a lower low. Moreover, a rebound looks most probable with an oversold Stochastic RSI and the premier asset’s trend close to the Golden Pocket at the 1.618 Fibonacci level.

RSI and FGI Indicate Imminent Rebound
Meanwhile, Price identified another bullish indicator: the daily RSI. He shared that the metric hit 23 on March 11, a low last seen only twice in the previous years. Furthermore, each decline to such an oversold level has marked a macro bottom.
For instance, Bitcoin’s RSI dropped to 23 on November 10, 2022, when the asset corrected to a low of $15,854. The oscillator hit the number again on September 7, 2023, at around $25,639. Notably, each marked a price low for Bitcoin, which surged extensively to new highs.
Additionally, Price cited Bitcoin’s Fear and Greed Index (FGI) drop to 10 on February 27 as a sign of a price bottom. The analyst maintained that the indicator and others mentioned earlier were strong signals for investors to dollar-cost average (DCA) their Bitcoin positions.
In the meantime, Bitcoin trades at $83,548, rebounding slightly from yesterday’s flush. Notably, analyst Ali Martinez highlighted that the leading cryptocurrency must reclaim $93,700 to keep the bull season alive.
DisClamier: This content is informational and should not be considered financial advice. The views expressed in this article may include the author’s personal opinions and do not reflect The Crypto Basic opinion. Readers are encouraged to do thorough research before making any investment decisions. The Crypto Basic is not responsible for any financial losses.


