

As Bitcoin (BTC) struggles to reclaim the $60,000 psychological level, the on-chain data provider CryptoQuant has highlighted five key charts that illustrate the recent price drop.
The crypto markets are in turmoil, leaving traders on edge as Bitcoin’s price sends mixed signals. Analysts are divided on whether the market is heading for a correction or set to continue its uptrend.
Five Charts to Explain the Latest Bitcoin Price Drop
Bitcoin has slipped below the critical $60,000 psychological level, extending its decline after a recent surge above $65,000. A closer look at the underlying fundamentals reveals intriguing dynamics as traders and investors navigate the market conditions.
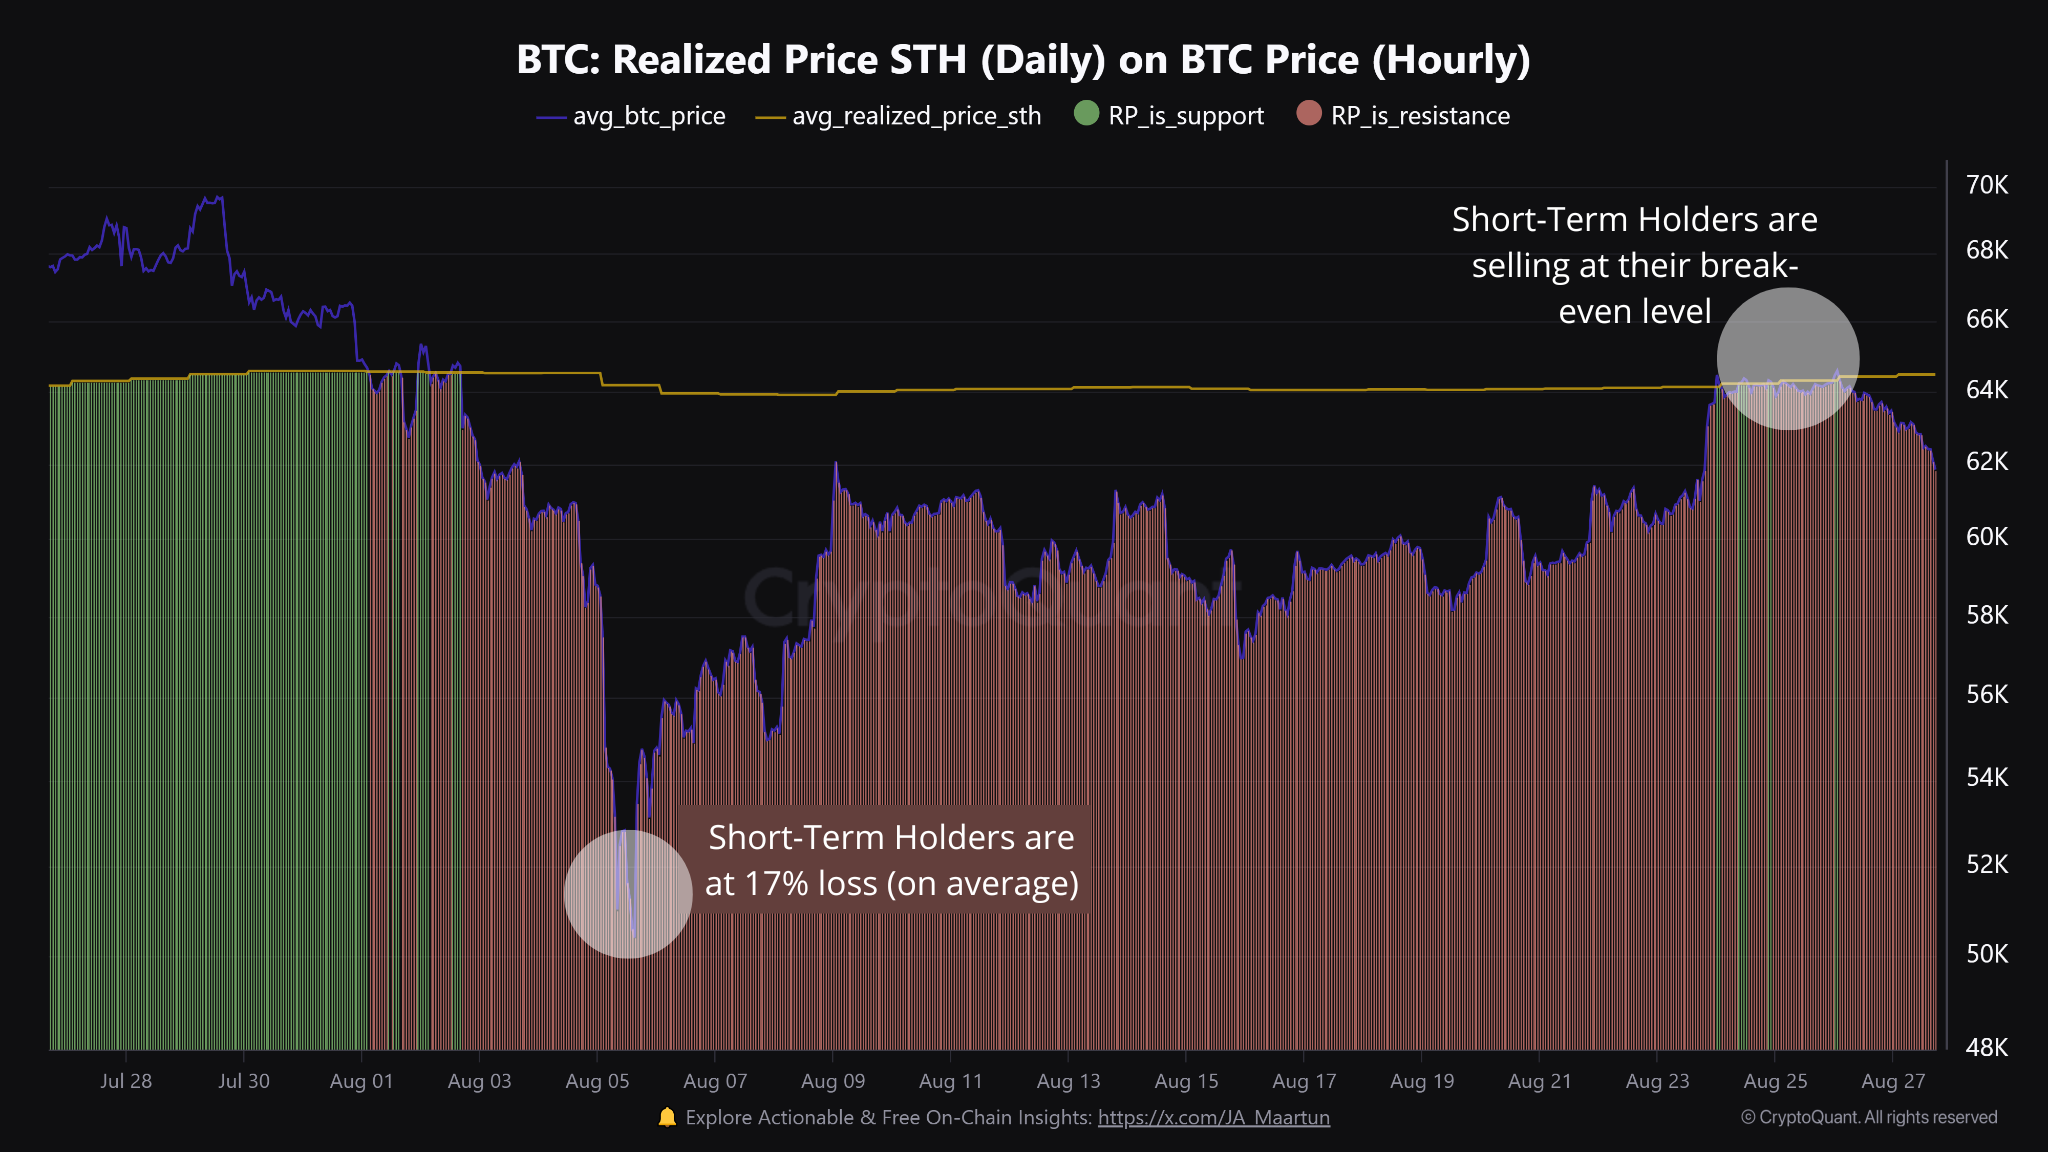
Short-term Holders Cash in at Break-Even
According to CryptoQuant, Bitcoin short-term holders established a resistance wall at their break-even price, indicating they took profits. The break-even price is where traders neither gain nor lose, with the asset trading near their purchase price.
This strategic profit-taking followed Bitcoin’s earlier price drop, which had caused short-term holders to incur a 17% loss. When the price rebounded to their average cost basis, these holders sold around their break-even prices. The resulting selling pressure contributed to the latest price drop.
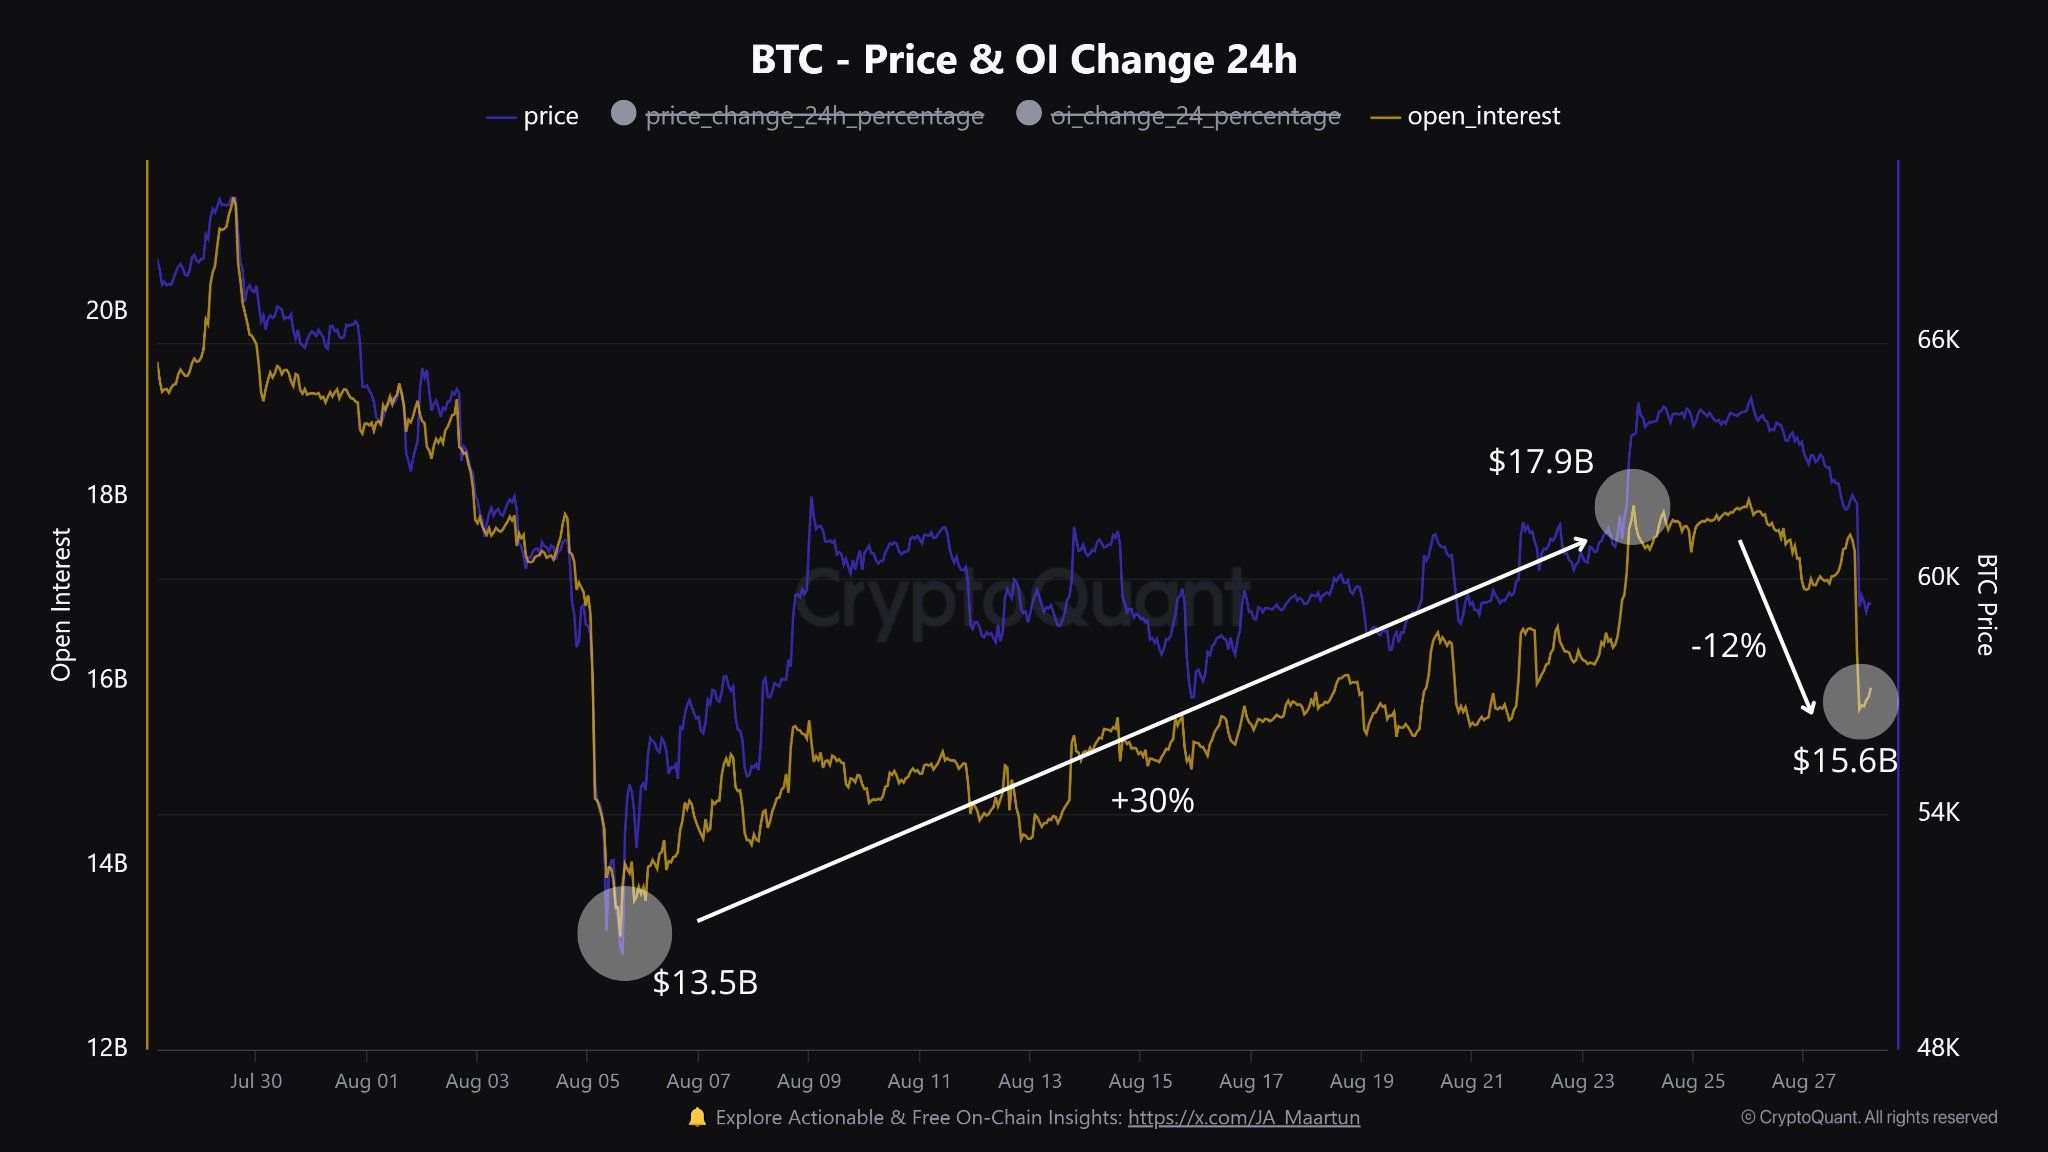
Increased Open Interest and Positive Funding Rates
CryptoQuant also reports a premium on Bitcoin perpetual contracts, with open interest rising by 31% since August 5, moving from $13.5 billion to $17.9 billion. Open interest represents the total number of open positions, reflecting futures traders’ predictions about the next market move.
In a liquid market, high open interest typically results in better execution prices, tighter bid-ask spreads, and reduced slippage, providing traders with enhanced market efficiency and easier entry and exit opportunities. The 31% increase in open interest suggests growing market participation and heightened interest in Bitcoin.
Read more: Where To Trade Bitcoin Futures: A Comprehensive Guide
At the same time, funding rates remained positive, indicating that long positions (buyers) were paying short positions (sellers) to maintain their positions. This scenario reflects market conditions where demand exceeds supply.
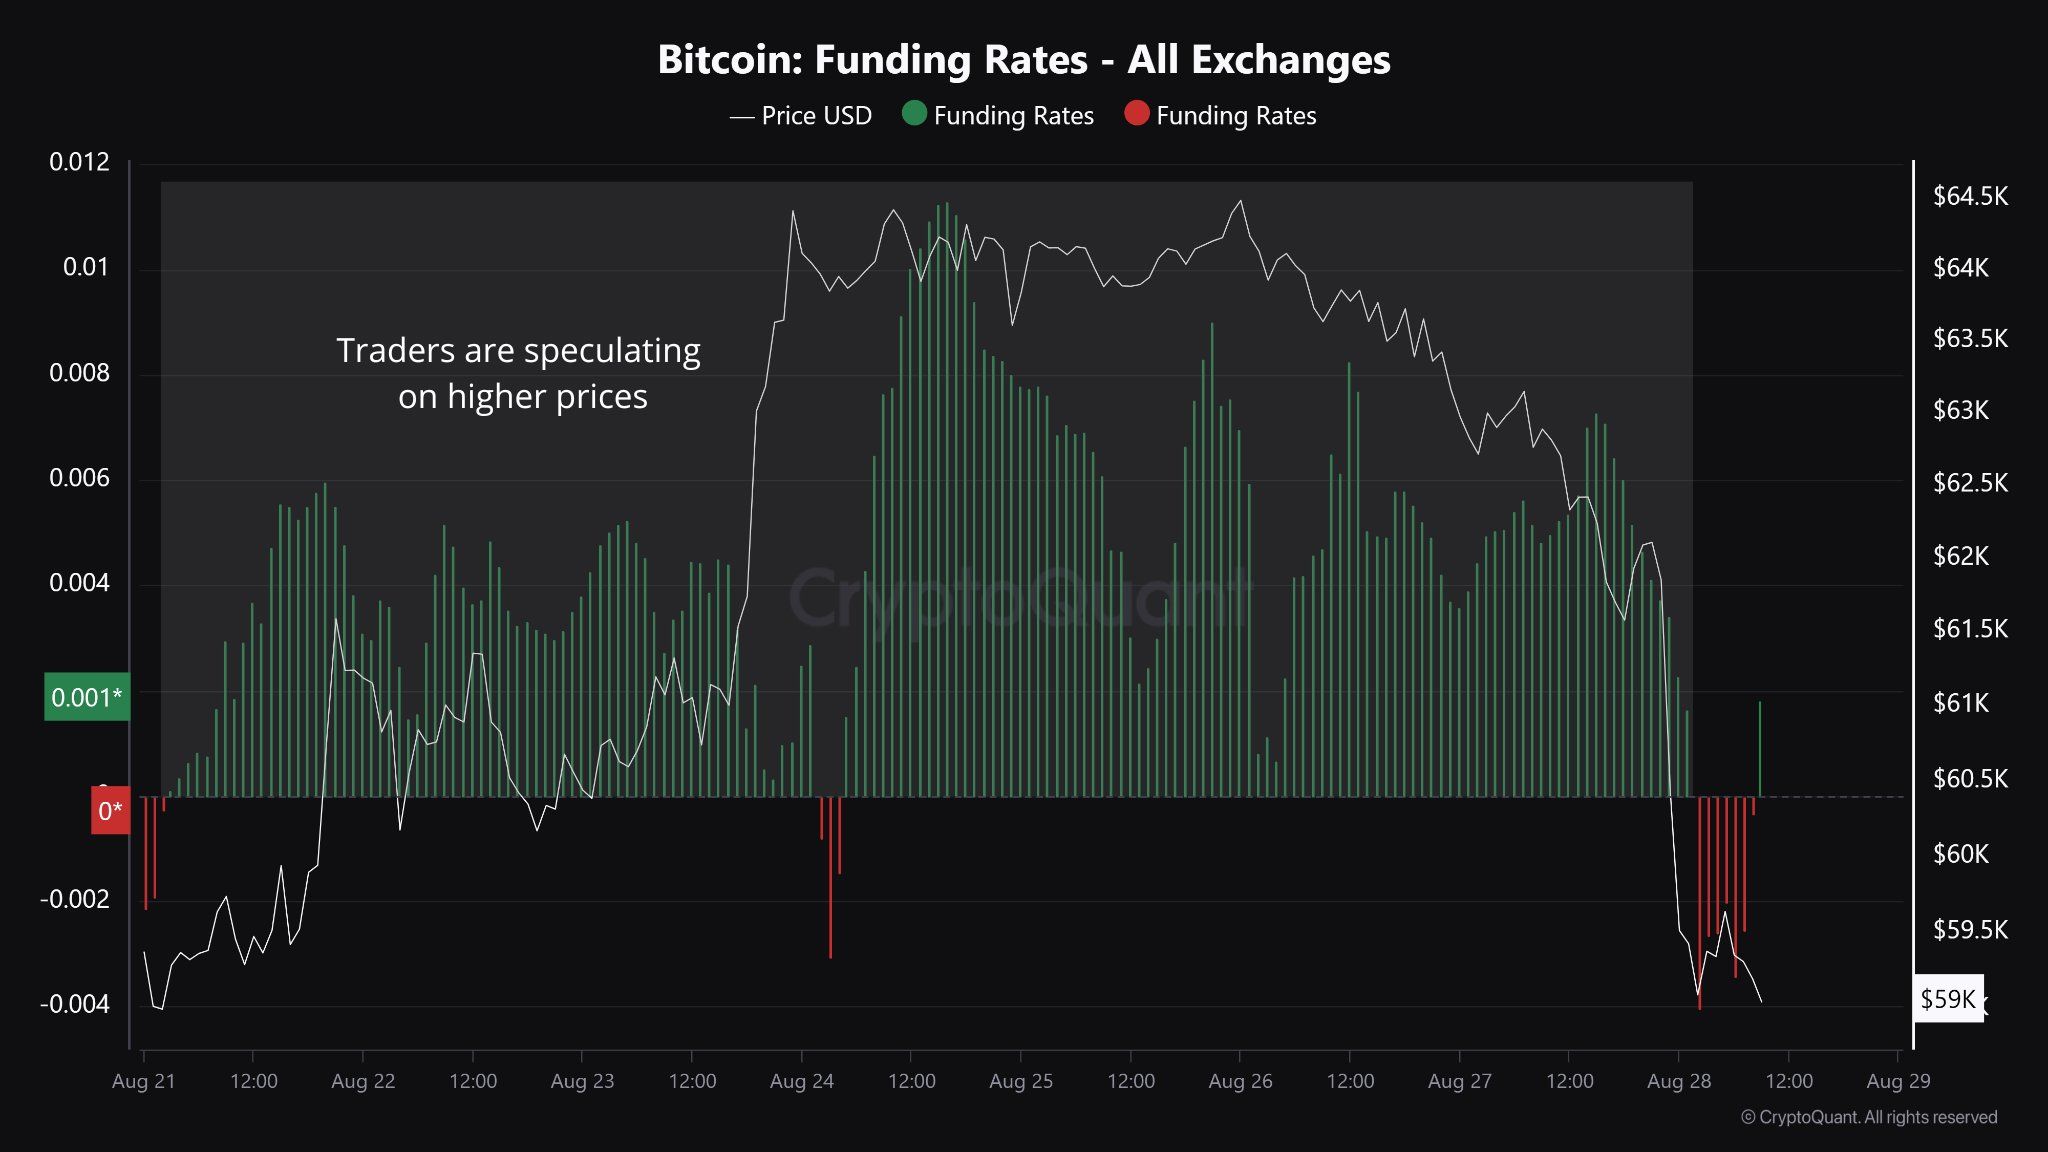
The combination of rising open interest and positive funding rates can destabilize traders’ positions, primarily due to increased speculative activity. As more participants enter and exit positions in an attempt to capitalize on potential price movements, volatility escalates, causing sudden shifts in market sentiment.
This dynamic can create a feedback loop, where growing market participation fuels further price movements. As a result, herd behavior and momentum trading amplify market trends, making it increasingly difficult to predict and manage risks effectively.
Increased Spot Inflows
Research indicates that increased Bitcoin inflows into spot exchanges during the price drop further contributed to the decline, as traders viewed it as a sign of impending selling pressure. When investors transfer their holdings to exchanges, it is often seen as an intent to sell.
This influx added strain to already fragile futures positions. According to CryptoQuant’s Head of Research, Julio Moreno, these inflows were attributed to large holders, amplifying the pressure on the market.
Read more: Bitcoin (BTC) Price Prediction 2024/2025/2030
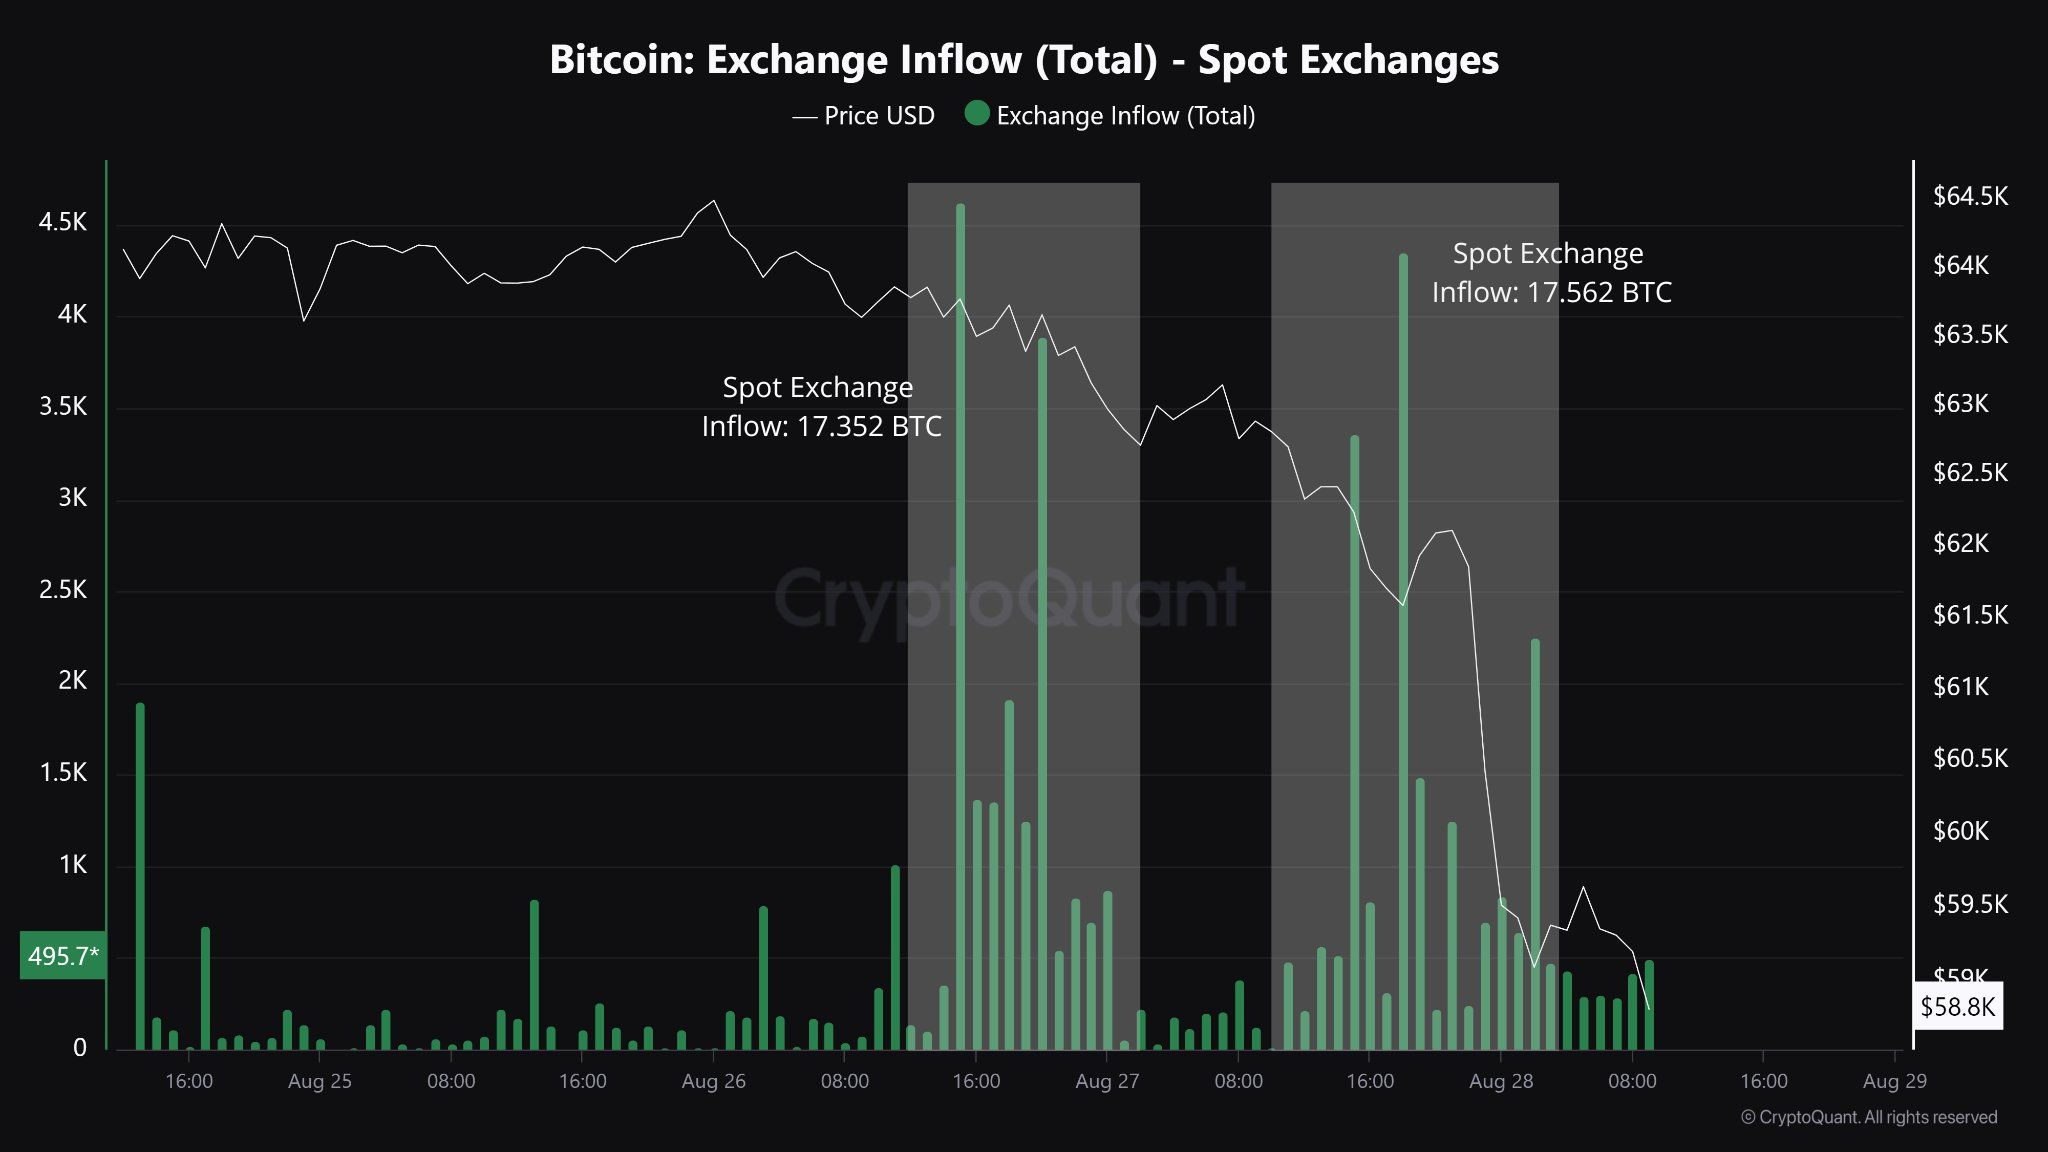
As shown in the chart above, the rise in spot exchange inflows coincided with price drops, reinforcing the thesis.
This increase in Bitcoin supply available for trading on exchanges means more sellers are offering their BTC for sale. When supply outpaces demand from buyers, it exerts downward pressure on the price, contributing to the decline.
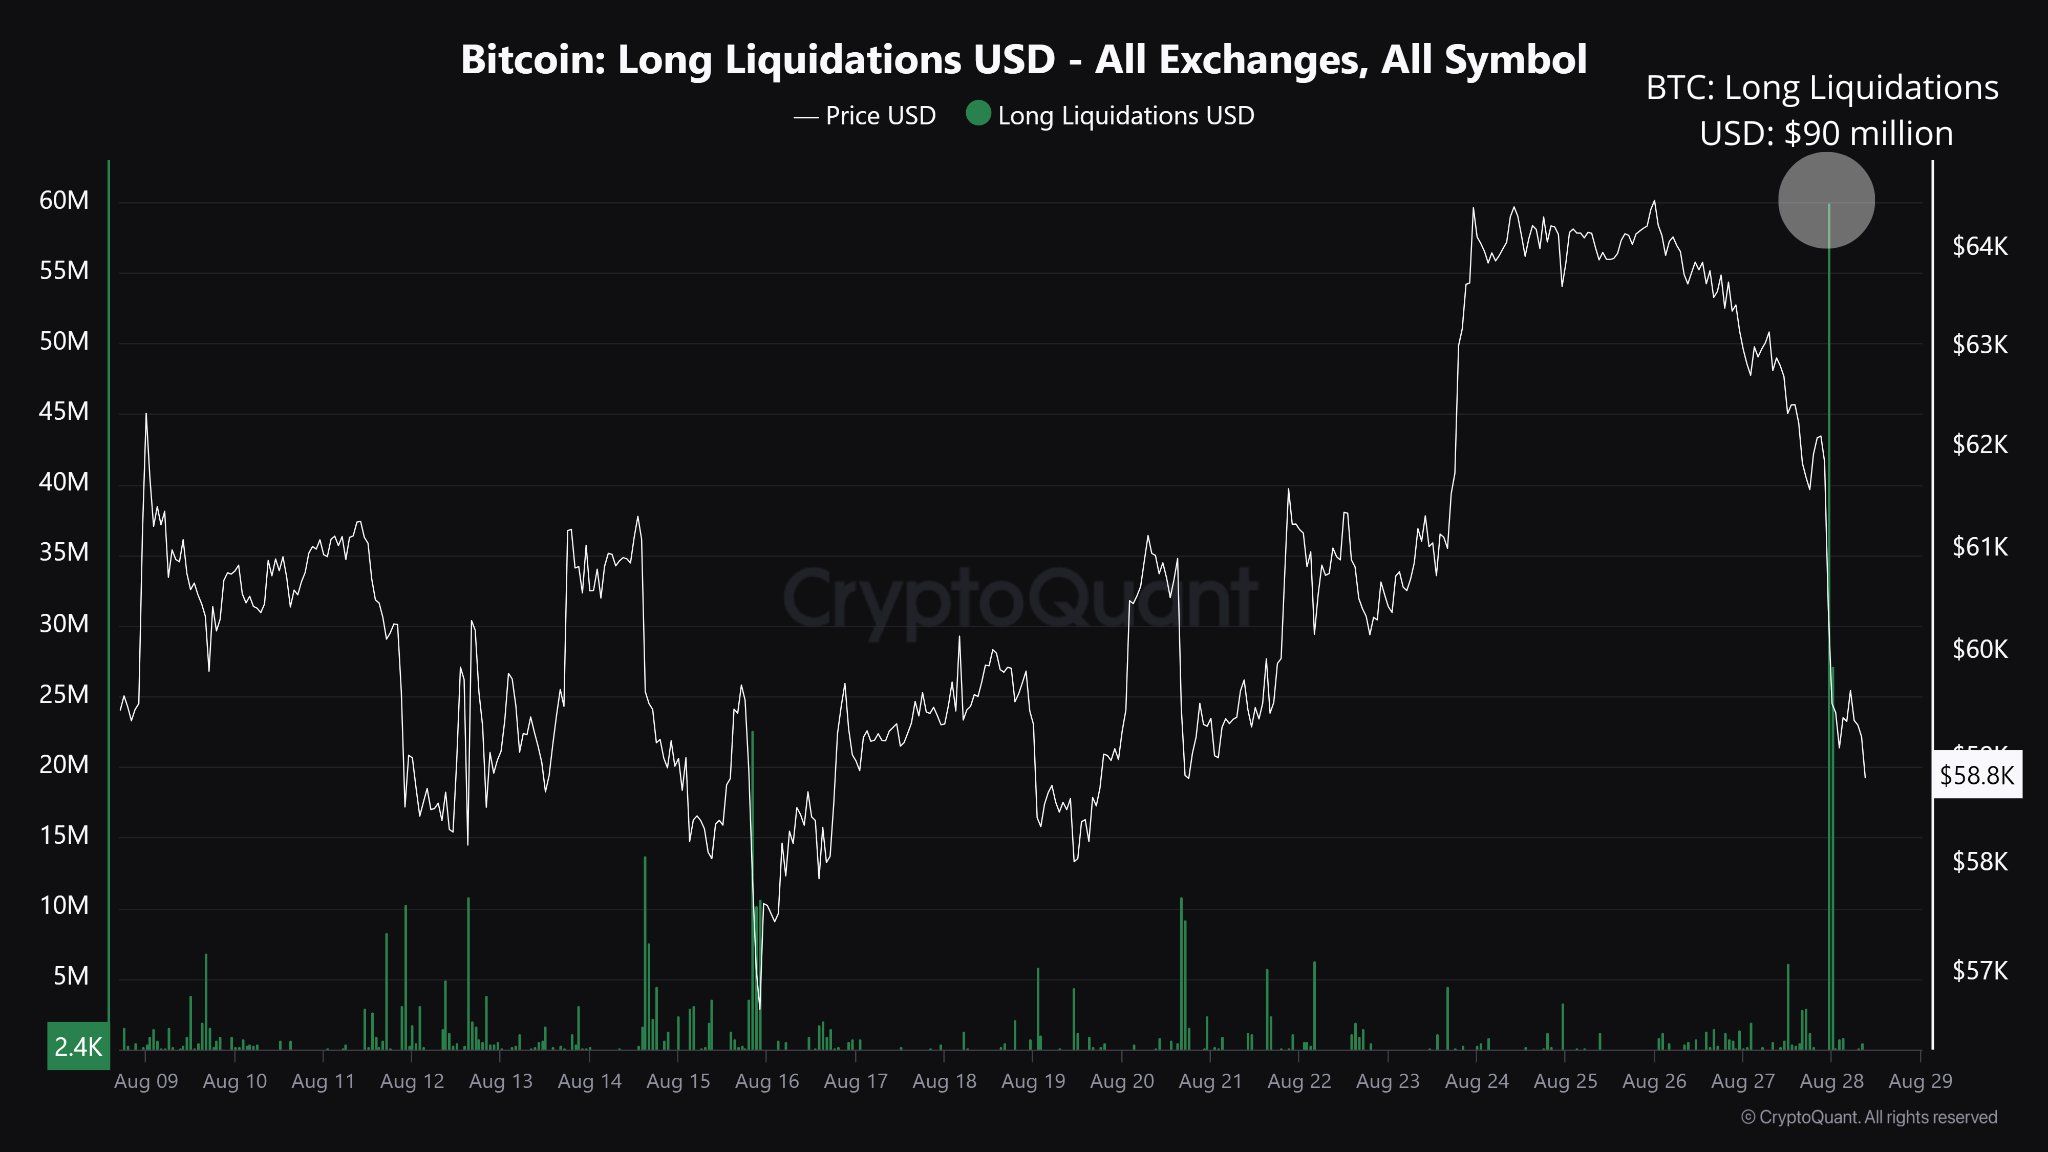
Shaking Off Weak Hands
The series of events has led to “weak hands” exiting their positions, resulting in increased liquidations. Ethereum and Bitcoin longs were liquidated for $55 million and $90 million, respectively, marking the highest levels of liquidation since August 5, according to research.
CryptoQuant’s research suggests that the market will need time to stabilize before a clear directional bias can emerge. As of this writing, Bitcoin is trading at $59,118, down nearly 5% since the Wednesday session began, according to BeInCrypto data.
Disclaimer
In line with the Trust Project guidelines, this price analysis article is for informational purposes only and should not be considered financial or investment advice. BeInCrypto is committed to accurate, unbiased reporting, but market conditions are subject to change without notice. Always conduct your own research and consult with a professional before making any financial decisions. Please note that our Terms and Conditions, Privacy Policy, and Disclaimers have been updated.


