

BeInCrypto takes a look at the price movement for the cryptocurrencies that increased the most last week, more specifically from Jan 14 to 21.
Due to the ongoing market correction, only five cryptocurrencies from the top 100 coins ranked by market capitalization had positive rates of increase
These cryptocurrencies are:
- BitTorrent (BTT) : 6.56%
- Theta Fuel (TFUEL) : 4.78%
- Decred (DCR) : 1.99%
- FTX Token (FTT) : 4.15%
- Klaytn (KLAY) : 0.65%
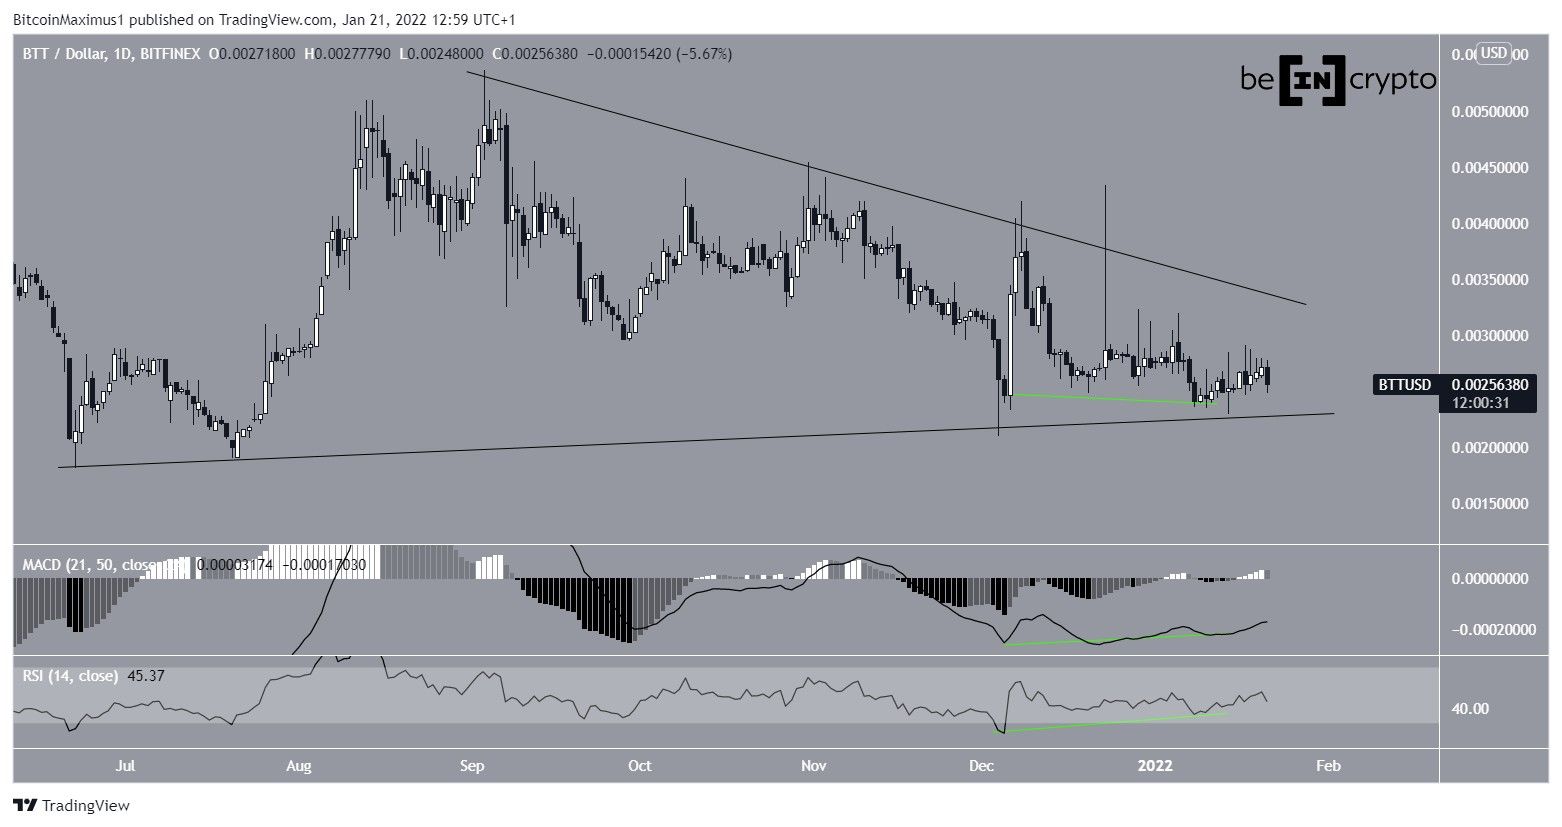
BTT
BTT has been trading inside a symmetrical triangle since June 22. This is a neutral pattern, so both a breakout and a breakdown are likely.
The token is approaching the end of this pattern, at which time a decisive movement would be likely.
Technical indicators are showing some bullish signs, since both the RSI and MACD have generated considerable bullish divergences (green lines). Therefore, a breakout from this pattern seems to be the most likely scenario.
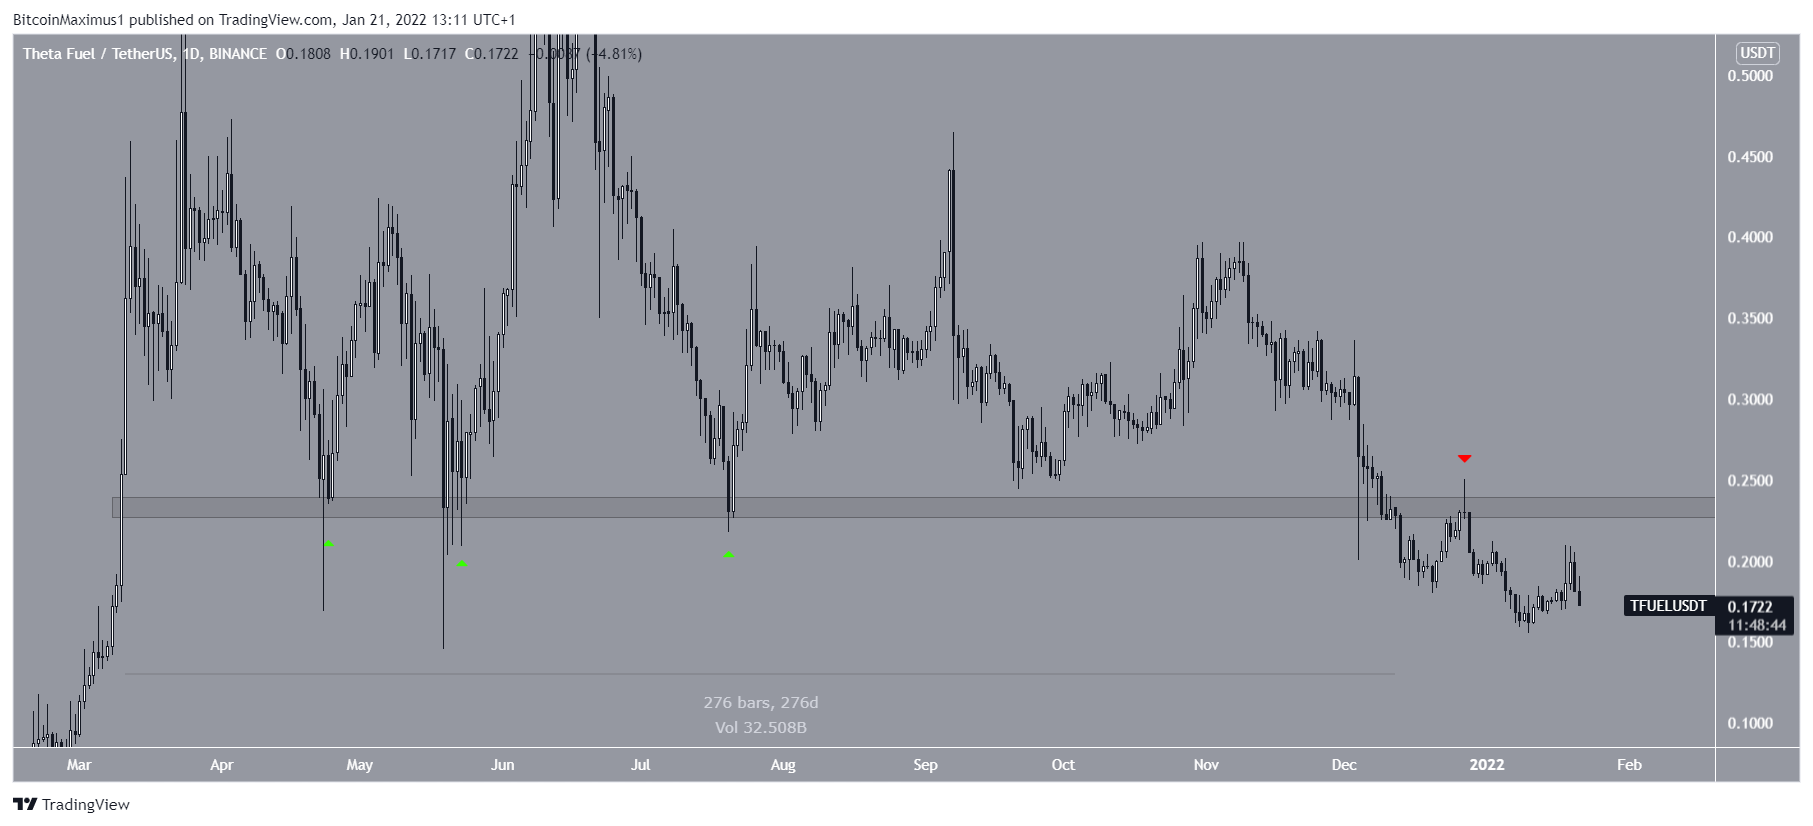
TFUEL
TFUEL had been trading above the $0.23 horizontal area for a period of 276 days beginning on March 8. On Dec 4, it broke down from it and validated it as resistance (red icon) in Dec 27. The token has been moving downwards since.
Due to the fact that the support area had been in place for nearly a year, the trend cannot be considered bullish unless it is reclaimed.
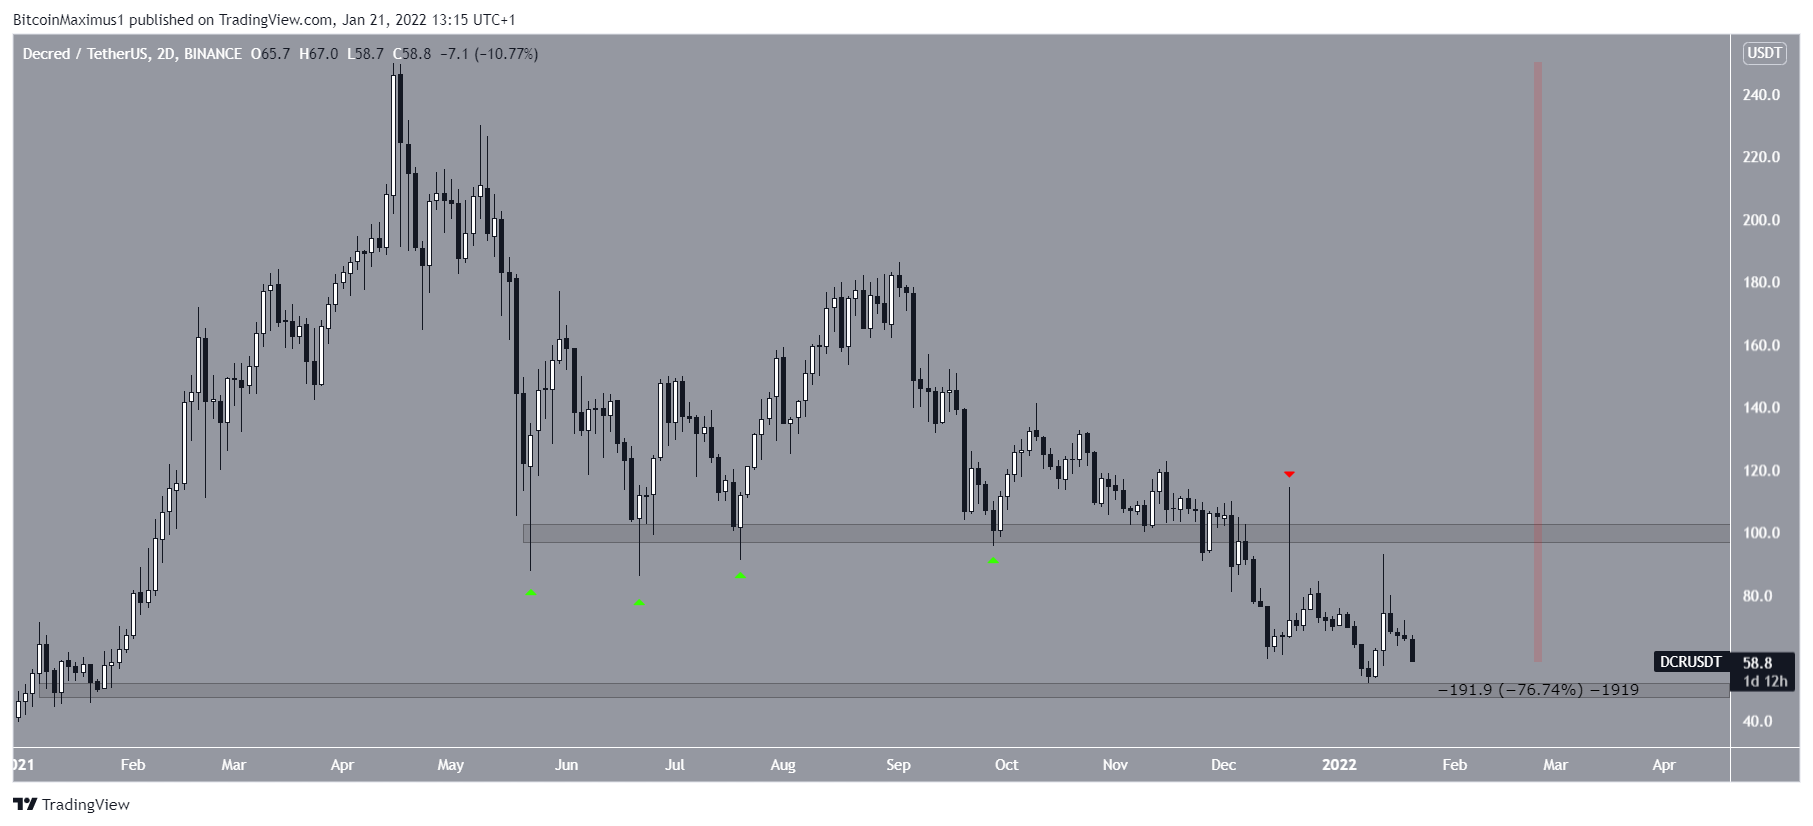
DCR
DCR has been decreasing since reaching an all-time high price of $250 on April 14. While it bounced four times above the $100 horizontal support area, the token broke down on Dec 5 and validated the area as support ten days later (red icon).
The next major support area is at $46. A decisive breakdown below this area could trigger a fall towards the all-time lows near $10.
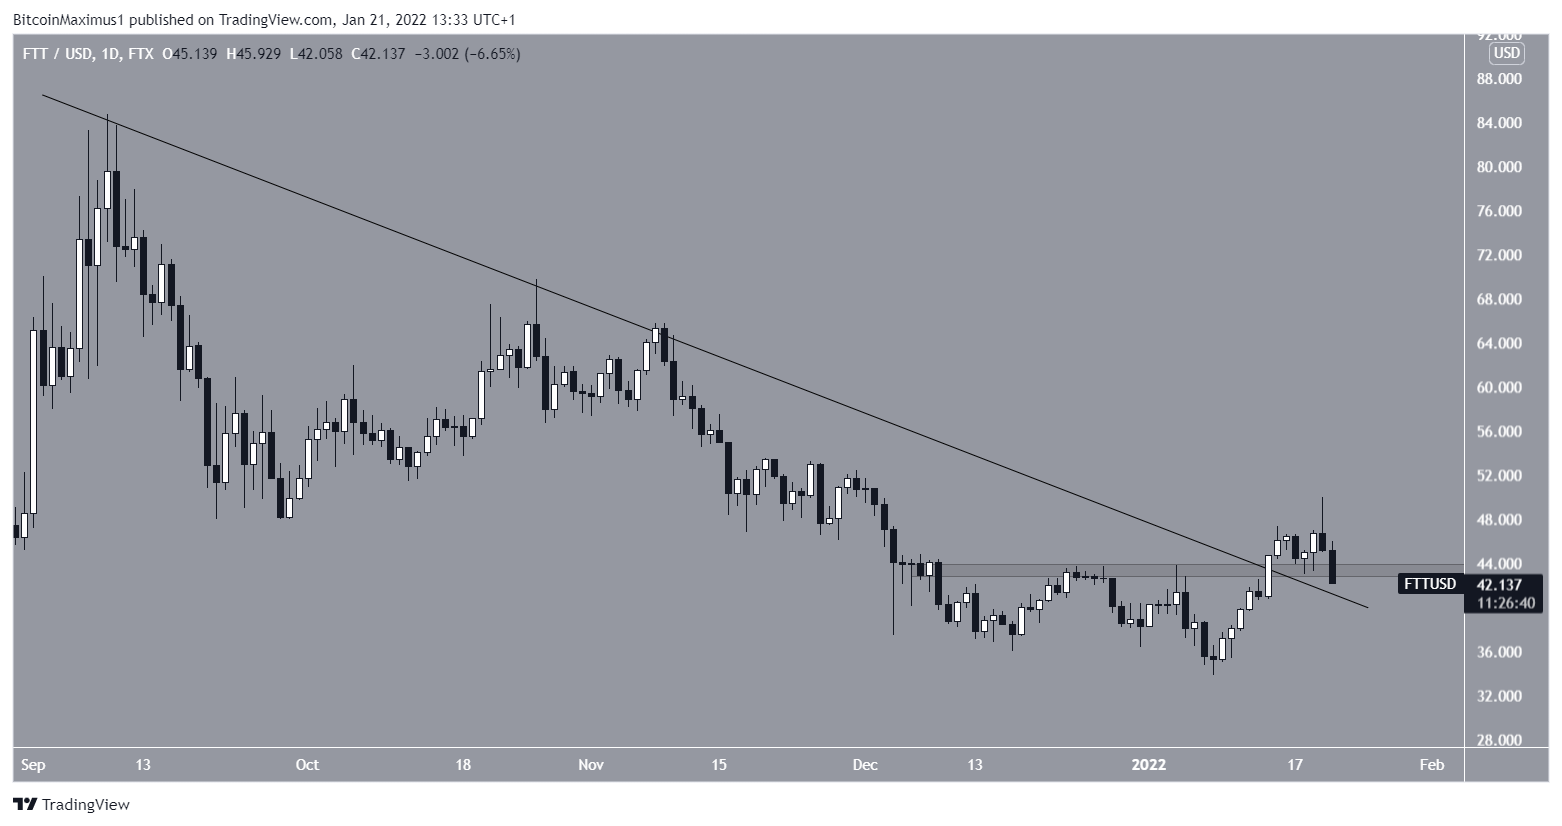
FTT
FTT had been following a descending resistance line since Sept 9. This led to a low of $33.8 on Jan 8. However, the token reversed trend afterwards and has been moving upwards since. On Jan 14, it broke out from the descending resistance line.
While the upward movement was not substantial, FTT is attempting to hold on above the $43.5 area, which previously acted as resistance. If successful, the area would be validated as support. In order for the bullish structure to remain intact, FTT has to hold on above this area.
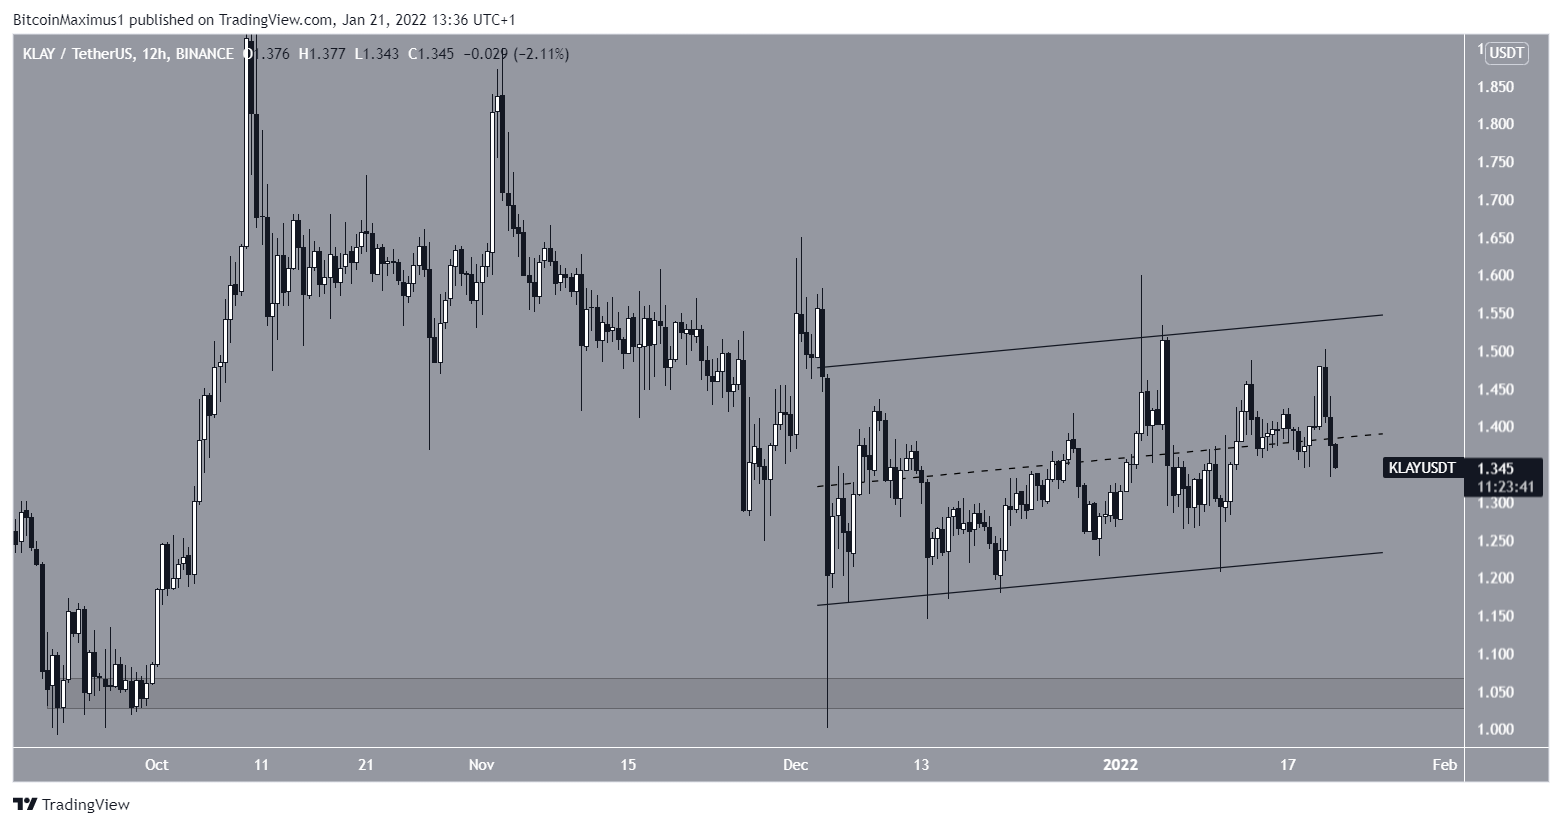
KLAY
KLAY has been increasing inside an ascending parallel channel since Dec 4. Such channels usually contain corrective movements. Therefore, a breakdown from it would be likely.
Furthermore, the token is trading in the lower portion of this channel, supporting the possibility that it will break down.
If it does, the closest support area would be at $1.05.
For BeInCrypto’s latest Bitcoin (BTC) analysis, click here.
Disclaimer
All the information contained on our website is published in good faith and for general information purposes only. Any action the reader takes upon the information found on our website is strictly at their own risk.


