Bitcoin (BTC) price rallied on August 29, bringing Ethereum (ETH) and Ripple (XRP) price with it as crypto markets celebrated Grayscale asset manager’s victory against the US Securities and Exchange Commission (SEC) in the longstanding litigation. The win jumpstarted the market after multi-week consolidation and now eyes are peeled for the US Core PCE Price Index data release on August 31.
Cryptocurrency metrics FAQs
The developer or creator of each cryptocurrency decides on the total number of tokens that can be minted or issued. Only a certain number of these assets can be minted by mining, staking or other mechanisms. This is defined by the algorithm of the underlying blockchain technology. Since its inception, a total of 19,445,656 BTCs have been mined, which is the circulating supply of Bitcoin. On the other hand, circulating supply can also be decreased via actions such as burning tokens, or mistakenly sending assets to addresses of other incompatible blockchains.
Market capitalization is the result of multiplying the circulating supply of a certain asset by the asset’s current market value. For Bitcoin, the market capitalization at the beginning of August 2023 is above $570 billion, which is the result of the more than 19 million BTC in circulation multiplied by the Bitcoin price around $29,600.
Trading volume refers to the total number of tokens for a specific asset that has been transacted or exchanged between buyers and sellers within set trading hours, for example, 24 hours. It is used to gauge market sentiment, this metric combines all volumes on centralized exchanges and decentralized exchanges. Increasing trading volume often denotes the demand for a certain asset as more people are buying and selling the cryptocurrency.
Funding rates are a concept designed to encourage traders to take positions and ensure perpetual contract prices match spot markets. It defines a mechanism by exchanges to ensure that future prices and index prices periodic payments regularly converge. When the funding rate is positive, the price of the perpetual contract is higher than the mark price. This means traders who are bullish and have opened long positions pay traders who are in short positions. On the other hand, a negative funding rate means perpetual prices are below the mark price, and hence traders with short positions pay traders who have opened long positions.
Bitcoin price readies for next move
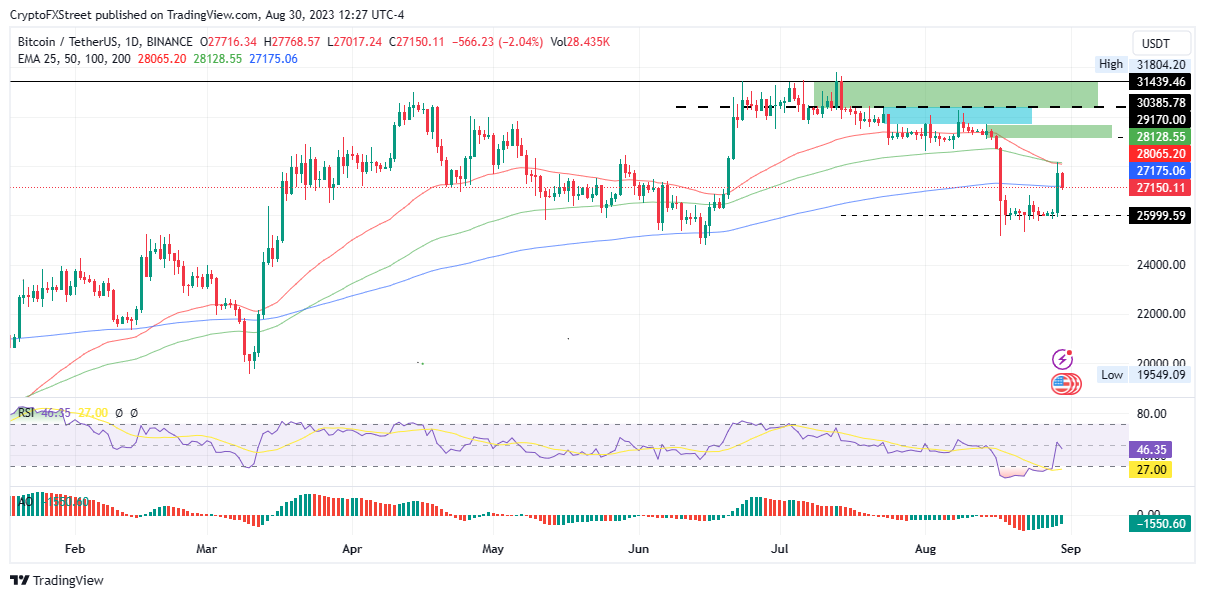
Bitcoin (BTC) price sits on the 200-day Exponential Moving Average (EMA) at $27,175, as book profits for the August 29 surge. The Relative Strength Index (RSI) shows falling momentum and BTC could head lower, potentially revisiting the immediate support at $25,999.
In a dire case, the slump could send Bitcoin price to the psychological $24,000 level, constituting a 10% drop from current levels.
BTC/USDT 1-day chart
However, if sidelined bulls or late buyers come in, Bitcoin price could forge north, shattering the resistance confluence between the 50- and 100-day EMA that rejected the August 29 intra-day high of $28,142. A strong breach above this roadblock would clear the way for BTC to test the supply zone at around $29,170.
If the order block fails to hold as a resistance level and Bitcoin price breaks past it, the psychological $30,000 would be an area of interest, with robust seller momentum expected around the $30,385 an overlay between two supply zones where aggressive selling behavior is expected. For a confirmed uptrend, however, BTC must record a decisive daily candlestick close above $31,439.
Also Read: Spot Bitcoin ETF has a 75% chance of approval in 2023, analysts say
Ethereum price could lose the $1,630 support level
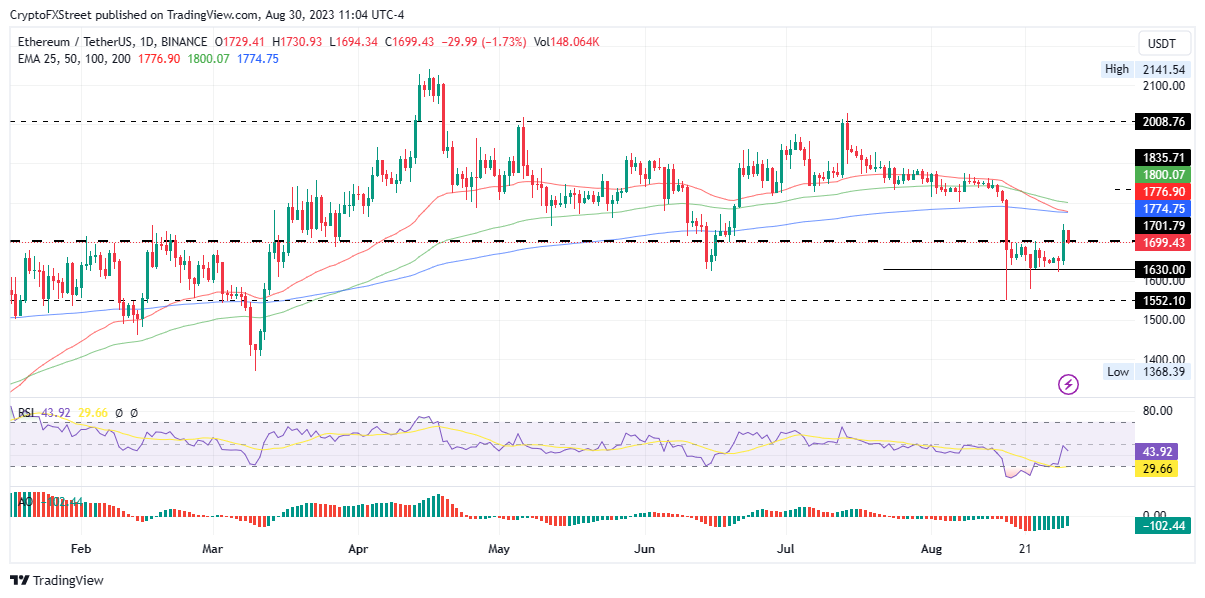
Ethereum (ETH) price rallied almost 7% following the Grayscale announcement, but like BTC, profit taking is already underway. This is indicated by falling buyer momentum as the RSI is falling. If bears continue having their way, ETH could extend south after losing the $1,701 support level. The next support level at $1,630 could provide a subsequent entry point for bulls, but failure could see the proof-of-stake (PoS) token slide lower to potentially find support around $1,552.
ETH/USDT 1-day chart
On the flipside, Ethereum price could extend north if sidelined investors come in. The ensuing buying pressure is likely to send ETH past the resistance confluence between the 200- and 50-day EMA at $1,774 and $1,776 respectively before a confrontation with the 100-day EMA at $1,800.
In the highly bullish case, a foray past the psychological $2,000 is likely, with Ethereum price likely to tag the $2,008 resistance level.
Also Read: Ethereum is eyeing $1500 support with A-B-C drop
Ripple price tethered to 200-day EMA
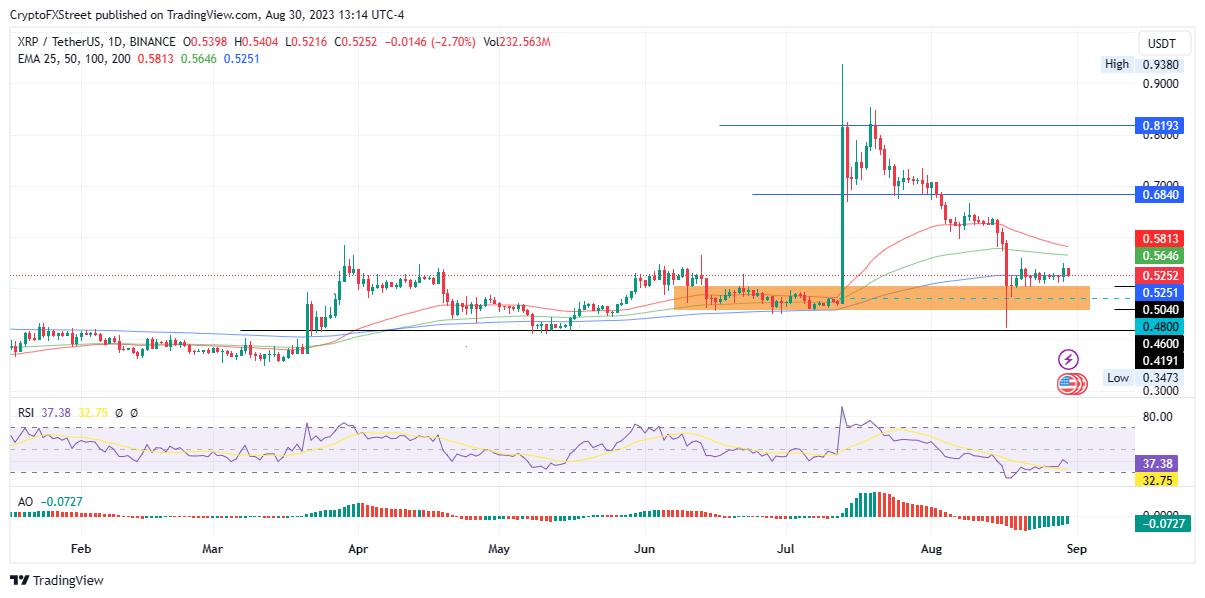
Ripple (XRP) price must break its tether to the 200-day EMA at $ 0.5251 for the next move. The remittance token has been consolidating along this level since August 18. The RSI momentum indicator suggests the price could fall, possibly dipping into the demand zone between $0.5040 and $0.4600. A decisive daily candlestick close below the mean threshold at $0.4800 would increase the odds for a continued downtrend, potentially sending XRP down 10% to $0.4191.
XRP/USDT 1-day chart
Conversely, a move north may see Ripple price breach the 100- and 50-day at $0.5646 and $0.5813 respectively. A sustained uptrend could see XRP confront the $0.6840 level, but in a highly bullish case, the move north could send the payments token to the August 19 highs around $0.8193.
Also Read: XRP price risks decline to $0.41, amidst developments in SEC vs. Ripple lawsuit


