

Hedera Hashgraph (HBAR) has been moving downwards since reaching an all-time high price of $0.583 on Sept 16.
Despite the drop, the token is still trading above horizontal support and following an ascending support line.
Long-term outlook
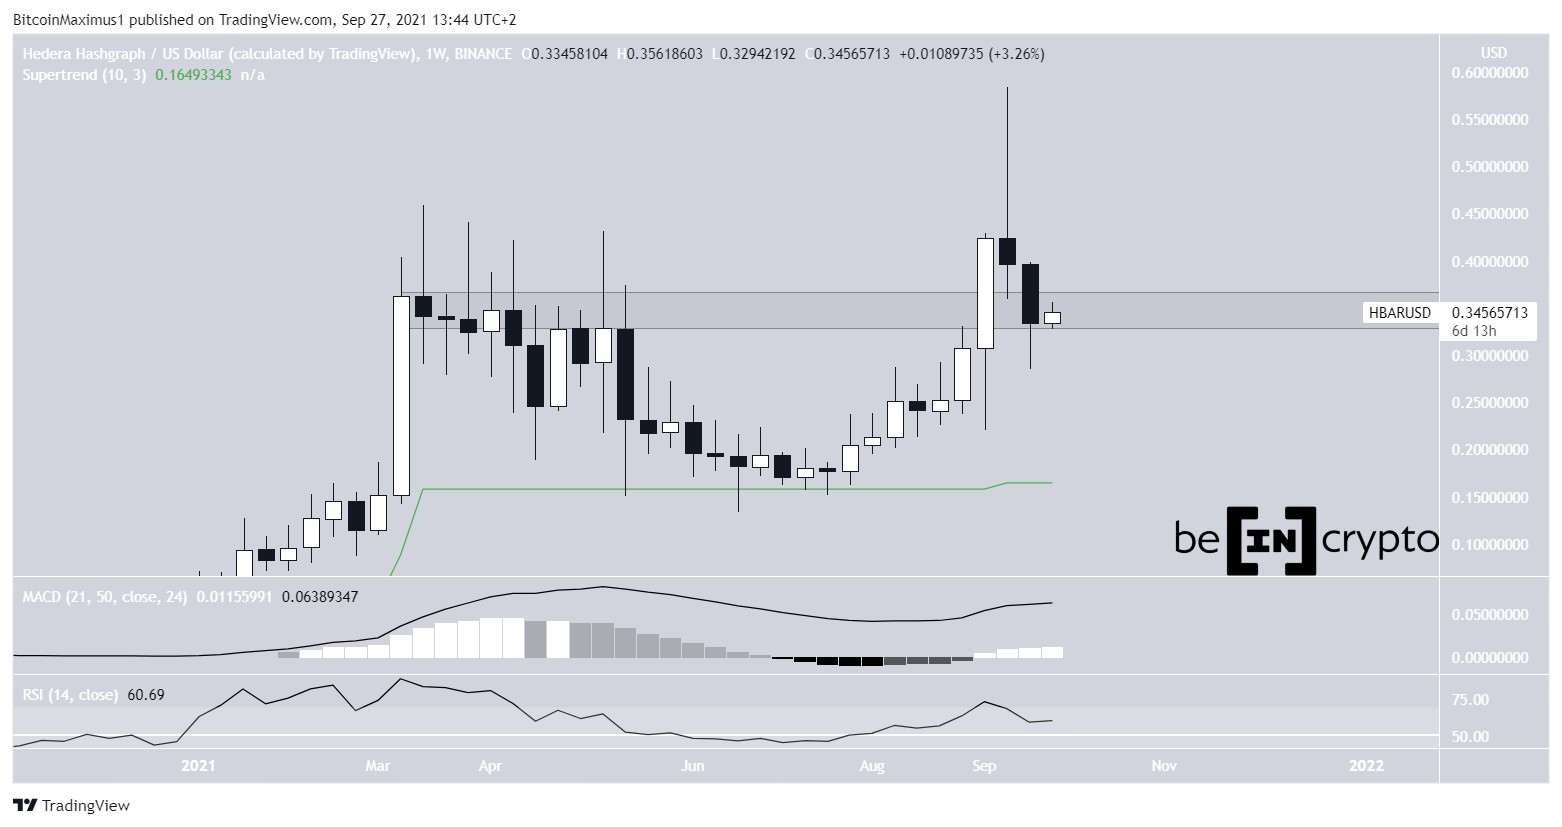
During the week of Sept 13-20, HBAR reached a new all-time high price of $0.583. However, it created a shooting star candlestick the same week and has been moving downwards since.
Despite the drop, the token is still trading above support. While the support area cannot be accurately determined due to the presence of numerous wicks, it is generally around $0.33-$0.38.
Furthermore, technical indicators in the weekly time-frame are still bullish. The MACD and RSI are both increasing, the former being positive while the latter being above 50.

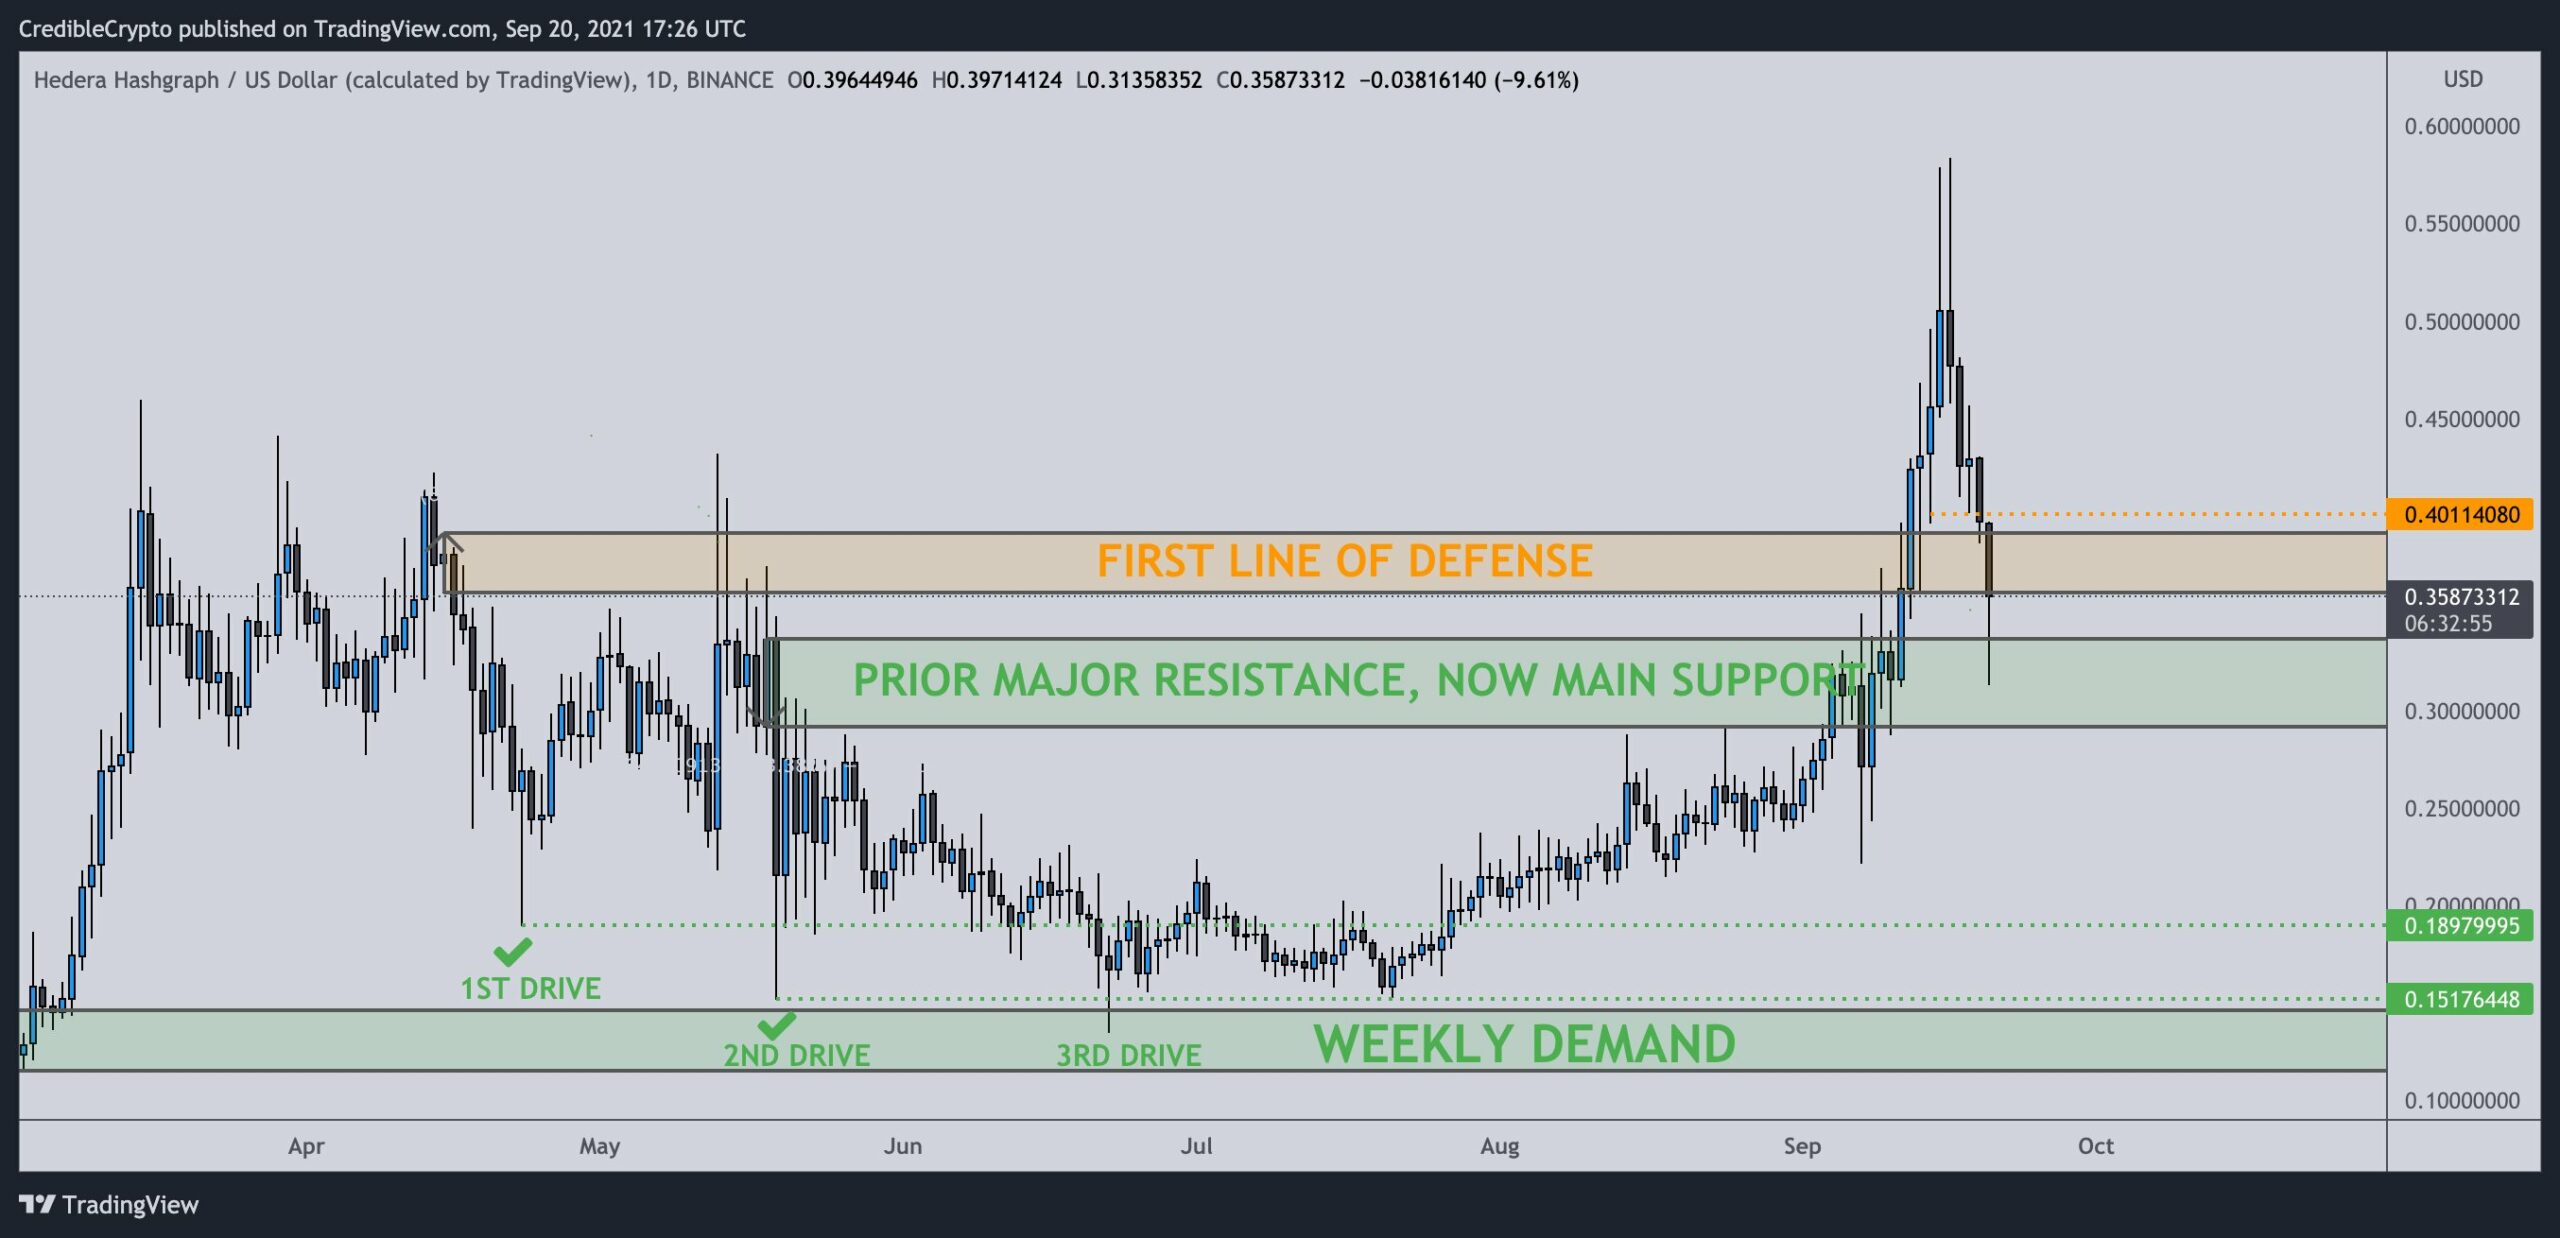
Cryptocurrency trader @CredibleCrypto outlined an HBAR chart, stating that the token is holding on above long-term horizontal support. The area coincides with that which we have outlined.

Future movement
The daily chart also provides a generally bullish picture.
On Aug 27, HBAR broke out from a descending parallel channel that had been in place since the previous all-time high.
Afterwards, it validated it as support (green icon), alongside an ascending support line that has been in place since July 20.
The drop that followed the Sept 16 all-time high took the token back of this ascending support line, which coincided with the 0.618 Fib retracement support level at $0.35.
Therefore, the current level is likely to initiate a bounce, even though the RSI and MACD are neutral.

Wave count
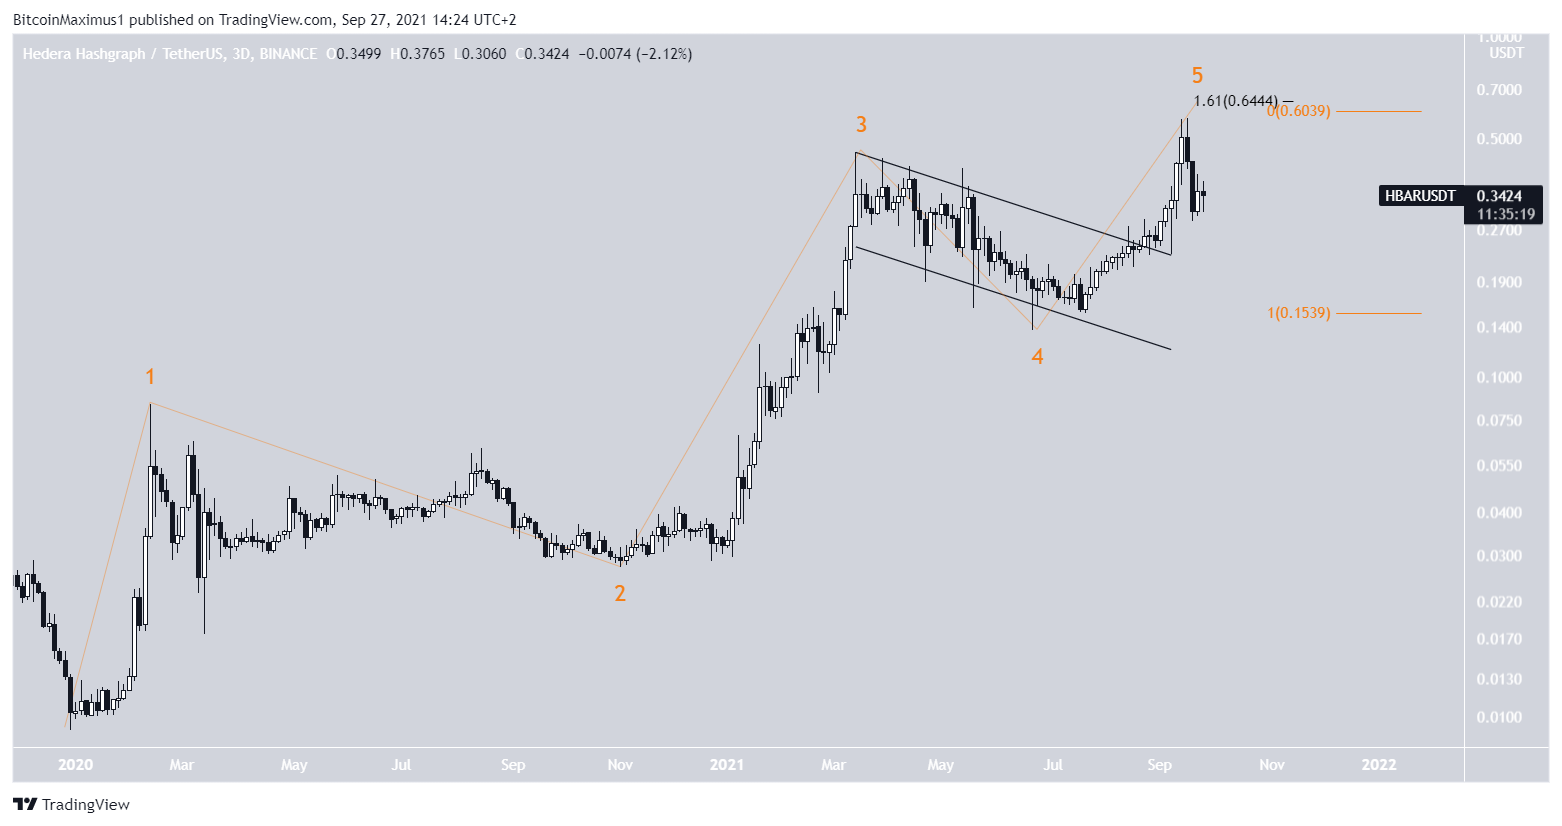
The most likely wave count indicates that HBAR is in wave five of a bullish impulse, which was confirmed after the breakout from the parallel channel.
The most likely target for the top of the upward movement is between $0.60-$0.64. The target is found using the length of waves 1-3 (orange) and the 1.61 external Fib retracement level (black).
The current all-time high of $0.574 only bared failed to reach this target area. However, due to the bullish readings from the daily time-frame, it would make sense for the token to initiate another final upward movement and reach it.
Nevertheless, it does seem like the upward movement and the bullish cycle is coming to an end.

For BeInCrypto’s latest Bitcoin (BTC) analysis, click here.
What do you think about this subject? Write to us and tell us!
Disclaimer
All the information contained on our website is published in good faith and for general information purposes only. Any action the reader takes upon the information found on our website is strictly at their own risk.


