

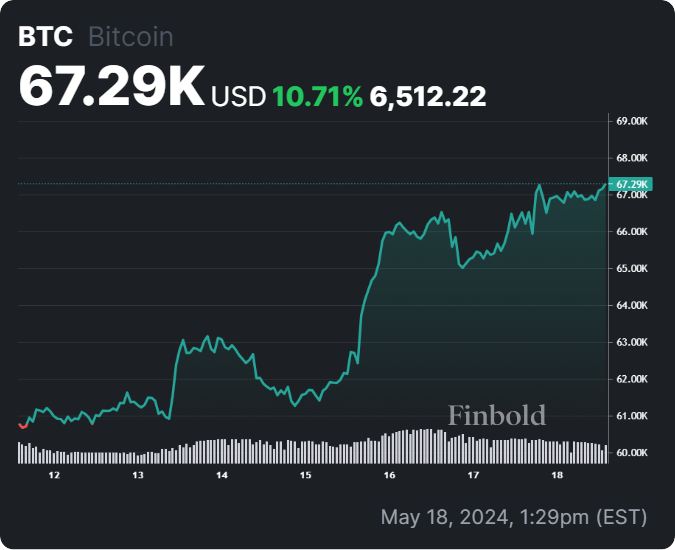
Bitcoin (BTC) is currently trading with a bullish bias, with the cryptocurrency climbing to its highest point in over a month.
As the asset shows strength, the market remains on edge regarding the next move, especially if Bitcoin is primed to reclaim another record high.
In looking at the next Bitcoin price trajectory, crypto analyst RLinda pointed out in a TradingView post on May 18 that bulls are now ready to challenge Bitcoin resistance. According to the analyst, buyers have pushed Bitcoin’s price upward after successfully defending the $64,500-$65,000 support range, testing the resistance at $67,250.
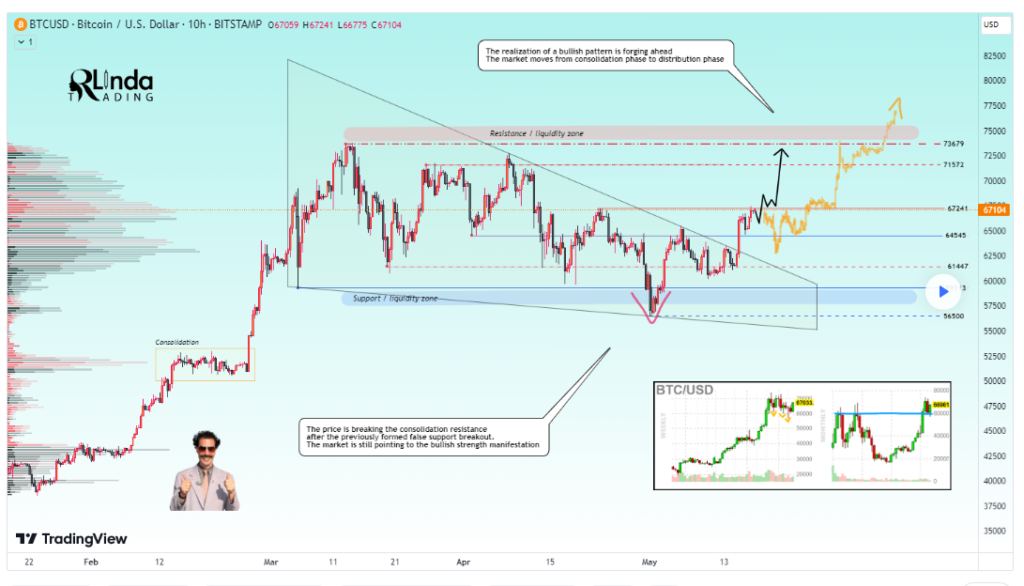
She noted that the lack of a subsequent fall suggests a pre-breakdown consolidation. This indicates that bulls are accumulating positions with a breakout target in mind, preparing for a sustained upward movement.
Key levels to watch
In the meantime, the analyst pointed out that with Bitcoin showing bullish momentum, key resistance levels to watch are $67,250, $71,500, and $73,700, while crucial support levels include $65,250, $64,500, and $61,500.
Notably, the high interest from investors and a favorable fundamental background could significantly strengthen the price. The analysis suggests that breaking through these resistance levels could pave the way for continued bullish momentum.
“Bitcoin looks quite bullish right now. High interest, favorable fundamental background can affect the strengthening of the price. At the moment, it is worth paying attention to these levels, the breakthrough of which may give a continuation of the movement, the targets are indicated on the chart,” the expert said.
Overall, RLinda noted that based on Bitcoin’s local timeframe, there is an indication of the end of a locational correction and the beginning of a potentially significant third-wave formation.
Additionally, the analyst pointed out that Bitcoin is undergoing consolidation with substantial volumes accumulated by strong buyers. This consolidation phase is crucial as it could transition into a distribution phase, further propelling the bullish trend if buyers remain persistent.
It’s worth noting that Bitcoin’s ongoing bullish momentum follows the April CPI release, which showed inflation slowed and data indicating increasing retail and institutional interest in exchange-traded funds (ETFs). This signals a steady recovery for Bitcoin after it started May in a red zone, dropping as low as $56,000.
Bitcoin price analysis
At press time, Bitcoin was trading at $67,290, with daily gains of 1%. On the weekly chart, Bitcoin is up almost 11%.
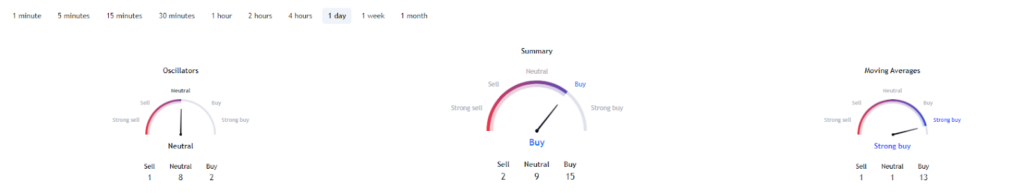
Elsewhere, Bitcoin’s technical indicators point to a bullish sentiment. A summary of the one-day gauges retrieved from TradingView aligns with the ‘buy’ sentiment at 15. Moving averages indicate a ‘strong buy’ at 13 while oscillators remain ‘neutral’ at 8.
Indeed, Bitcoin is gearing up to hit another record high, a milestone that can be realized if the cryptocurrency can reclaim $70,000.
Disclaimer: The content on this site should not be considered investment advice. Investing is speculative. When investing, your capital is at risk


