The Bitcoin Fibonacci Pivot Points spotlight important targets to watch as BTC looks to record a golden cross for the first time this year.
This crucial crossover, which occurs when the 50-day moving average (MA) crosses above the 200-day MA, is often regarded as a bullish signal. The last time this crossover occurred was last October, leading to the upsurge in the early bull run phase. Notably, the imminent one would mark the first cross of 2024.
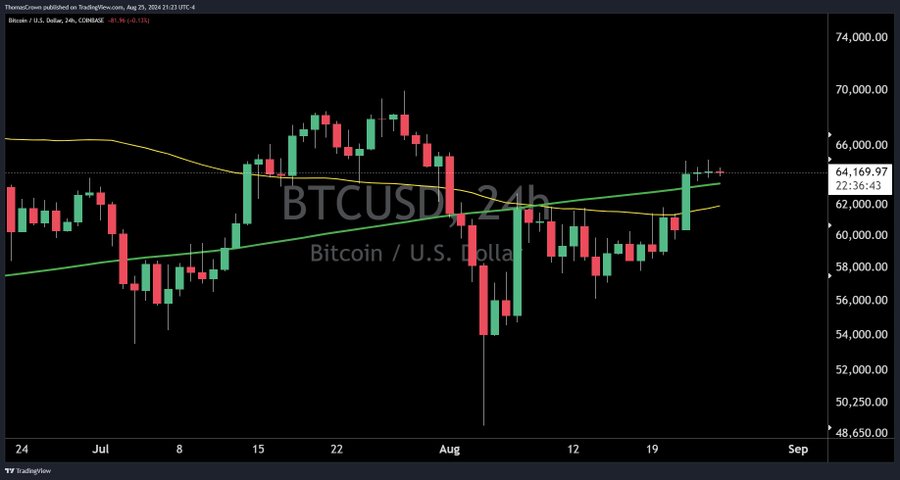
Tom Crown, market analyst and founder of Crown Analysis, called attention to the latest development in an X post. An accompanying chart displays Bitcoin’s daily price action alongside its 50-day (yellow line) and 200-day (green line) moving averages.


Over the past month, Bitcoin has shown resilience, gradually climbing back from the Aug. 5 low around $49,050. The price has consistently stayed below the 50-day and 200-day MAs for the most of August. However, it breached both moving averages following a 6.13% spike over the weekend.
With Bitcoin currently trading for $63,848 at the reporting time, its price remains above the 50-day moving average at $61,927 and the 200-day moving average at $63,418. In addition, after a significant drop, the 50-day MA appears to be spiking at a faster rate than the 200-day MA, prompting Crown’s optimism of an imminent crossover.
Conditions for the Golden Cross
This setup is forming the foundation for a golden cross. As Bitcoin trades just above both moving averages, a successful cross of the 50-day MA above the 200-day MA could indicate a strong bullish trend.
However, for this to materialize, Bitcoin’s near-term momentum needs to accelerate, pushing the 50-day MA upward with more conviction. Nonetheless, a failure to sustain this upward momentum could lead to a rejection and a bearish reversal.
Meanwhile, on the daily chart, the Bitcoin MACD line (blue) has crossed above the signal line (orange), confirming the recent bullish momentum. Also, the histogram is showing positive growth, further indicating that the buying pressure might be increasing.


Despite the bullish trend, this positive signal is still in its early stages, and the momentum needs to continue building to prevent a potential fakeout. If Bitcoin holds above $63K, it could set the stage for the golden cross to trigger a more significant price rally.
Key Bitcoin Levels to Watch
Notably, as the market battles the growing uncertainty, Bitcoin’s Fibonacci Pivot Points have identified potential support and resistance levels that could influence the premier crypto asset’s price action in the coming days.
The pivot point (P) is currently at $62,703, acting as a critical support level. Should Bitcoin retrace, this level could serve as the first line of defense. Below this, the S1 support level at $56,400 provides a stronger floor, which has historically acted as a significant price region for buyers.


On the upside, the first resistance level (R1) rests at $69,006. Should the golden cross materialize and bullish momentum continue, breaking above this level could propel Bitcoin towards R2 at $72,900, and eventually to R3 at $79,203, a new all-time high.
Disclaimer: This content is informational and should not be considered financial advice. The views expressed in this article may include the author’s personal opinions and do not reflect The Crypto Basic’s opinion. Readers are encouraged to do thorough research before making any investment decisions. The Crypto Basic is not responsible for any financial losses.


