

Bitcoin (BTC) is currently consolidating above the $60,000 mark, but there is overall market uncertainty regarding its future direction.
In this regard, crypto analyst The Moon, based on technical indicators, painted both a bearish and bullish picture for Bitcoin in an X post on August 14.
The analyst noted that Bitcoin is trading within a large symmetrical triangle pattern on the one-hour chart. This common chart formation typically precedes a breakout, with the price moving sharply toward the breakout. Bitcoin has been trading within converging trendlines, indicating a potential upward or downward move.

The Moon’s analysis highlighted two critical price targets based on the direction of the breakout. If Bitcoin breaks above the triangle’s upper trendline, it could aim for $68,000. This target is derived from measuring the triangle’s height and adding it to the breakout point. A move to $68,000 would represent a significant bullish reversal and could attract further buying interest.
Conversely, if Bitcoin breaks below the lower trendline, it could decline to $52,000. This bearish target is calculated similarly, using the triangle’s height and subtracting it from the breakout point. A move to this level would likely trigger sell-offs, especially among traders who entered positions at higher prices.
Bitcoin key price levels to watch
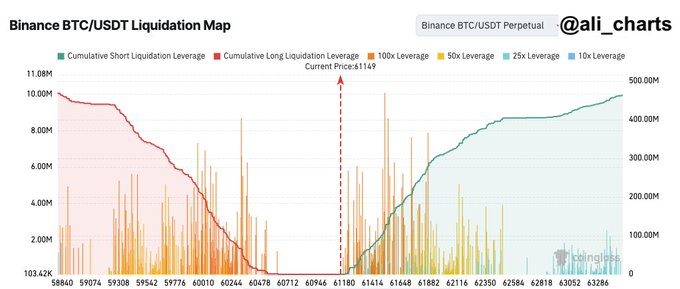
Another crypto analyst, Ali Martinez, pointed out key Bitcoin price levels to monitor in an X post on August 14, especially with the release of the United States Consumer Price Index (CPI).
Martinez advised Bitcoin traders to be highly alert to CPI data. The latest liquidation map from Binance backed this analysis for the BTC/USDT pair, where market makers may capitalize on this major macroeconomic event to liquidate over-leveraged positions.
According to Martinez, bulls must be wary of a potential dip toward $59,700, which could trigger significant long liquidations. On the other hand, bears should be cautious of a rally toward $62,200, a zone that could see substantial short positions getting wiped out.
The CPI data is central to Bitcoin’s trajectory. The figures will likely inform the next Federal Reserve interest rate decisions amid lingering recession fears. Recent concerns about an economic slowdown saw Bitcoin briefly plunge below the $50,000 mark.
Notably, the consumer price index showed CPI rose 2.9% in the past 12 months through July, below economists’ expectations of 3%. On a core basis, excluding volatile food and energy, prices rose by 3.2%, which aligns with consensus forecasts. This data bolsters the case for an initial rate cut from the Federal Reserve next month.
Bitcoin price analysis
Bitcoin was trading at $60,950 at press time, having gained over 3% in the last 24 hours. On the weekly chart, it has gained almost 8%.
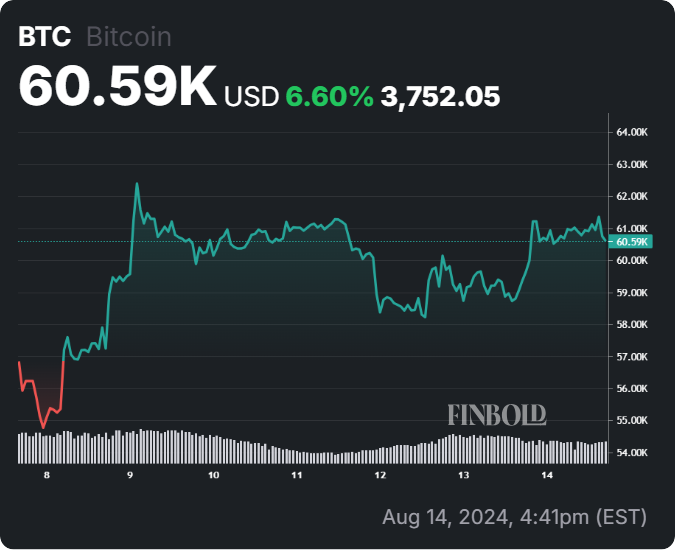
Overall, the $60,000 mark remains central to Bitcoin’s subsequent trajectory, as maintaining gains above this level could validate the bullish momentum.
Disclaimer: The content on this site should not be considered investment advice. Investing is speculative. When investing, your capital is at risk.


