

JohnnyGreig/E+ via Getty Images
Thesis Summary
The realized Bitcoin (BTC-USD) price is a highly watched and useful metric. Looking at the history of Bitcoin, we can see that this level has acted as strong support in bear markets. Evidence suggests that with every bear market, Bitcoin spends less time under this key level.
Ultimately, this is yet another reason why I believe that we are very near the bottom in Bitcoin.
What Is Realized Price?
In my latest article on Bitcoin, I talked about key metrics that suggested that Bitcoin was close to a bottom. These included the 200-week moving average, Fibonacci retracement levels and insights provided by the halving cycle. In this article, we’ll have a look at yet another important metric; realized price.
Realized price measures the average price at which each Bitcoin in circulation was last bought. In other words, it measures the market’s cost basis. This is a very influential level because it establishes the barrier between profitability and losses.
Here’s a long-term chart of price and realized price. Generally, realized price moves in line with the price of Bitcoin. As the price goes up, and new people begin to buy Bitcoin, the average purchase price increases. The opposite can also happen, though. When the price of Bitcoin begins to fall, losses are realized and Bitcoin is rebought at lower levels, lowering the realized price. Notice how, as is to be expected, the Bitcoin price is generally above the realized price. However, during deep market selloffs towards the end of bear markets, the price of Bitcoin falls below realized price, though not far below it and not for long.
This is why realized price is such an important metric and, as history will show, it is becoming even more significant.
Bear Market History
In Bitcoin’s history, we can highlight four previous bear markets that took place in 2011, 2014, 2018 and 2019.
The beginning of the bear market would be when the Bitcoin price tops, and the end of the bear market could be defined as the moment when the Bitcoin price recovers and goes back above the realized price.
If we were to highlight these in the chart mentioned above, we would see some interesting dynamics at play here.
First off, except for 2011, each bear market has been notably shorter than the previous one. Secondly, in every subsequent bear market, the realized price barrier has been “stronger” than in the previous one.
In 2011, price went far below realized price and stayed there for over 100 days. In 2014-15, we also dipped below the realized price, but less so, although in this instance the absolute spent time below was longer, though shorter in proportion to the length of the bear market.
This trend continues in 2019-20. In this instance, the Bitcoin price almost bounces off the realized price line. These findings are summarized in the following table. MVRV is the ratio between market value and realized value. This is the same as comparing price and realized price, as all we are doing is multiplying them by the supply of Bitcoin. When MVRV>1, it means the market price has surpassed realized price.
Bear Market table (Glassnode)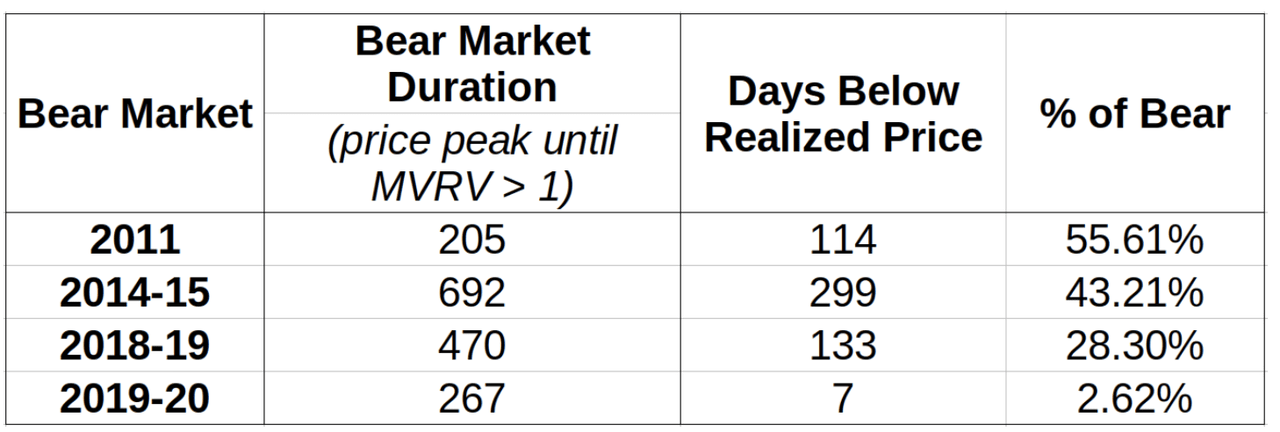
So, as we can see here, not only are bear markets getting shorter, but the time spent under the realized price level has also been proportionally shorter when compared to the length of the overall bear market. In the last correction, the Bitcoin price spent 7 days under the realized price, which accounted for 2.62% of the days we spent in a downtrend.
Closing Remarks
We have a very clear trend, but what forces are behind this, and will this trend continue? The realized price has become a very watched level, and market participants are expecting a bounce there, so that is where more buyers are accumulating. But there is also something to be said about the fact that Bitcoin is becoming more mainstream, accepted by institutions, and due to the deeper markets and demand, less volatile.
Now, if we take the most recent high, achieved around Nov 10th 2020, we are approaching 200 days in a bear market. If we accept the premise that this bear market should likely be shorter than the previous one, then we have at most two months left of bear.
Furthermore, if we assume that dynamics of price and realized price continues, then Bitcoin’s price should barely scrape the realized price this time and perhaps not even touch it. The realized price currently stands at around $23,786.
So, in conclusion, one could hypothesize that the bear market will end within the next 60 or so days and that the potential downside at this point is limited to a little under 20%. This is quite close to the expectations I laid out in my previous analysis of Bitcoin’s price, and the ideas that I have been discussing with my subscribers over the last couple of months.


