

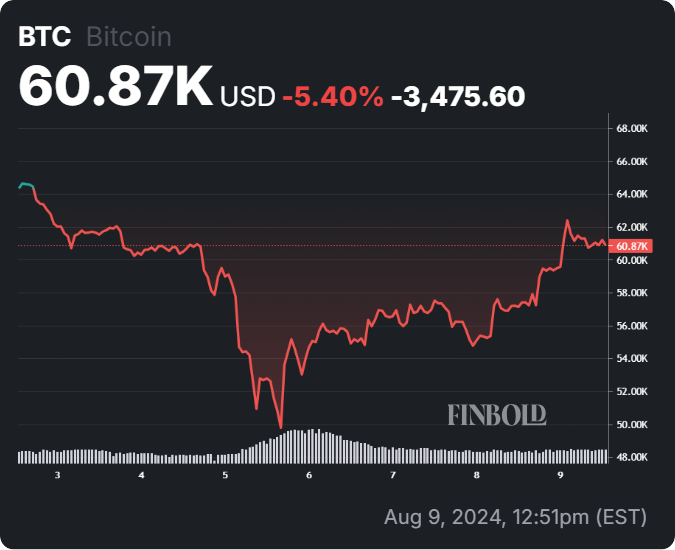
After undergoing a flash crash, the price of Bitcoin (BTC) has made a significant recovery, with analysts maintaining that the maiden cryptocurrency is destined for a further bull run.
Particularly, in a TradingView post on August 8, Alan Santana offered a comprehensive outlook on Bitcoin’s potential price trajectory, drawing attention to key indicators and patterns.
According to the expert, Bitcoin’s monthly Relative Strength Index (RSI) is currently at 57.59. While this reading generally indicates a bullish trend, Santana warned that the RSI’s downward trajectory could spell trouble for Bitcoin in the short term. Historically, an RSI in the bullish zone suggests room for further decline.
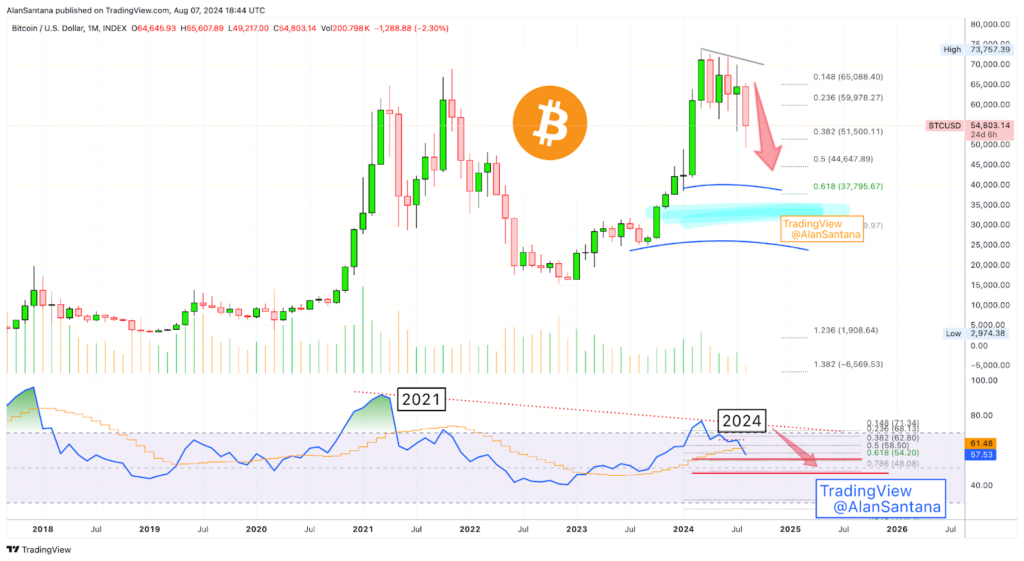
At the same time, Santana drew parallels between the current RSI reading and a similar scenario in May 2022. During that period, Bitcoin’s RSI dropped to 48, and the cryptocurrency traded between $40,000 and $25,000, with the most significant trading activity around $33,000 to $36,000. Therefore, Santana predicts a similar pattern may unfold this time.
For the bulls, the current signals are discouraging, suggesting a potential drop before any significant upward movement. However, Santana emphasized that once Bitcoin hits bottom, the only direction left is up. The analyst advised against greed for the bears, urging them to secure profits as the downward move develops.
Bitcoin’s next record-high price
Despite the short-term bearish outlook, the expert remained optimistic about Bitcoin’s long-term potential. He projected that Bitcoin could reach a new all-time high of $190,000 to $230,000 in 2025 or 2026. This projection is based on historical trends and the cyclical nature of Bitcoin’s market movements.
“These are discouraging signals for bulls but not all is lost… Once we hit bottom, the only place left to go is up. We are projecting a new All-Time High of $190,000 – $230,000 in 2025/26,” the expert noted.
In the short term, analysts hope that Bitcoin could build on the current bullish momentum to target $100,000. In this line, another analyst, by the pseudonym Thescalpingpro, observed in an X post on August 9 that Bitcoin continues to consolidate within a broadening wedge pattern, maintaining investor interest and anticipation.
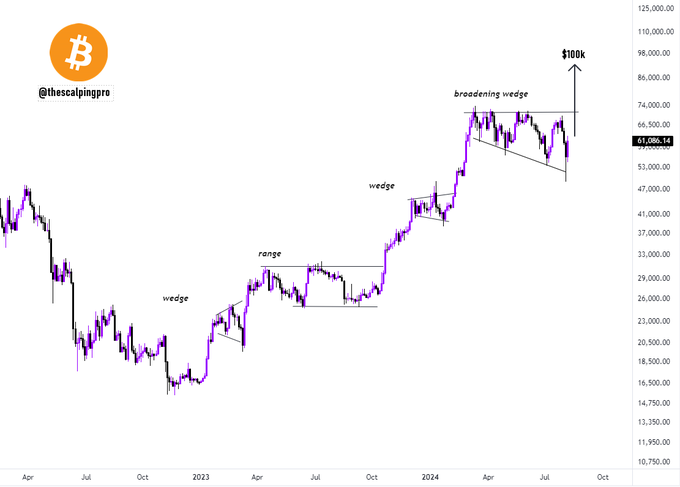
Notably, the pattern indicates an impending breakout that could propel the price toward the $100,000 target. This pattern has formed over the past few months and suggests increasing volatility and potential bullish momentum.
Overall, the broadening wedge is a technical formation that often precedes significant price movements, and Bitcoin’s current position within this pattern aligns with historical trends of substantial price appreciation following such consolidations.
Bitcoin price analysis
By press time, Bitcoin was trading at $60,870, having rallied almost 6% in the last 24 hours. On the weekly chart, BTC is down over 5%.
Although analysts have maintained a bullish outlook for Bitcoin, it’s worth noting that the crypto recently plunged following increasing fears of a recession in the United States. Therefore, it’s important to monitor how the economy performs in the coming months.
Disclaimer: The content on this site should not be considered investment advice. Investing is speculative. When investing, your capital is at risk.


