Key Takeaways
- All processes on Linux require RAM and CPU cycles, which can lead to competition for these resources.
- Tools like free, top, and htop help identify memory hogs and high CPU usage.
- Use commands like ps and top to identify and kill offending processes and regain system performance.
Every piece of code running inside your Linux computer needs RAM and CPU cycles. A process taking more than its fair share slows down other processes. Here’s how to find the culprits.
The Processes and Resources Balancing Act
RAM and CPU cycles are finite resources. When a program’s code is executed, a process is formed. Along with the processes of the operating system, there are the processes that run your desktop environment, and any commands or applications that you launch. They all require CPU time and RAM.
Linux and the CPU have to manage the allocation of RAM and balance and schedule the CPU workload across cores and threads, to make sure all processes get a share.
Applications are supposed to be written to make sure they don’t monopolize your machine, but sometimes things go wrong, and processes can try to commandeer all your RAM and monopolize your CPU.
That’s when you need to be able to identify the runway process.
Investigating High Ram Usage
Linux uses free RAM as cache. Although it might look like all of your RAM is in use, that’s probably a false impression. If required, items are dropped from the cache to allocate RAM to regular processes.
The free Command
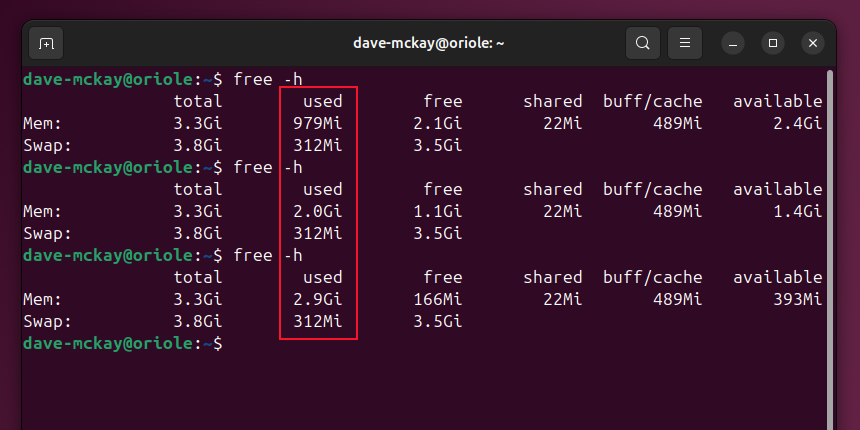
The free command gives you a snapshot overview of memory usage. The -h (human) option makes the output easier to read.
I ran the command three times in a terminal window. In another terminal window, I ran a program that requested large amounts of RAM.
free -h
free -h
free -h
The free RAM drops at an alarming rate. We need to identify the process or processes behind that.
Reading /proc/meminfo
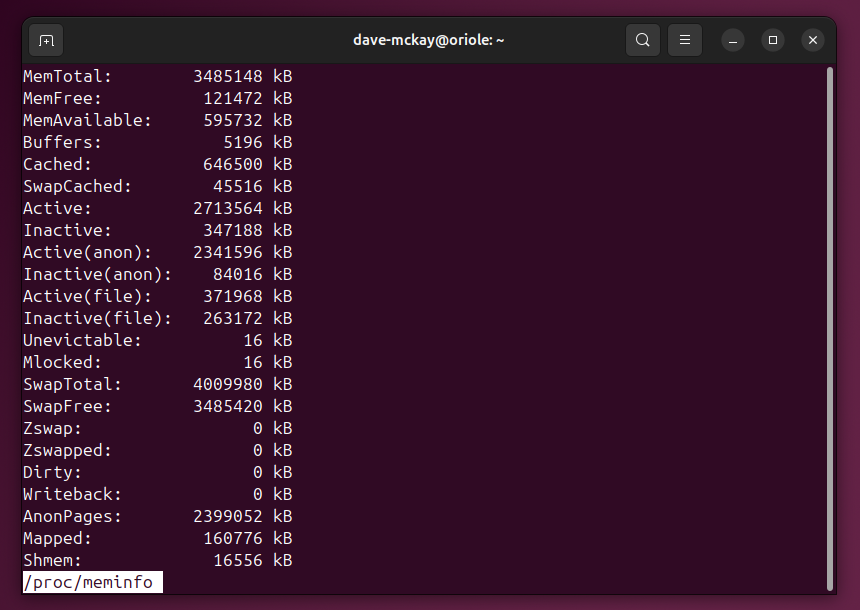
Tools like top and htop pull their memory information from the /proc/meminfo pseudo file. Because /proc/meminfo behaves like a file, we can use common utilities like cat and less to look at its contents.
less /proc/meminfo The output differs according to which kernel you’re running and the architecture of your CPU, but the standard fields are always there. This is a good way to see a more granular display of exactly what type of memory use is taking the biggest portion of your RAM, but it doesn’t identify individual processes.
Using the vmstat Command To Find Memory Hogs
The vmstat command can give us a view of the virtual memory usage over time.
To see four sets of results, five seconds apart, with the values shown in MiB, we can use this command:
vmstat 5 4 -S M
Using top and htop To Find Memory Hogs
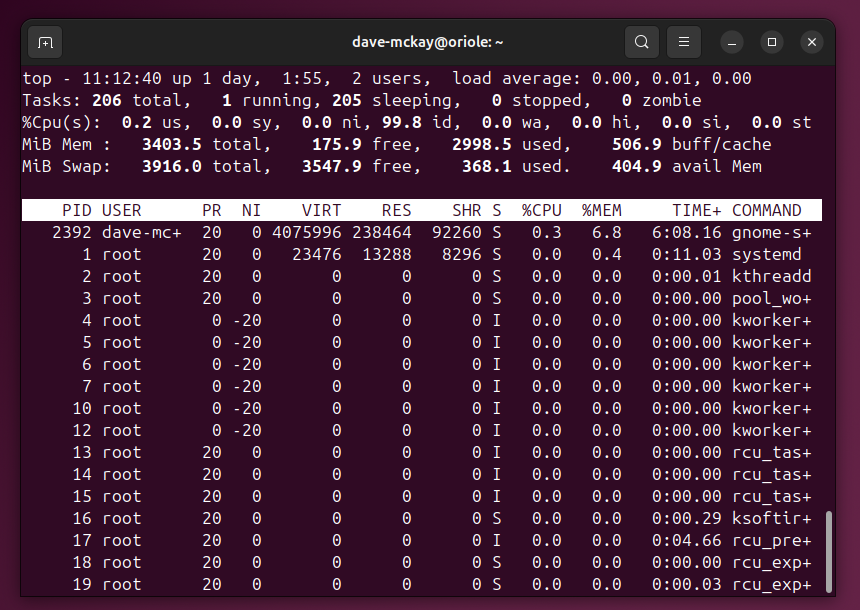
Both top and htop provide a dynamic dashboard of system information, with a process table showing one line of information per process.
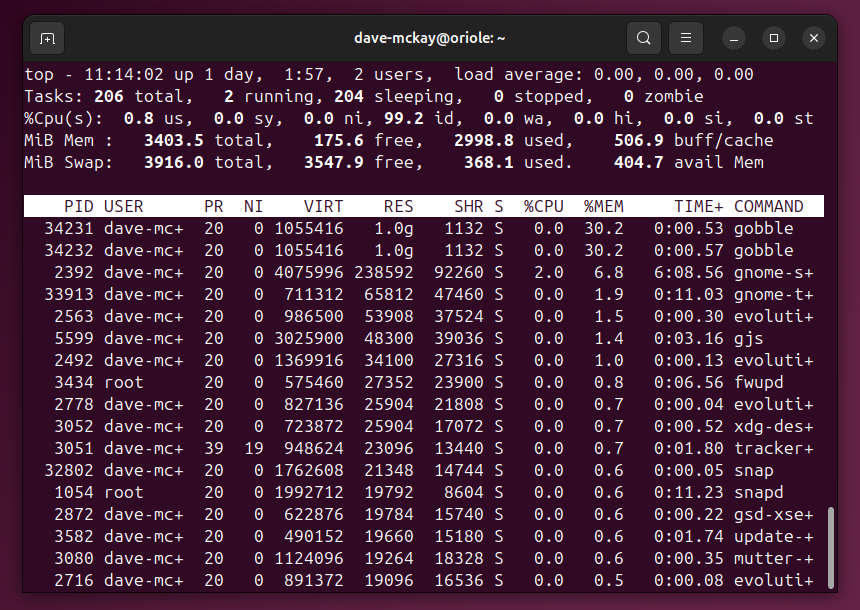
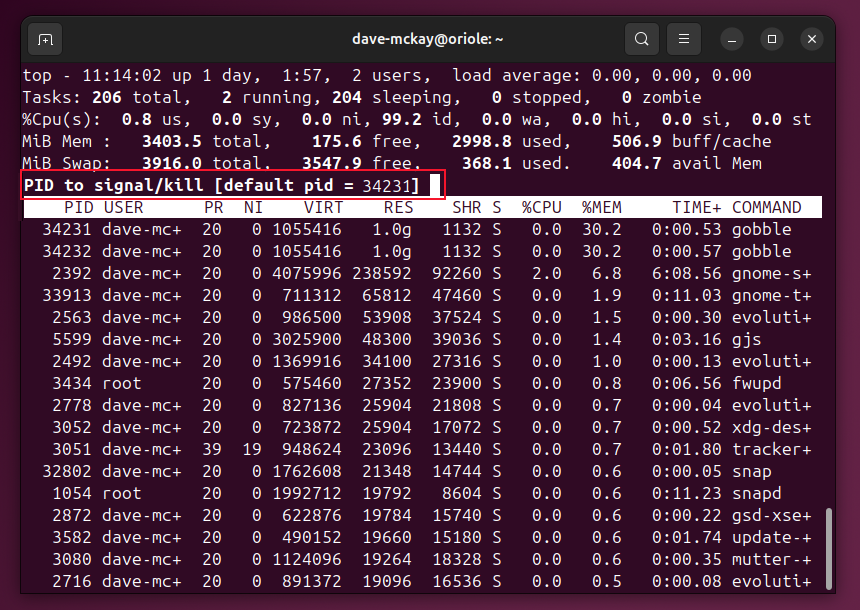
To sort the process table by RAM usage, press Shift+M.
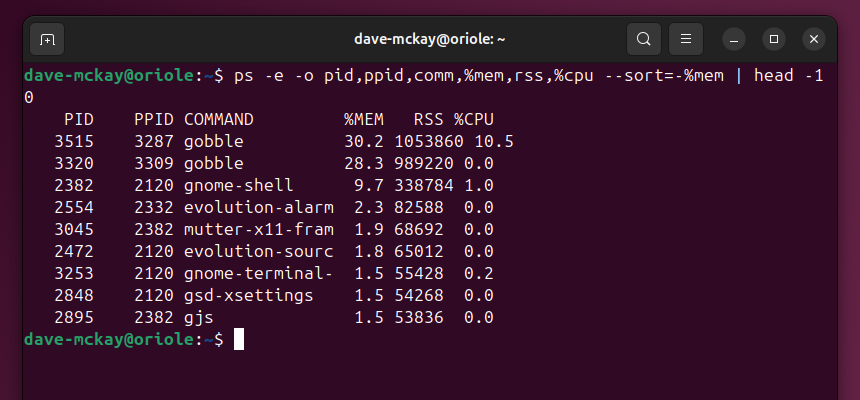
A program called gobble has been launched twice. It’s using two-thirds of the RAM. We’ll kill those two processes.
Press k, to start the kill function.
In top, we need to provide the process ID of the process we wish to kill. By default, the kill function will use the ID of the process on the top line. Because we sorted the table by RAM usage, that’s the ID we want to use, so we can just press Enter.
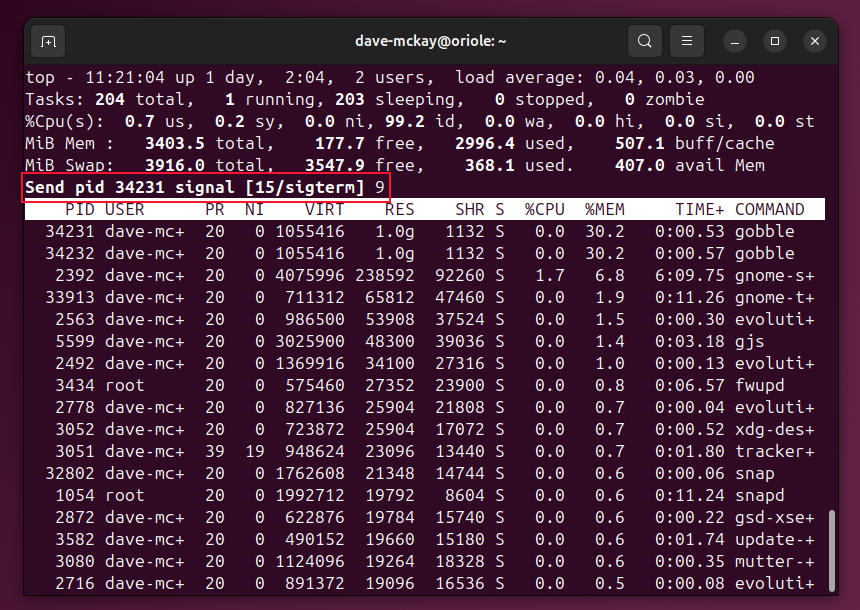
We’re asked which signal we should send to the process. SIGKILL is signal number nine. We need to enter the digit nine, then hit Enter once more.
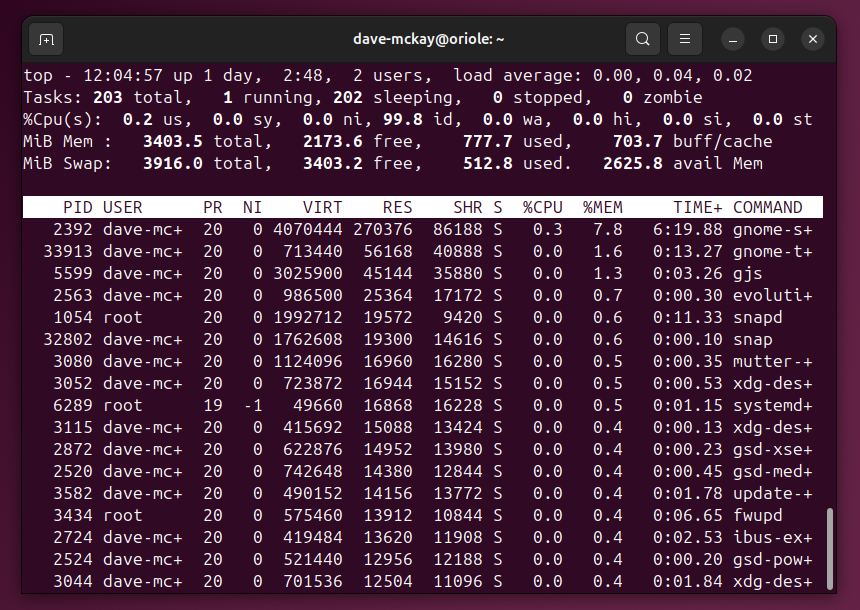
If we repeat that process twice, both instances of the gobble program have been terminated.
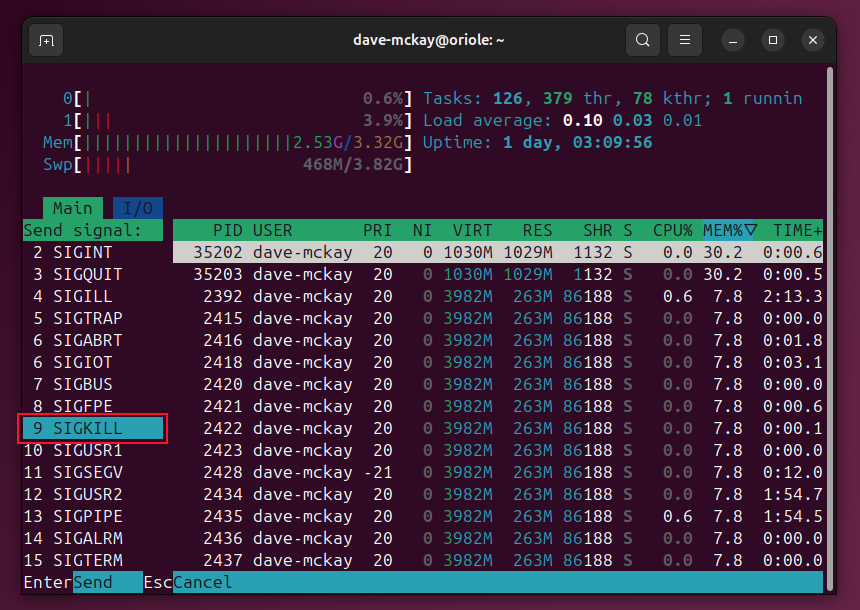
In htop it’s very similar. Move the highlight bar to the process you want to kill. Press k to start the kill process. A list of signals appears on the left of the window.
Move the small highlight bar to the 9 SIGKILL entry, then press Enter.
Using the ps Command To Find Memory Hogs
The ps command gives us the process ID, and can also give us the parent process ID. If you have a lot of processes consuming memory that were launched by the same parent process, killing the parent process kills its children processes, too.
We’ll use the -e (every process) option, and the -o (user-defined output format) options. In our output we’re asking for:
- pid: Process ID.
- ppid: Parent process ID.
- comm: The command name.
- %mem: The percentage of RAM used by this process.
- rss: The resident set size. This is the non-swapped physical memory a process has used, in kilobytes. Note that this doesn’t count reserved memory that hasn’t actually been used, nor does it count virtual memory. For the task in hand though, this is a perfectly good indicator.
- %cpu: This is the CPU time the process has had so far, divided by the time the process has been running.
We’re sorting by memory. The minus sign means reverse sort. We can obtain the 10 worst offenders by piping the results through head.
ps -e -o pid,ppid,comm,%mem,rss,%cpu
Investigating High CPU Usage
The procedure for tracking down CPU hogs is very similar to the ones we’ve discussed for memory hogs. We need to identify the offending process or processes, and obtain their process ID.
Using top and htop To Find CPU Hogs
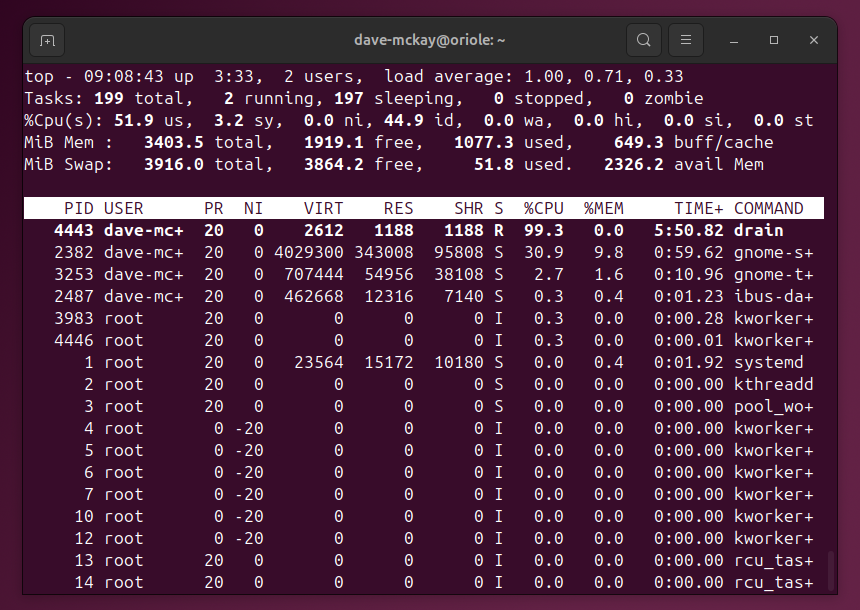
We can use top and htop almost exactly as we did to track down memory-hungry processes. By default, top and htop sort their process tables by the %CPU column. If you’ve changed the sort column, you can press Shift+P (for processor) to restore sorting by %CPU.
There’s a process called drain hogging almost all the CPU time for itself. Having identified the culprit, we can press k to invoke the kill process function.
Using the mpstat Command To Monitor CPU Usage
You need to take care when you’re killing processes. Some, especially system processes, should be left alone. The mpstat command gives you a snapshot of CPU usage for user and system processes.
You’ll need to install mpstat on Fedora and Manjaro, but it was already installed on our Ubuntu PC.
On Fedora, you need to type:
sudo dnf install sysstat On Manjaro, the command is:
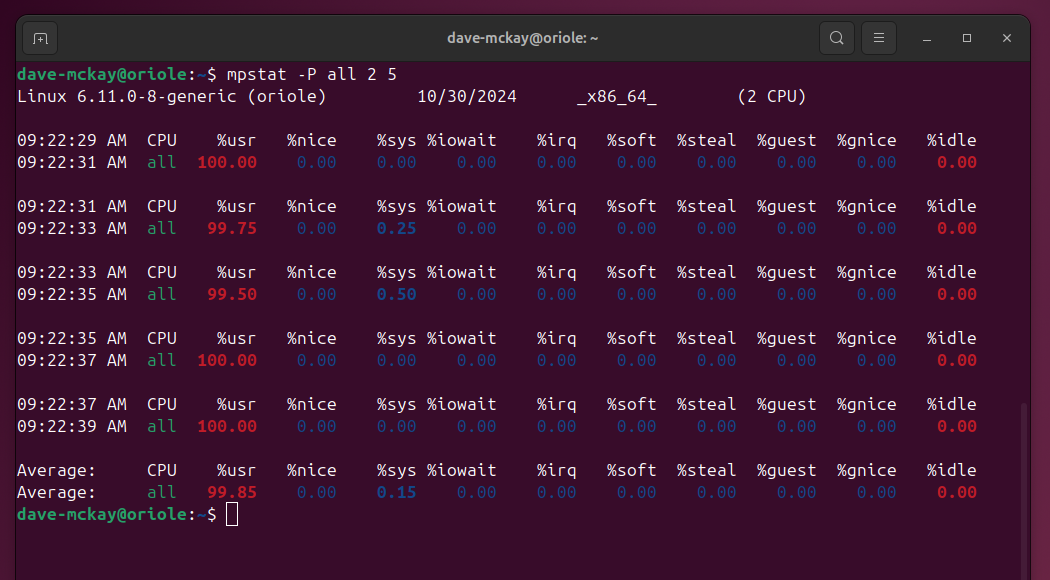
sudo pacman -S sysstat We’ll use the -P all (all processors) option, and ask for reports every two seconds, for a total of five reports.
mpstat -P all 2 5 We can see that the load on the CPU is coming from the user side, not the system side. The sixth row is the average of the five reports that we asked for.
Using ps to Find CPU Hogs
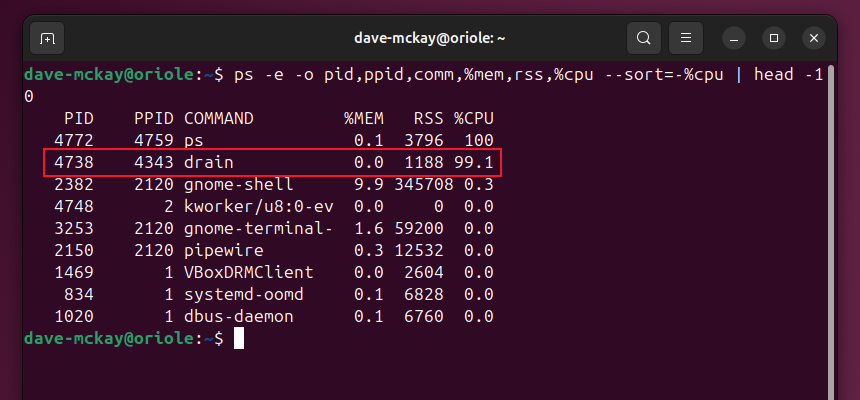
We can use ps to look for CPU-intensive processes, too. With a slight tweak to our earlier command, we can sort by CPU.
ps -e -o pid,ppid,comm,%mem,rss,%cpu The entry about ps is a false flag, we know that it only ran for a fraction of a second. In line two, we can see the process ID of the process that’s monopolizing the CPU. With this information we can use top or htop, or the kill command, to terminate the process.
A Little Housekeeping
Most of the time, your Linux computer will run just fine, with all processes operating within acceptable tolerances. If you notice your computer becoming sluggish, investigate it with these tools. You might find a memory or CPU hog running wild.


