Key Takeaways
- The netstat command provides information about network connections, ports in use, and the processes using them.
- Netsat can take arguments to filter out unneeded information and only show the specific details you’re looking for.
- Run sudo netstat -i to list your network interfaces.
The Linux netstat command gives you a treasure-trove of information about your network connections, the ports that are in use, and the processes using them. Learn how to use it.
Ports, Processes, and Protocols
Network sockets can either be connected or waiting for a connection. The connections use networking protocols like Transport Control Protocol (TCP) or User Datagram Protocol UDP. They use Internet Protocol addresses and network ports to establish connections.
The word sockets might conjure up images of a physical connection point for a lead or cable, but in this context, a socket is a software construct used to handle one end of a network data connection.
Sockets have two main states: They are either connected and facilitating an ongoing network communication, or they are waiting for an incoming connection to connect to them. There are other states, such as the state when a socket is midway through establishing a connection on a remote device, but putting transient states aside, you can think of a socket as either being connected or waiting (which is often called listening).
The listening socket is called the server, and the socket that requests a connection with the listening socket is called a client. These names have nothing to do with hardware or computer roles. They simply define the role of each socket at each end of the connection.
The netstat command lets you discover which sockets are connected and which sockets are listening. Meaning, it tells you which ports are in use and which processes are using them. It can show you routing tables and statistics about your network interfaces and multicast connections.
The functionality of netstat has been replicated over time in different Linux utilities, such as ip and ss. It’s still worth knowing this granddaddy of all network analysis commands, because it is available on all Linux and Unix-like operating systems, and even on Windows and Mac.
Here’s how to use it, complete with example commands.
Listing All Sockets with netstat
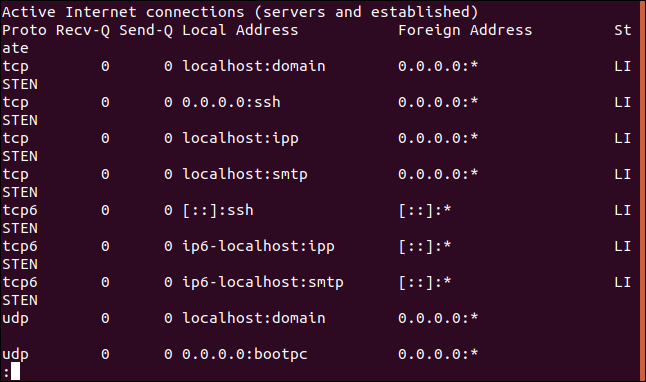
The -a (all) option makes netstat show all the connected and waiting sockets. This command is liable to produce a long listing, so we pipe it into less.
netstat -a | less
The listing includes TCP (IP), TCP6 (IPv6), and UDP sockets.
The wrap-around in the terminal window makes it a little difficult to see what is going on. Here’s a couple of sections from that listing:
Active Internet connections (servers and established)
|
Proto |
Recv-Q |
Send-Q |
Local Address |
Foreign Address |
State |
|---|---|---|---|---|---|
|
TCP |
0 |
0 |
localhost: domain |
0.0.0.0:* |
LISTEN |
|
TCP |
0 |
0 |
0.0.0.0:ssh |
0.0.0.0:* |
LISTEN |
|
TCP |
0 |
0 |
localhost:ipp |
0.0.0.0:* |
LISTEN |
|
TCP |
0 |
0 |
localhost:smtp |
0.0.0.0:* |
LISTEN |
|
TCP6 |
0 |
0 |
[::]:ssh |
[::]:* |
LISTEN |
|
TCP6 |
0 |
0 |
ip6-localhost:ipp |
[::]:* |
LISTEN |
Active UNIX domain sockets (servers and established)
|
Proto |
RefCnt |
Flags |
Type |
State |
I-Node |
Path |
|---|---|---|---|---|---|---|
|
unix |
24 |
[ ] |
DGRAM |
12831 |
|
|
|
unix |
2 |
[ ACC ] |
STREAM |
LISTENING |
24747 |
|
|
unix |
2 |
[ ] |
DGRAM |
26372 |
|
|
|
unix |
2 |
[ ] |
DGRAM |
23382 |
|
|
|
unix |
2 |
[ ACC ] |
SEQPACKET |
LISTENING |
12839 |
|
The “Active Internet” section lists the connected external connections and local sockets listening for remote connection requests. That is, it lists the network connections that are (or will be) established to external devices.
The “UNIX domain” section lists the connected and listening internal connections. In other words, it lists the connections that have been established within your computer between different applications, processes, and elements of the operating system.
The “Active Internet” columns are:
- Proto: The protocol used by this socket (for example, TCP or UDP).
- Recv-Q: The receive queue. These are incoming bytes that have been received and are buffered, waiting for the local process that is using this connection to read and consume them.
- Send-Q: The send queue. This shows the bytes that are ready to be sent from the send queue.
- Local address: The address details of the local end of the connection. The default is for
netstatto show the local hostname for the address, and the name of the service for the port. - Foreign address: The address and port number of the remote end of the connection.
- State: The state of the local socket. For UDP sockets, this is usually blank. See the state table, below.
For TCP connections, the state value can be one of the following :
- LISTEN: Server-side only. The socket is waiting for a connection request.
- SYN-SENT: Client-side only. This socket has made a connection request and is waiting to see if it will be accepted.
- SYN-RECEIVED: Server-side only. This socket is waiting for a connection acknowledgment after accepting a connection request.
- ESTABLISHED: Server and clients. A working connection has been established between the server and the client, allowing data to be transferred between the two.
- FIN-WAIT-1: Server and clients. This socket is waiting for a connection termination request from the remote socket, or for an acknowledgment of a connection termination request that was previously sent from this socket.
- FIN-WAIT-2: Server and clients. This socket is waiting for a connection termination request from the remote socket.
- CLOSE-WAIT: Server and client. This socket is waiting for a connection termination request from the local user.
- CLOSING: Server and clients. This socket is waiting for a connection termination request acknowledgment from the remote socket.
- LAST-ACK: Server and client. This socket is waiting for an acknowledgment of the connection termination request it sent to the remote socket.
- TIME-WAIT: Server and clients. This socket sent an acknowledgment to the remote socket to let it know that it received the remote socket’s termination request. It is now waiting to make sure that acknowledgment was received.
- CLOSED: There is no connection, so the socket has been terminated.
The “Unix domain” columns are:
- Proto: The protocol used by this socket. It will be “unix.”
- RefCnt: Reference count. The number of attached processes connected to this socket.
- Flags: This is usually set to
ACC, which representsSO_ACCEPTON, meaning the socket is waiting for a connection request.SO_WAITDATA, shown asW, means there is data waiting to be read.SO_NOSPACE, shown asN, means there is no space to write data to the socket (i.e., the send buffer is full). - Type: The socket type. See the type table below.
- State: The state of the socket. See the state table below.
- I-Node: The file system inode associated with this socket.
- Path: The file system path to the socket.
The Unix domain socket type can be one of the following:
- DGRAM: The socket is being used in datagram mode, using messages of fixed length. Datagrams are neither guaranteed to be reliable, sequenced, nor unduplicated.
- STREAM: This socket is a stream socket. This is the commonplace “normal” type of socket connection. These sockets are designed to provide reliable sequenced (in-order) delivery of packets.
- RAW: This socket is being used as a raw socket. Raw sockets operate at the network level of the OSI Model and don’t reference TCP and UDP headers from the transport level.
- RDM: This socket is located on one end of a reliably delivered messages connection.
- SEQPACKET: This socket is operating as a sequential packet socket, which is another means of providing reliable, sequenced, and unduplicated packet delivery.
- PACKET: Raw interface access socket. Packet sockets are used to receive or send raw packets at the device driver (i.e., data link layer) level of the OSI model.
The Unix domain socket state can be one of the following:
- FREE: This socket is unallocated.
- LISTENING: This socket is listening for incoming connection requests.
- CONNECTING: This socket is in the process of connecting.
- CONNECTED: A connection has been established, and the socket is able to receive and transmit data.
- DISCONNECTING: The connection is in the process of being terminated.
Wow, that’s a lot of information! Many of the netstat options refine the results in one way or another, but they don’t change the content too much. Let’s take a look.
Listing Sockets by Type Using the netstat Command
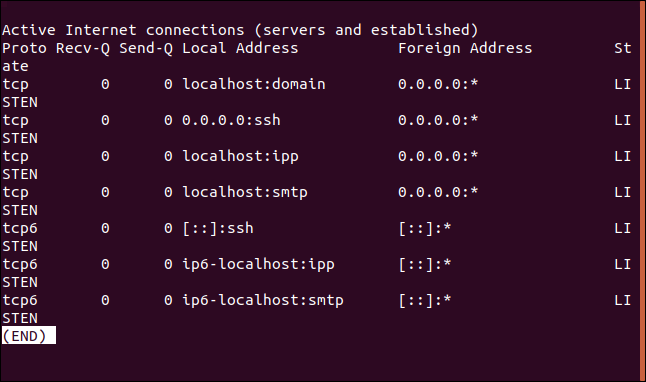
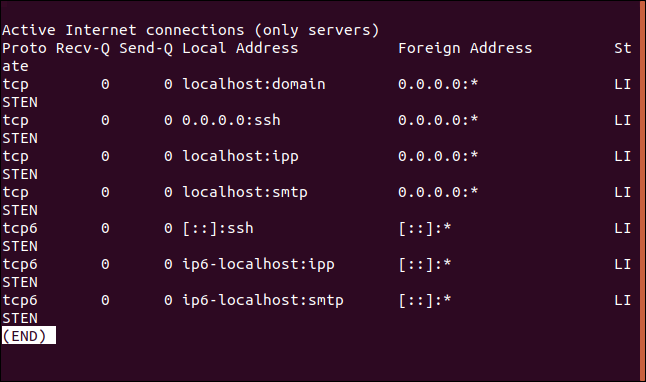
The netstat -a command can provide more information than you need to see. If you only want or need to see the TCP sockets, you can use the -t (TCP) option to restrict the display to only show TCP sockets.
netstat -at | less
The display out is greatly reduced. The few sockets that are listed are all TCP sockets.
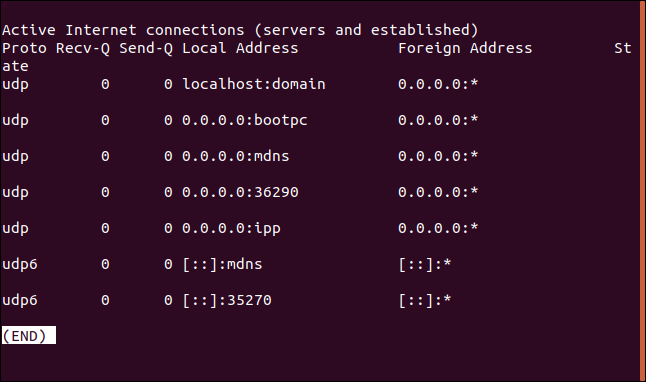
The -u (UDP) and -x (UNIX) options behave in a similar way, restricting the results to the type of socket specified on the command line. Here’s the -u (UDP) option in use:
netstat -au | less
Only UDP sockets are listed.
Listing Sockets by State
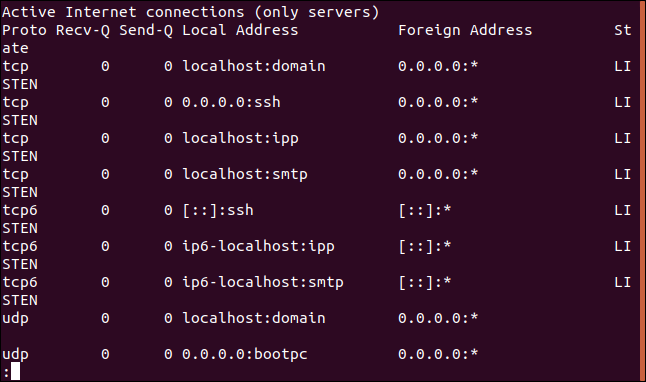
To see the sockets that are in the listening or waiting state, use the -l (listening) option.
netstat -l | less
The sockets that are listed are those that are in the listening state.
This can be combined with the -t (TCP, -u (UDP) and -x (UNIX) options to further home in on the sockets of interest. Let’s look for listening TCP sockets:
netstat -lt | less
Now, we see only TCP listening sockets.
Network Statistics by Protocol
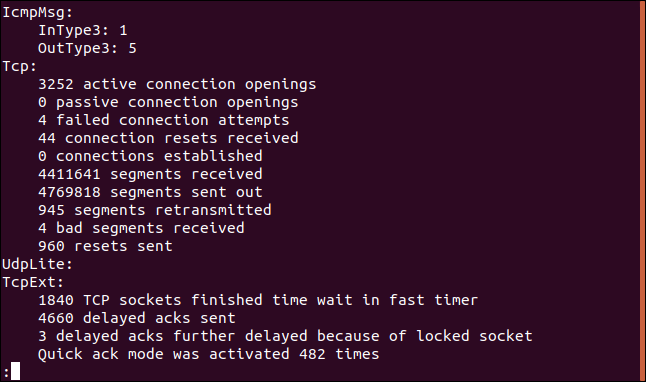
To see statistics for a protocol, use the -s (statistics) option and pass in the -t (TCP), -u (UDP), or -x (UNIX) options. If you just use the -s (statistics) option on its own, you’ll see statistics for all protocols. Let’s check the statistics for the TCP protocol.
netstat -st | less
A collection of statistics for the TCP connections is displayed in less.
Showing Process Names and PIDs
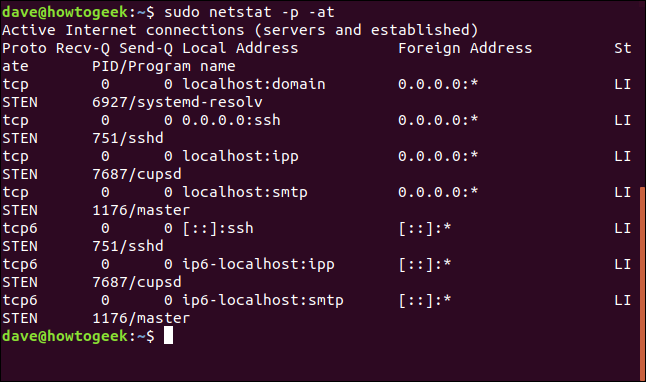
It can be useful to see the process ID (PID) of the process using a socket, together with the name of that process. The -p (program) option does just that. Let’s see what the PIDs and process names are for the processes using a TCP socket that is in the listening state. We use sudo to make sure we receive all of the information that is available, including any information that would normally require root permissions.
sudo netstat -p -at
Here’s that output in a formatted table:
Active Internet connections (servers and established)
|
Proto |
Recv-Q |
Send-Q |
Local Address |
Foreign Address |
State |
PID/Program Name |
|---|---|---|---|---|---|---|
|
tcp |
0 |
0 |
localhost: domain |
0.0.0.0:* |
LISTEN |
6927/systemd-resolv |
|
tcp |
0 |
0 |
0.0.0.0:ssh |
0.0.0.0:* |
LISTEN |
751/sshd |
|
tcp |
0 |
0 |
localhost:ipp |
0.0.0.0:* |
LISTEN |
7687/cupsd |
|
tcp |
0 |
0 |
localhost:smtp |
0.0.0.0:* |
LISTEN |
1176/master |
|
tcp6 |
0 |
0 |
[::]:ssh |
[::]:* |
LISTEN |
751/sshd |
|
tcp6 |
0 |
0 |
ip6-localhost:ipp |
[::]:* |
LISTEN |
7687/cupsd |
|
tcp6 |
0 |
0 |
ip6-localhost:smtp |
[::]:* |
LISTEN |
1176/master |
We’ve got an extra column called “PID/program name.” This column lists the PID and name of the process using each of the sockets.
Listing Numeric Addresses
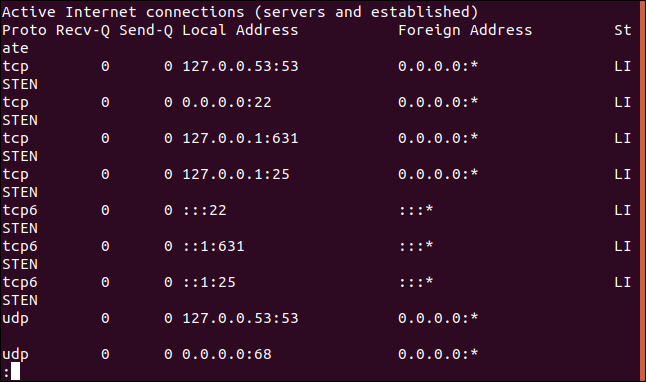
Another step we can take to remove some ambiguity is to display the local and remote addresses as IP addresses instead of their resolved domain and hostnames. If we use the -n (numeric) option, the IPv4 addresses are shown in dotted-decimal format:
sudo netstat -an | less
The IP addresses are shown as numeric values. The port numbers are also shown, separated by a colon ” : ” from the IP Address.
An IP address of 127.0.0.1 shows that the socket is bound to the loopback address of the local computer. You can think of an IP address of 0.0.0.0 as meaning the “default route” for local addresses, and “any IP address” for foreign addresses. IPv6 addresses shown as “::” are also all zero addresses.
The ports that are listed can be easily checked to see what their usual purpose is:
Displaying the Routing Table
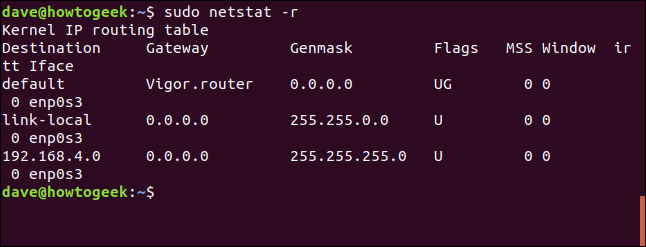
The -r (route) option displays the kernel routing table.
sudo netstat -r
Here’s that output in a neat table:
Kernel IP routing table
|
Destination |
Gateway |
Genmask |
Flags |
MSS |
Window |
irtt |
Iface |
|---|---|---|---|---|---|---|---|
|
default |
Vigor.router |
0.0.0.0 |
UG |
0 |
0 |
0 |
enp0s3 |
|
link-local |
0.0.0.0 |
255.255.0.0 |
U |
0 |
0 |
0 |
enp0s3 |
|
192.168.4.0 |
0.0.0.0 |
255.255.255.0 |
U |
0 |
0 |
0 |
enp0s3 |
And, here’s what the columns mean:
- Destination: The destination network or destination host device (if the destination is not a network).
- Gateway: The gateway address. An asterisk “
*” appears here if a gateway address is not set. - Genmask: The subnet mask for the route.
- Flags: See the flags table, below.
- MSS: Default Maximum Segment Size for TCP connections over this route—this is the largest amount of data that can be received in one TCP segment.
- Window: The default window size for TCP connections over this route, indicating the number of packets that can be transferred and received before the receiving buffer is full. In practice, the packets are consumed by the receiving application.
- irtt: The Initial Round Trip Time. This value is referenced by the kernel to make dynamic adjustments to TCP parameters for remote connections that are slow to respond.
- Iface: The network interface from which the packets sent over this route are transmitted.
The flags value can be one of:
- U: The route is up.
- H: Target is a host and the only destination possible on this route.
- G: Use the gateway.
- R: Reinstate the route for dynamic routing.
- D: Dynamically installed by the routing daemon.
- M: Modified by the routing daemon when it received an Internet Control Message Protocol (ICMP) packet.
- A: Installed by
addrconf, the automated DNS and DHCP config file generator. - C: Cache entry.
- !: Reject route.
Finding the Port Used by a Process
If we pipe the output of netstat through grep, we can search for a process by name and identify the port it is using. We use the -a (all), -n (numeric) and -p (program) options used previously, and search for “sshd.”
sudo netstat -anp | grep "sshd"
grep finds the target string, and we see that the sshd daemon is using port 22.
Of course, we can also do this in reverse. If we search for “:22”, we can find out which process is using that port, if any.
sudo netstat -anp | grep ":22"
This time grep finds the “:22” target string, and we see that the process using this port is the sshd daemon, process ID 751.
List the Network Interfaces
The -i (interfaces) option will display a table of the network interfaces that netstat can discover.
sudo netstat -i
Here’s the output in a more legible fashion:
Kernel Interface table
|
Iface |
MTU |
RX-OK |
RX-ERR |
RX-DRP |
RX-OVR |
TX-OK |
TX-ERR |
TX-DRP |
TX-OVR |
Flg |
|---|---|---|---|---|---|---|---|---|---|---|
|
enp0s3 |
1500 |
4520671 |
0 |
0 |
0 |
4779773 |
0 |
0 |
0 |
BMRU |
|
lo |
65536 |
30175 |
0 |
0 |
0 |
30175 |
0 |
0 |
0 |
LRU |
This is what the columns mean:
- Iface: The name of the interface. The
enp0s3interface is the network interface to the outside world, and thelointerface is the loopback interface. The loopback interface enables processes to intercommunicate within the computer using networking protocols, even if the computer is not connected to a network. - MTU: The Maximum Transmission Unit (MTU). This is the largest “packet” that can be sent. It consists of a header containing routing and protocol flags, and other metadata, plus the data that is actually being transported.
- RX-OK: The number of packets received, with no errors.
- RX-ERR: The number of packets received, with errors. We want this to be as low as possible.
- RX-DRP: The number of packets dropped (i.e., lost). We also want this to be as low as possible.
- RX-OVR: Number of packets lost due to overflows when receiving. This usually means that the receiving buffer was full and could not accept any more data, but more data was received and had to be discarded. The lower this figure, the better, and zero is perfect.
- TX-OK: The number of packets transmitted, with no errors.
- RX-ERR: The number of packets transmitted, with errors. We want this to be zero.
- RX-DRP: The number of packets dropped when transmitting. Ideally, this should be zero.
- RX-OVR: The number of packets lost due to overflows when transmitting. This usually means the send buffer was full and could not accept any more data, but more data was was ready to be transmitted and had to be discarded.
- Flg: Flags. See the flags table below.
The flags represent the following:
- B: A broadcast address is in use.
- L: This interface is a loopback device.
- M: All packets are being received (i.e., in promiscuous mode). Nothing is filtered or discarded.
- O: Address Resolution Protocol (ARP) is turned off for this interface.
- P: This is a Point-to-Point (PPP) connection.
- R: The interface is running.
- U: The interface is up.
List Multicast Group Memberships
Simply put, a multicast transmission enables a packet to be sent only once, regardless of the number of recipients. For services such as video streaming, for example, this increases the efficiency from the sender’s point of view by a tremendous amount.
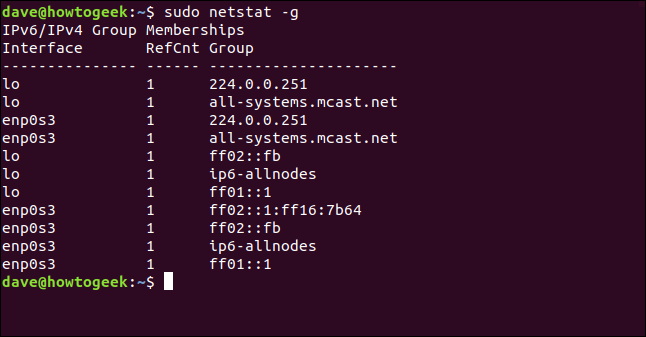
The -g (groups) option makes netstat list the multicast group membership of sockets on each interface.
sudo netstat -g
The columns are quite simple:
- Interface: The name of the interface over which the socket is transmitting.
- RefCnt: The reference count, which is the number of processes attached to the socket.
- Group: The name or identifier of the multicast group.
The New Kids on the Block
The route, ip, ifconfig, and ss commands can provide a lot of what netstat is capable of showing you. They’re all great commands and worth checking out.
We’ve focused on netstat because it is universally available, regardless of which Unix-like operating system you’re working on, even the obscure ones.


