The htop system monitor program gives you clear insights into the processes running on your Linux computer, and some functions to manage those processes. Here’s how to use this colorful administrative tool.
Just top With a Facelift?
htop’s mission is to be a better top. Like top, htop has a dashboard area above a table of processes. Fans of htop appreciate its use of color, its animated bar graphs, and seeing the complete command line for each process.
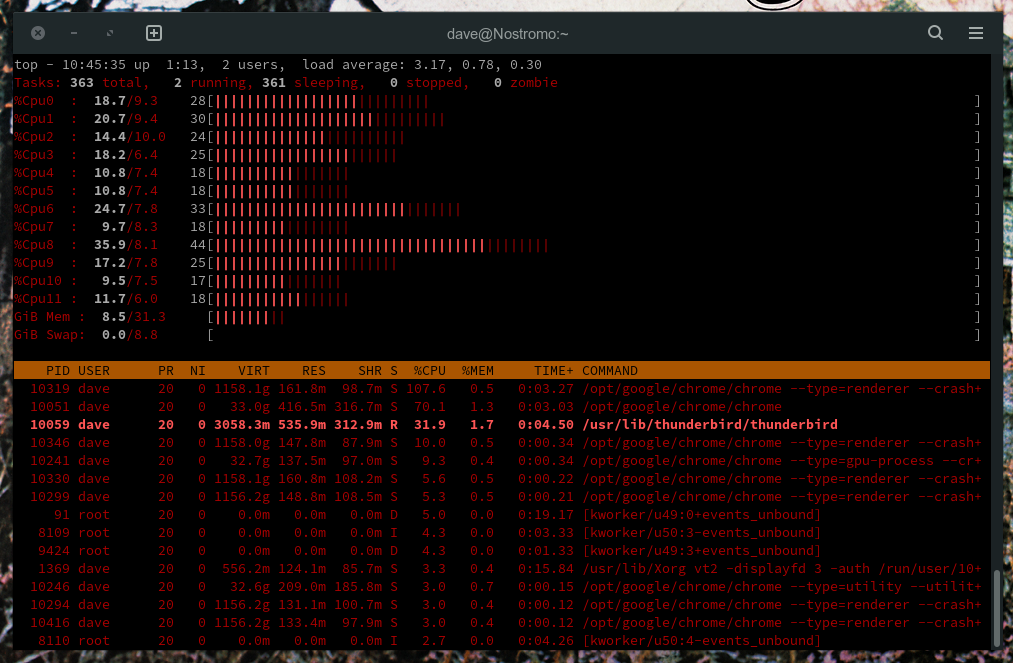
You can get a similar effect in top. Press z to go into color mode, press t to graph the CPU load, press 1 to show all CPU cores, and press m to graph RAM usage. Pressing c displays the full command line for each process.
So does that mean top can do everything htop can? No, not at all. There’s a lot more to htop than pretty colors and graphs.
Installing htop
You’ll probably need to install htop. On Ubuntu, type:
sudo apt install htop On Fedora, the command is:
sudo dnf install htop On Manjaro, you’ll use pacman:
sudo pacman -S htop Because htop is a terminal application it’s great for monitoring remote servers. You can SSH onto a remote computer, fire up htop, and keep an eye on its performance.
To start htop, type its name and hit Enter.
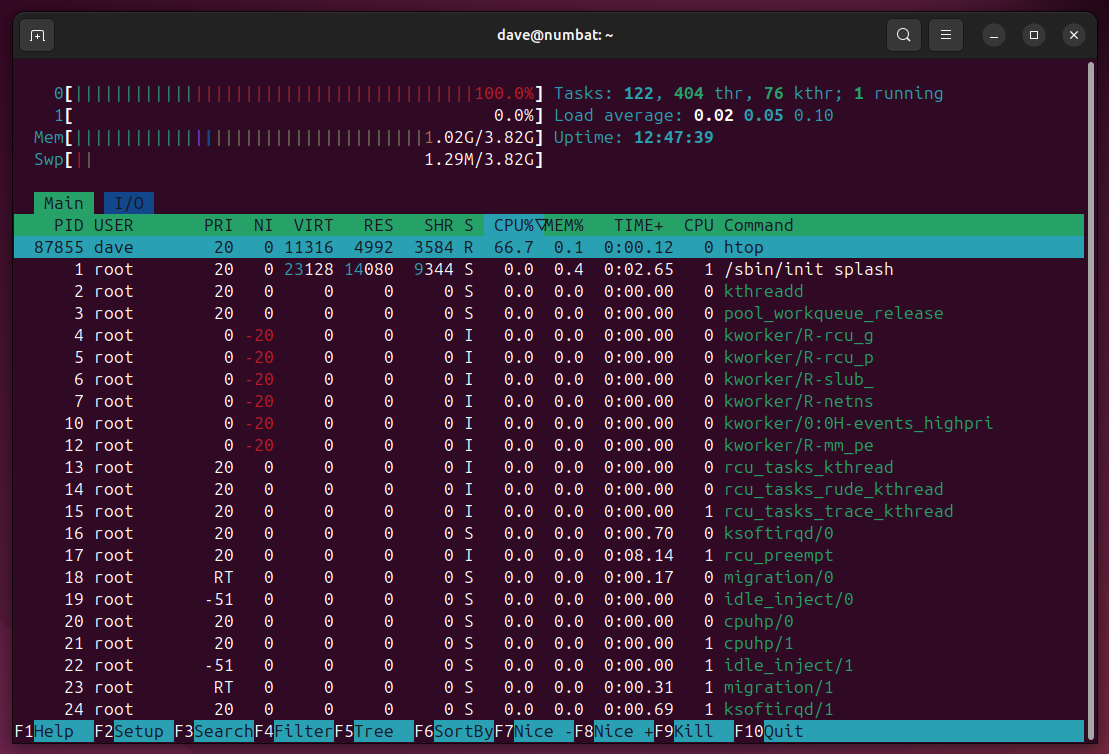
htop You’ll see htop’s default display.
The top area is called the Header Area. The lower pane is the Screen Area. htop can display a process screen or an I/O screen. The process screen is the default view.
The Header Area displays information providers called meters. The default meters are a graph for each CPU core, a graph of memory usage, and a graph of swap usage.
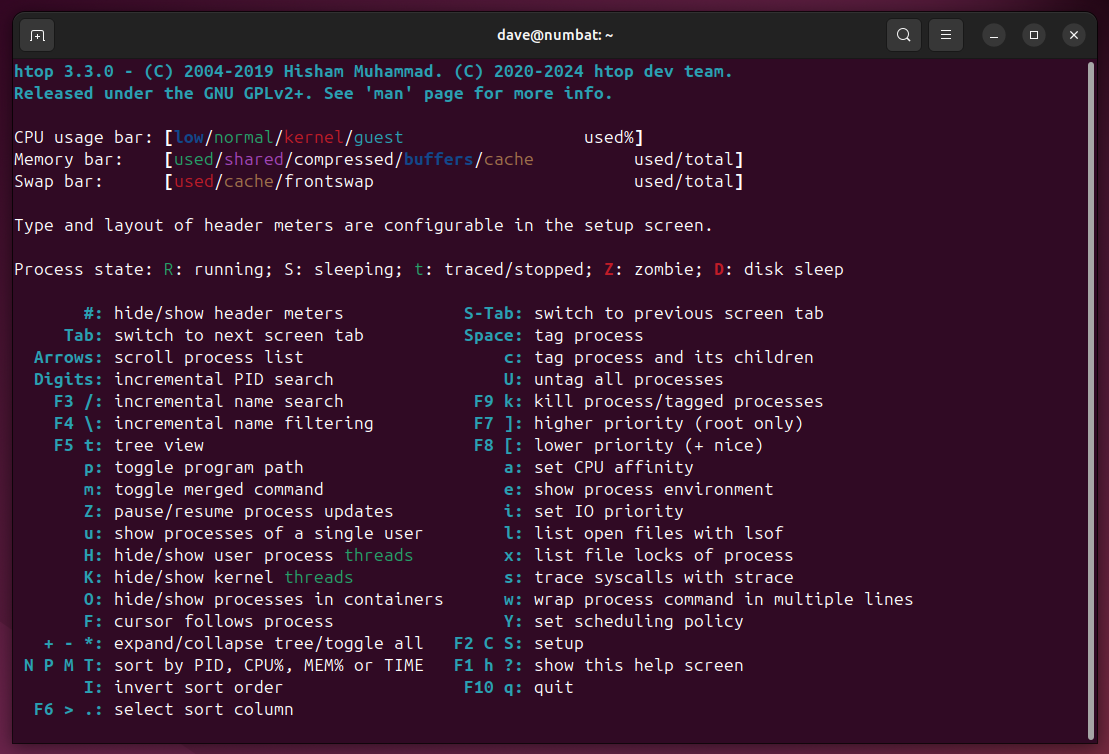
The CPU meter colors represent:
- Blue: Low-priority processes
- Green: Normal user processes
- Red: Kernel processes
- Yellow/Orange: Guest time, also called virtual time. It’s the CPU time devoted to running virtual machines
The Memory meter colors represent:
- Green: Used memory
- Magenta: Shared memory
- Grey: Compressed memory
- Blue: Memory used by buffers
- Yellow/Orange: Memory used as cache
The Swap meter colors represent:
- Blue: Used swap
- Yellow/Orange: Swap used for cache
- Grey: Frontswap. This is the memory taken up by compressed RAM pages. Instead of a costly swap write, where possible, unused pages are compressed. This saves less RAM than a complete swap write out, but it operates much faster. Not all systems have this enabled
There are three numerical meters.
- Tasks: Lists the number of tasks and threads, the number of kernel threads, and the number of running tasks
- Load average: The average CPU load over the past minute, 5 minutes, and 15 minutes
- Uptime: The elapsed time since the last power on of the computer
The Process Screen
The Process Screen displays a sorted, dynamic list of system processes. By default, it is sorted by CPU usage, in descending order.
The column headings are:
- PID: The process ID number
- USER: The process owner
- PRI: The process priority
- NI: The process niceness. The higher the nice value, the more likely it is that resources from the process will be allocated to other processes.
- VIR: The virtual memory the process is using
- RES: The physical memory the process is using
- SHR: The shared memory the process is using
- S: The current process state
- CPU%: The percentage of CPU time the process is using
- MEM%: The percentage of memory the process is using
- TIME+: The total CPU time the process has used since it was launched
- Command: The command line that launched the process
The process state in the S column can be:
- R: Running
- S: Sleeping
- D: Disk sleep. A form of sleep that can’t be interrupted because of process disk activity
- t: Stopped by trace debugger
- Z: Zombie process
Mouse Integration
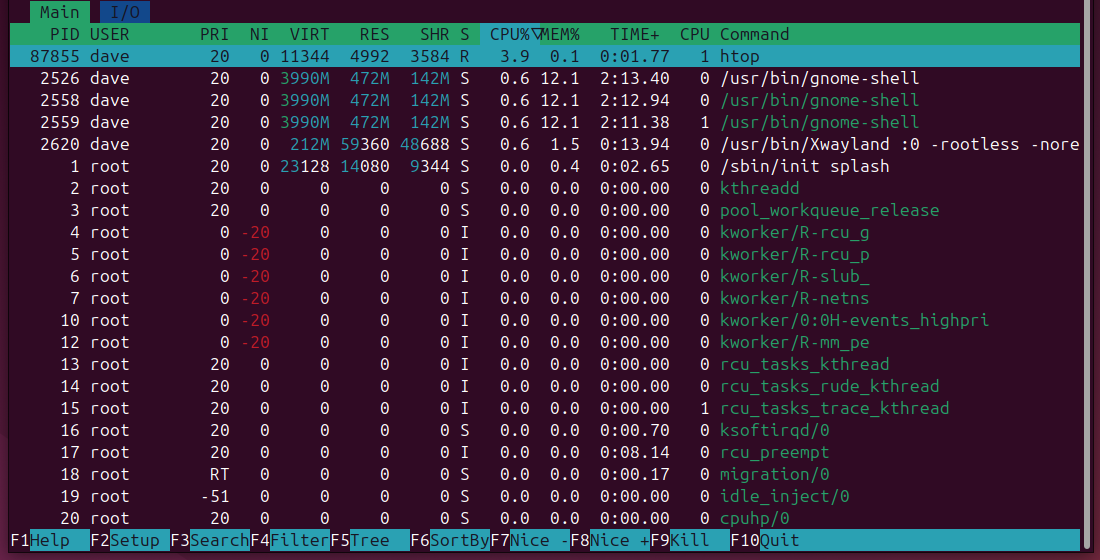
htop can be controlled by key presses or mouse clicks. Clicking on a column heading sorts the task screen by that column. The title of the selected column has a blue background color, and a triangular indicator appears alongside the column name.
If it points up, it means sort is in ascending order. If it points down, sorting is in descending order. Clicking the same column two or more times toggles the sort direction.
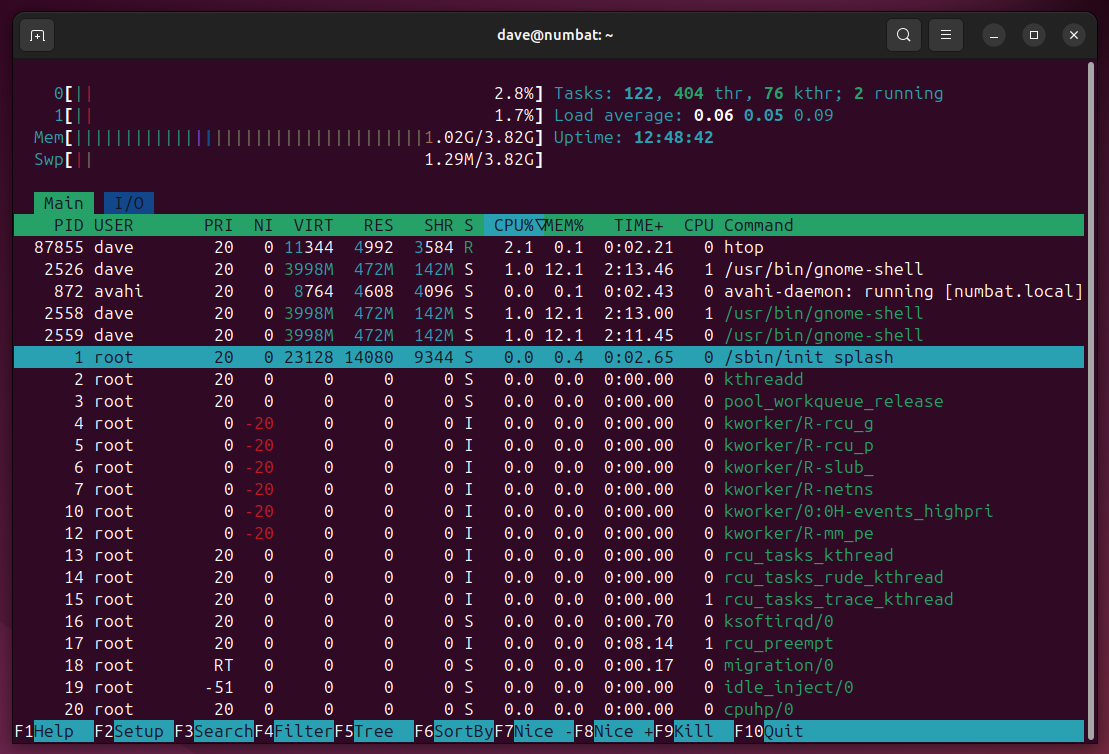
You can highlight a process by clicking on it, or by using the Home, End, PageUp, PageDown and Arrow keys.
Function Keys
There’s a list of functions keys and their actions at the bottom of the screen. Pressing a function keys or clicking on one of the blue labels performs the action.
These function keys work on the selected process:
- F7: Reduce its niceness
- F8: Increase its niceness
- F9: Kills the process
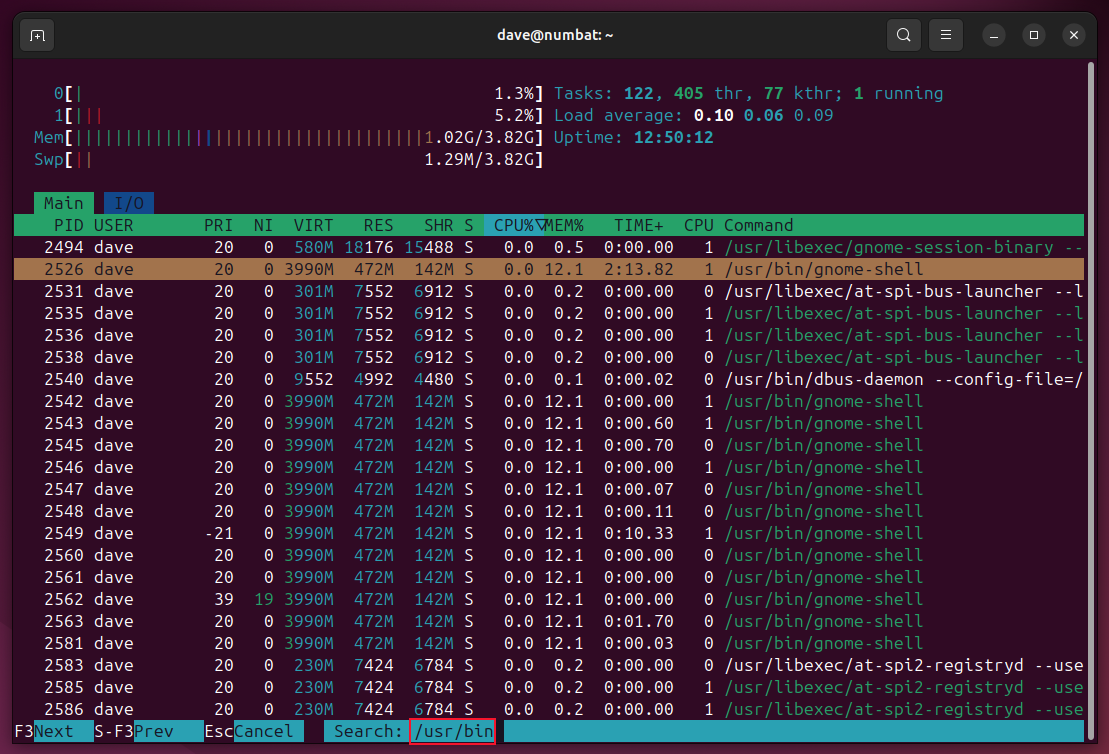
The F3 key searches for processes by name. Having found a match, F3 finds the next match and Shift+F3 finds the previous match.
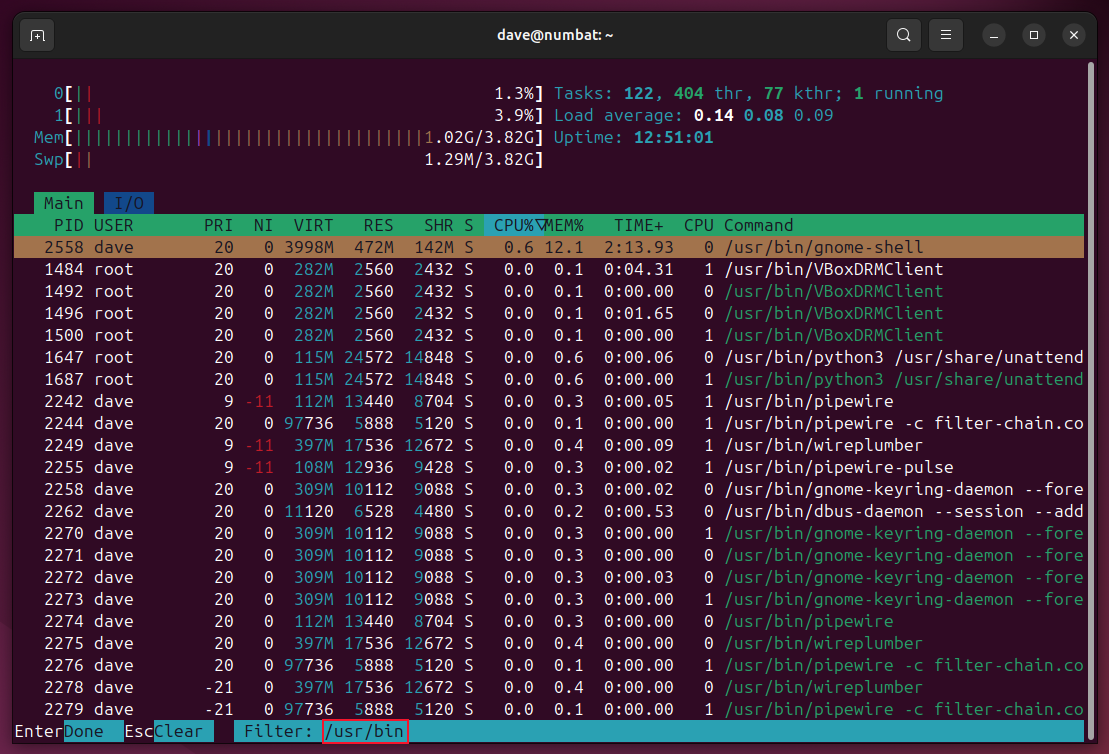
F4 allows you to filter the processes. I pressed F4, and entered “/usr/bin.”
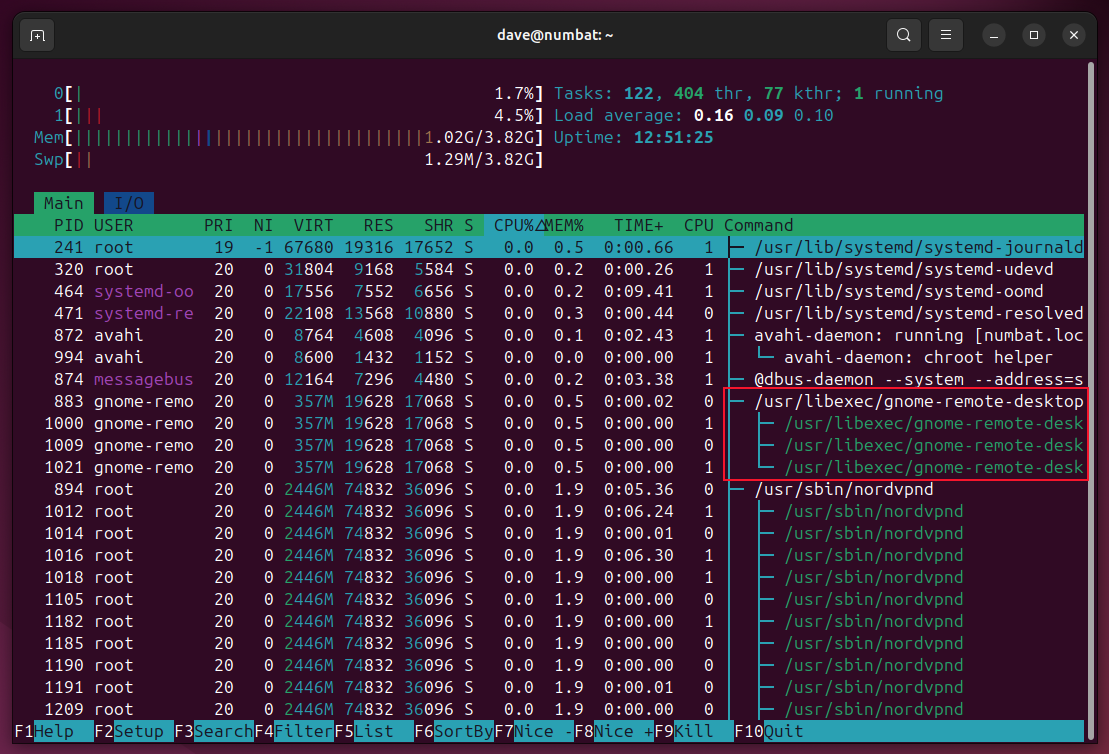
F5 toggles a tree displaying the relationship of parent and child processes.
F10 (or q) will quit htop and return you to the command prompt in the terminal window.
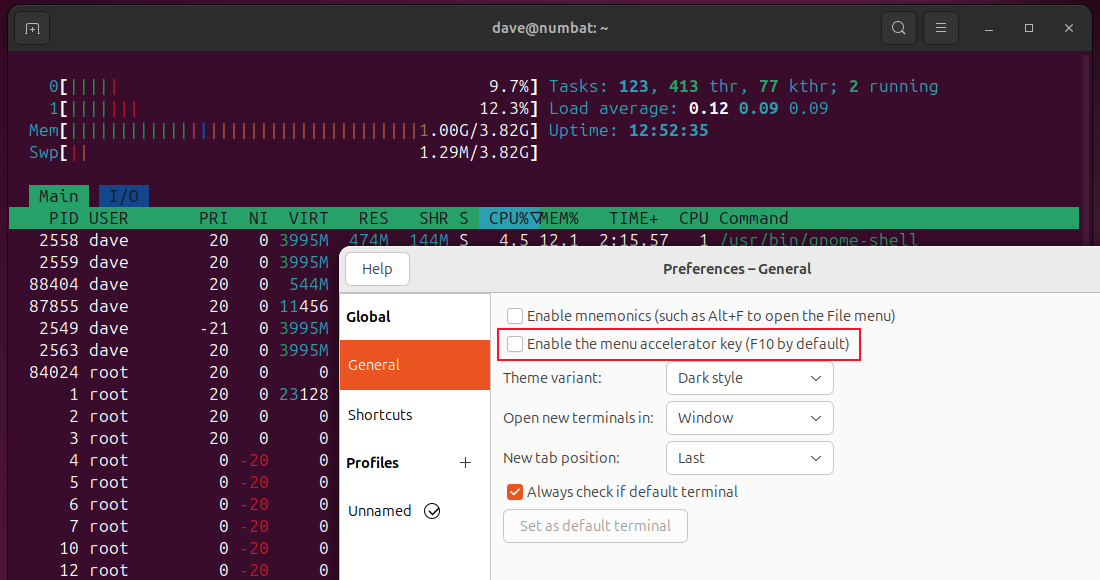
My terminal window trapped the F10 key for its own use. I had to deselect the Enable the Menu Accelerator Key (F10 by Default) option in my terminal’s preferences before the F10 keystroke was passed to htop.
The F1 key shows a help screen explaining the meter colors, process states, and keyboard shortcuts.
The I/O Screen
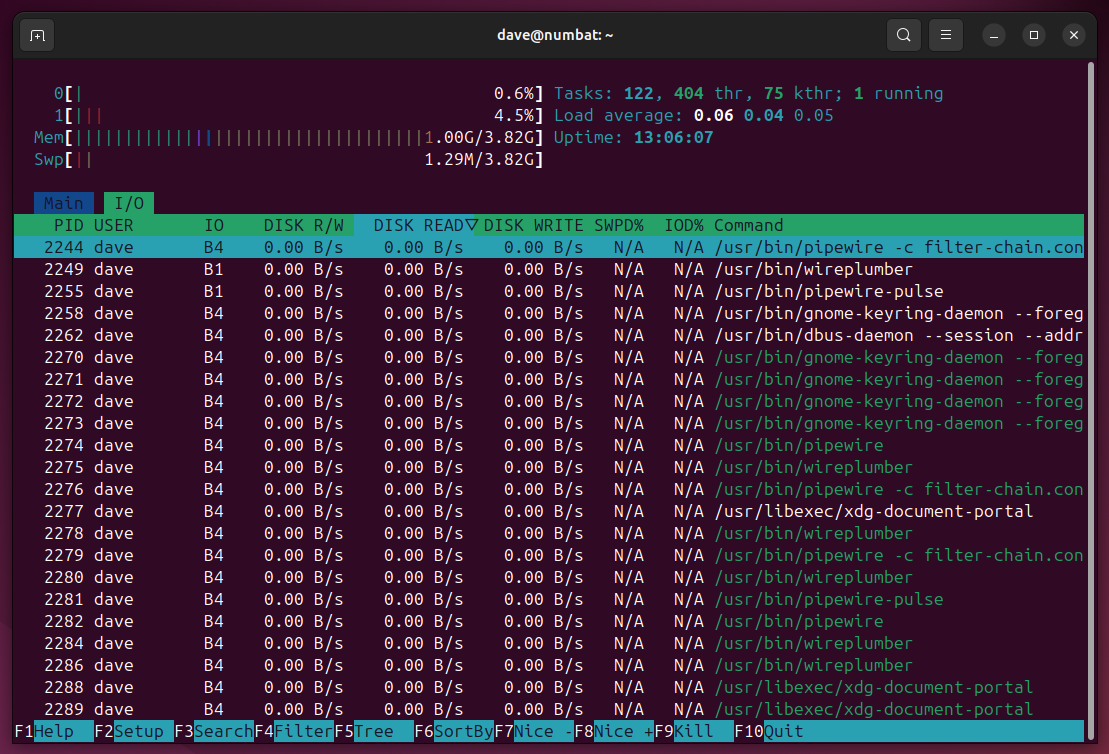
You can move to the I/O screen by pressing Tab, or clicking on the I/O tab located just above the column headers.
The I/O screen columns are:
- PID: The process ID number
- USER: The process owner
- IO: The IO scheduling class, and priority. The class can be R for real-time, B for best effort, or id for idle.
- DISK R/W: The combined speed of disk reads and writes
- DISK READ: The disk reading speed in bytes per second
- DISK WRITE: The disk writing speed in bytes per second
- SWPD%: The time spent swapping in pages, as a percentage
- IOD%: Time spent waiting for the completion of synchronous block I/O, as a percentage
- Command: The command line that launched the process
Configuration
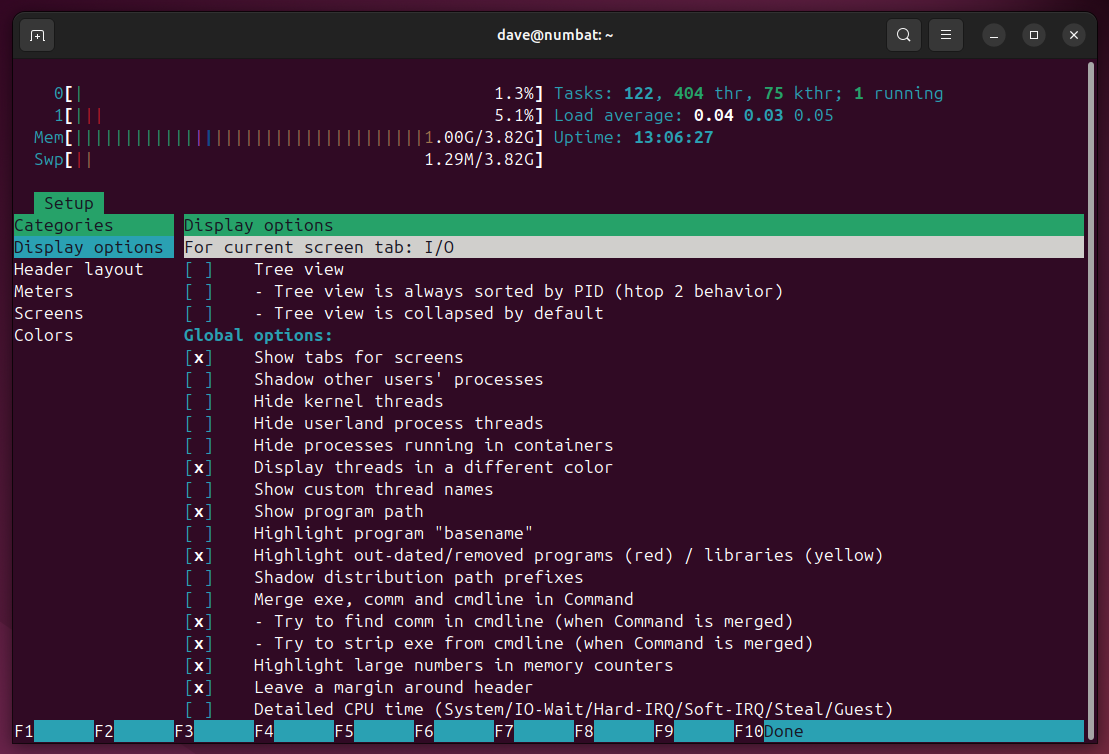
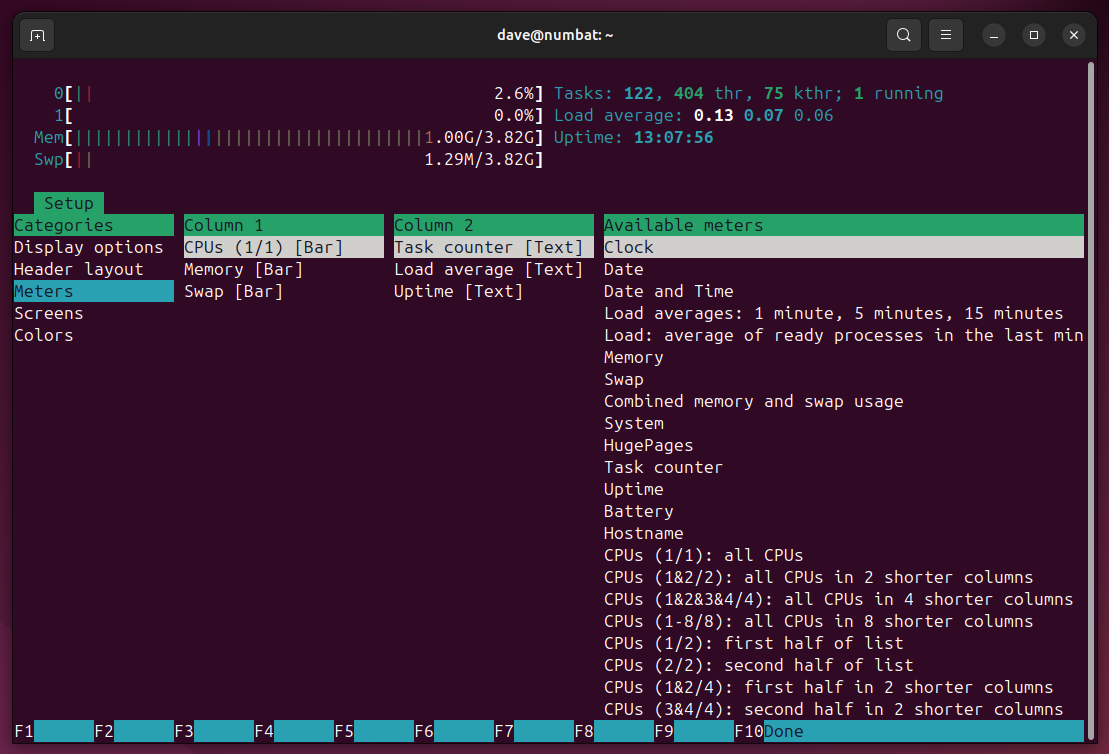
Press F2 to enter Setup. You can configure display options, header layout, meters, screens, and colors. Move the highlight in the Categories column to access the different configuration categories. You can use the Arrow keys, or click one of the categories.
Display Options
The Display Options screen lets you toggle different features on or off by selecting and deselecting check boxes.
Changes to the header area meters take effect immediately.
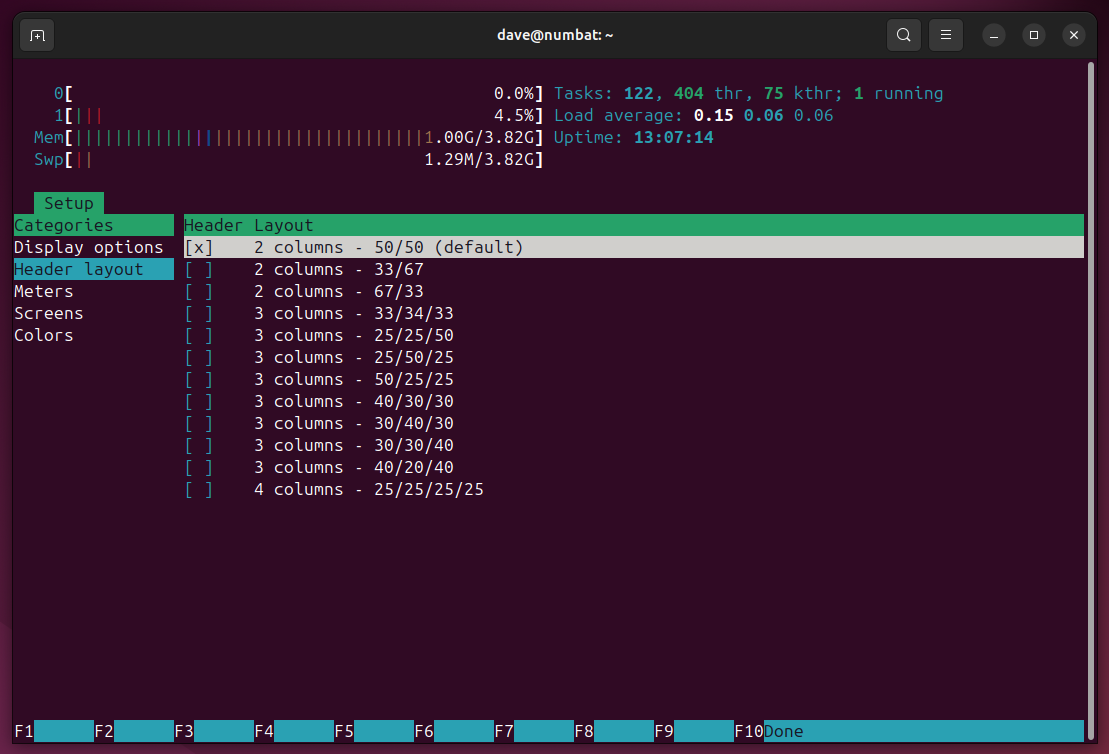
The Header Layout screen lets you set the number of header area columns, and their proportional widths.
The default is two columns, each taking 50% of the screen width.
Meters
The Meters screen lets you choose which meters are displayed in the header area. The display shows as many column as you selected in the Header Layout screen, and a column of Available Meters.
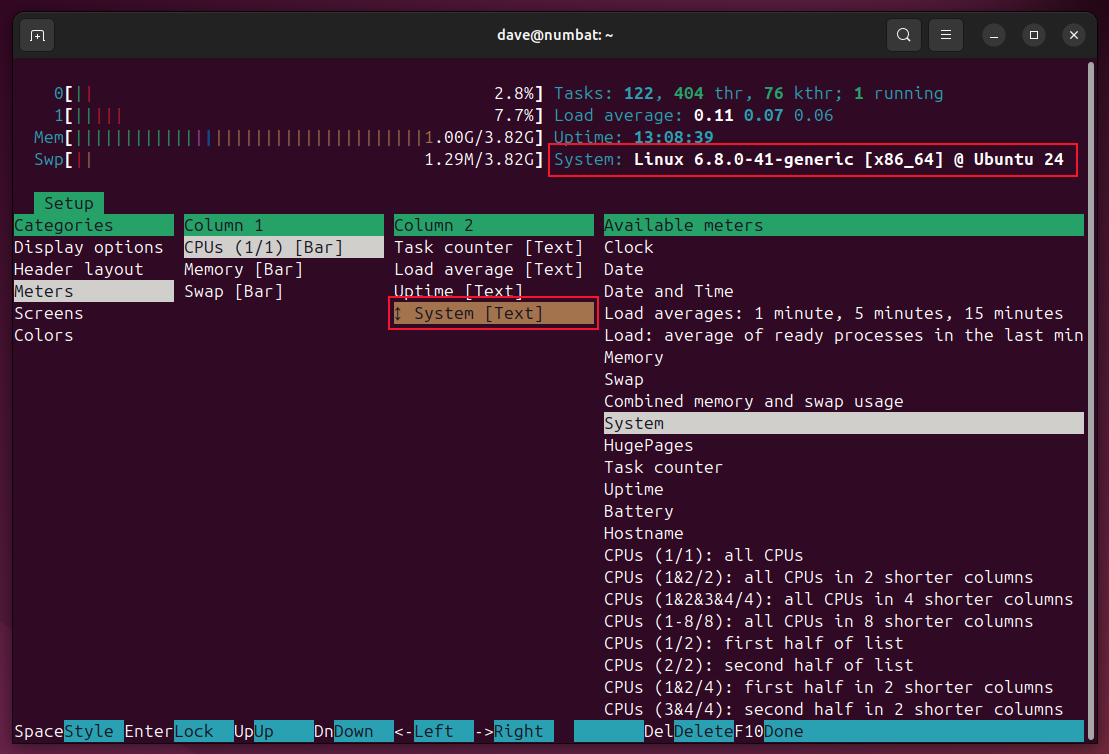
To add a meter to a column, click one of the entries in the Available Meters column, and press Enter. I did this with the System list entry.
A new entry appears in the Column 2 column, highlighted in brown. The new meter also appears in the Header Area.
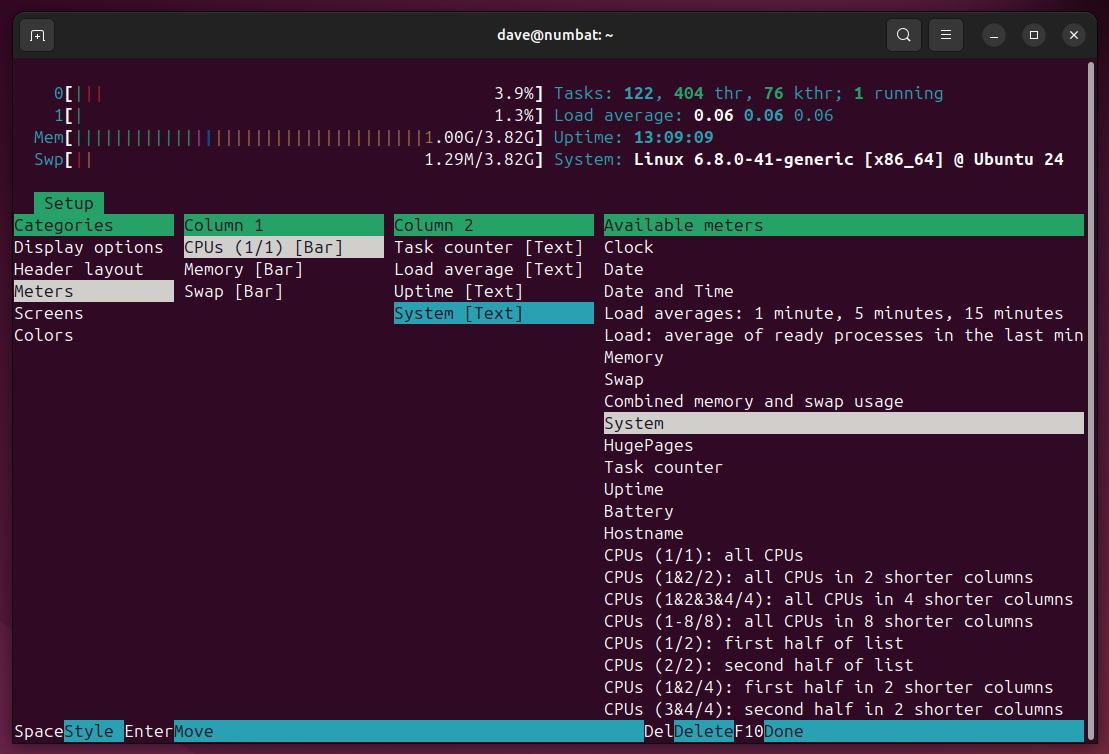
You can move the new entry up and down in its column, or to the column left or right, using the Arrow Keys. When you have it in the position you want, press Enter again to lock it in place.
Highlighting a meter in one of the columns and:
- Pressing Del: Deletes it
- Pressing Enter: Lets you move it up, down, or from column to column, using the Arrow keys
- Pressing Space: Changes its appearance. Most Meters can be displayed as one or more types of graph, numerically, or in large digits, like an LED display.
Here’s the Memory meter displayed numerically:
Here it is as a time-based graph:
And finally, in a large LED-style font:
Screens
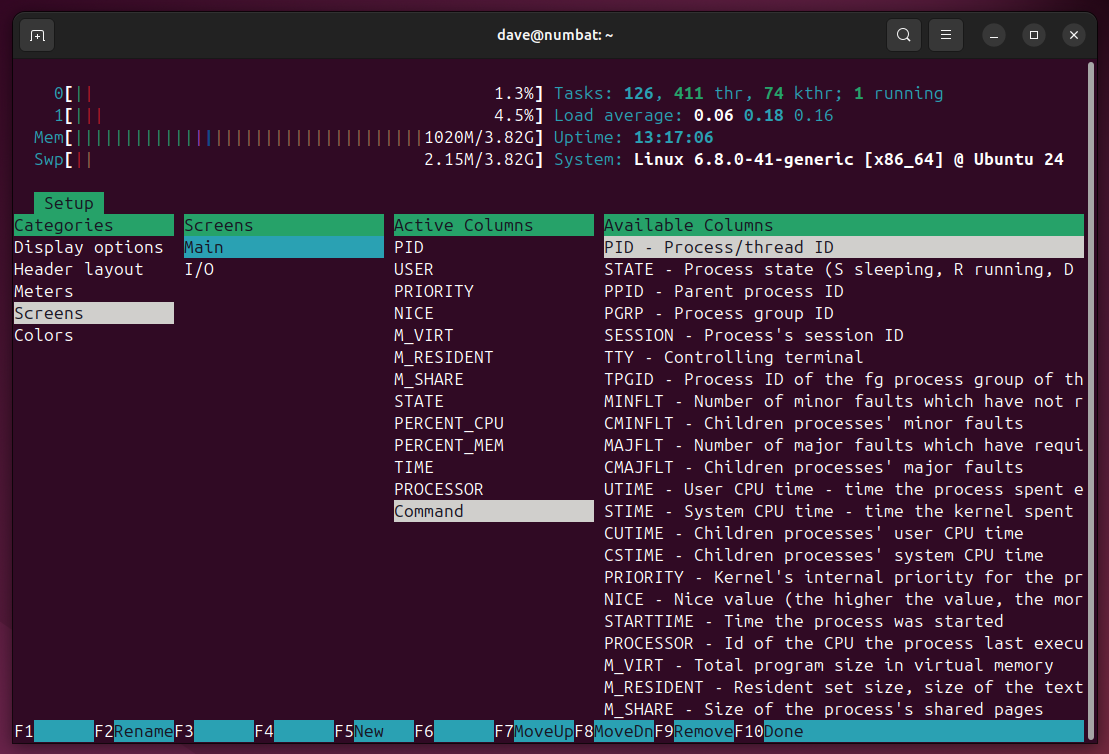
The Screens setup screen works similarly to the Meters setup screen.
The Screens column lets you select either the main process screen or the I/O screen.
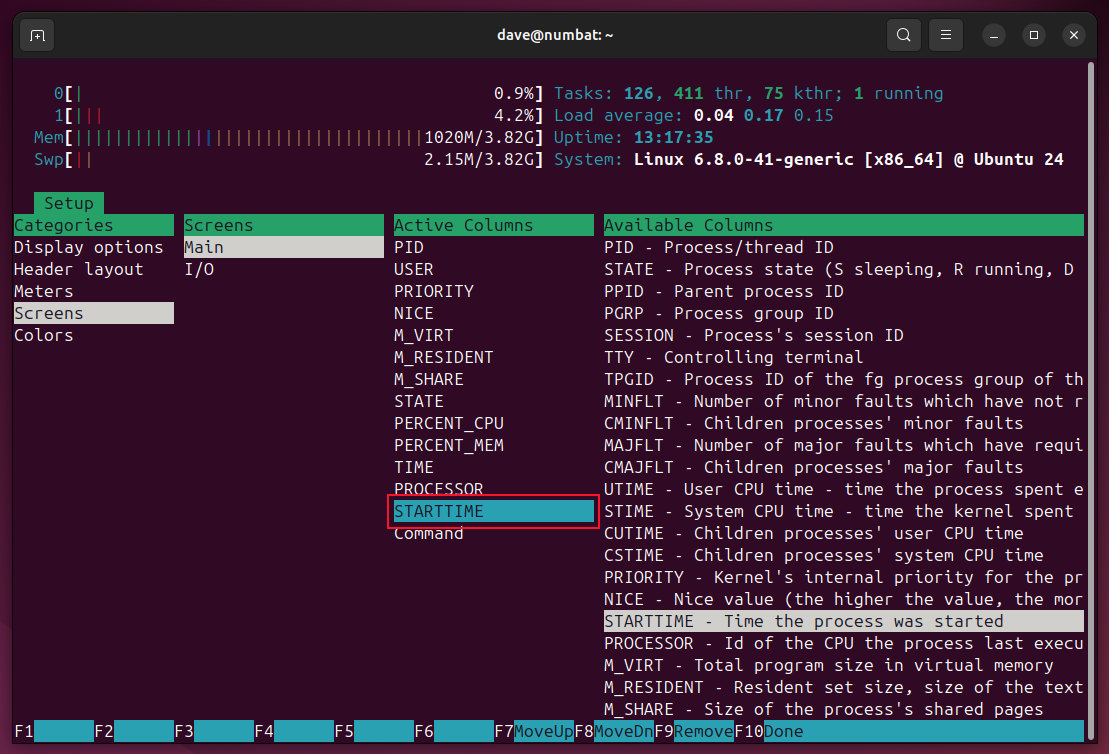
Highlighting an entry in the Available Columns column and hitting Enter adds it to the Active Columns column. You can use the Arrow keys to move it, and Enter to lock it in position.
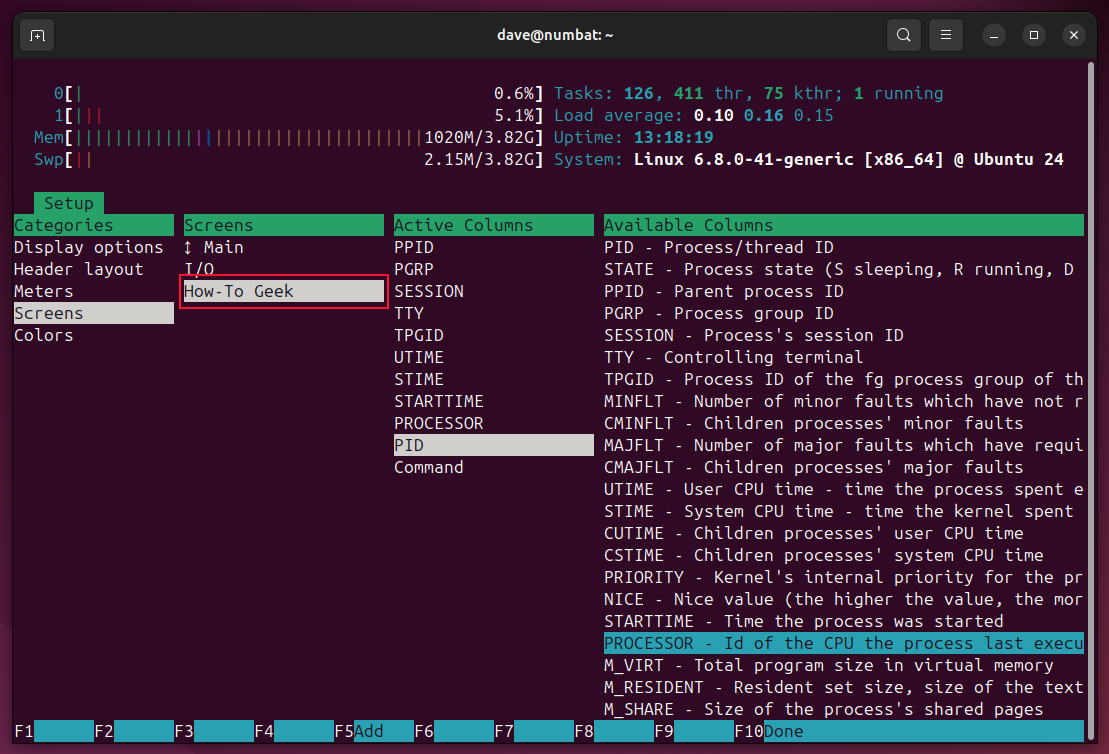
With the highlight in the Screens column, pressing F5 creates a new screen altogether. You can name it and populate it to suit your own needs.
Colors
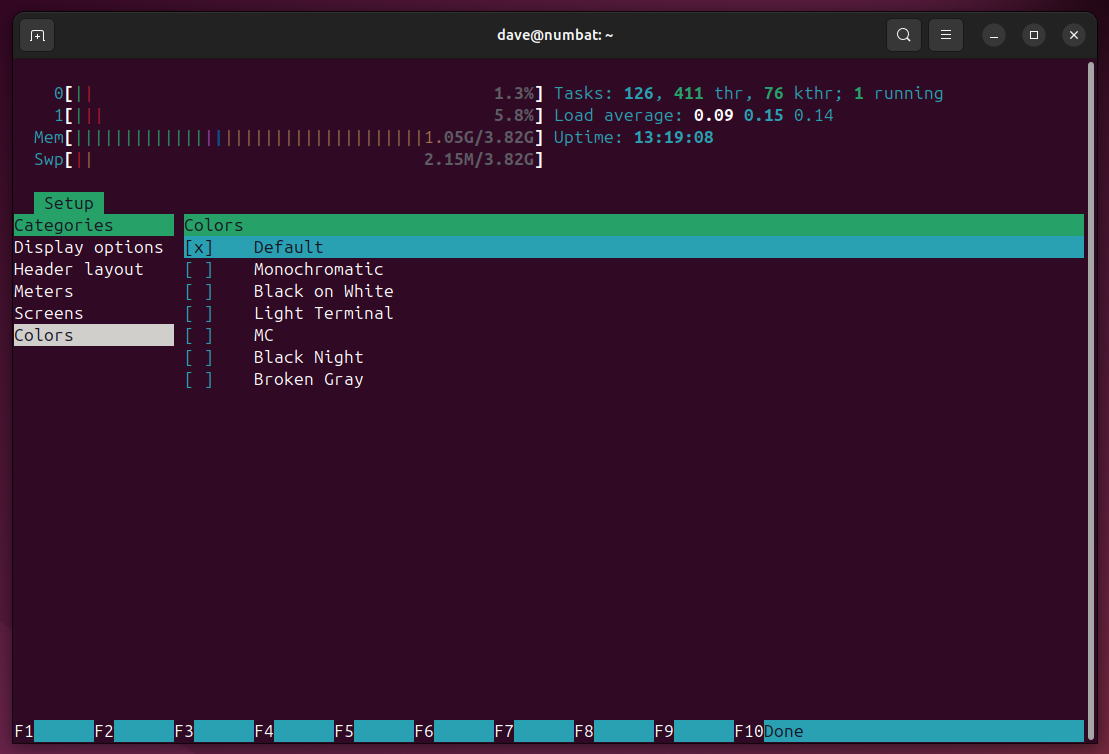
The Colors screen lets you select a color theme.
Clear Updates
The purpose behind the customizations, colors, and graphs is so you can set up htop to clearly display the metrics that matter to you. The easier it is to see them with a quick glance, the easier it is to be aware of the computer’s workload and performance.


