

Intel Core i7-13700K Review
Summary
The Core i7 13700k packs an impressive performance punch. It can easily outperform the last gen’s topper and challenge the likes of the Ryzen 7 7900X. This goes to show the class and performance that this new SKU packs, all thanks to the new architecture benefits. This CPU sits nicely between the i9 13900k and i5 13600k. When we tested the Core i5 13600k, we found that it is easily a best-value gaming CPU from the blue camp. That still holds, but if you want to cash in the extra performance over the gaming, then the Core i7 13700k, with its might and glory yet, is the one.
- Overall Performance – 9/10
- Value – 9/10
- Thermal Performance – 9/10
- Features – 9/10
- Overclocking – 9/10
Pros
- Beats Ryzen 7 7700X in applications.
- Overall Faster than the 12th
- Faster in gaming
- DDR4 and DDR5 support
- 600 and 700 Series chipset motherboards support
- PCI-Express 5.0/4.0 support
- 3GHz All P-Cores Clocks under load
- 2GHz All E-Cores Clocks under load
Cons
- More Power Draw
- High Temperature
We have tested the Intel core i7 13700k, the latest desktop CPU offering from Intel, nicely sitting between the enthusiast-grade core i9 13900k and value addition core i5 13600k. We recently reviewed the core i5 13600k, and it has our praise for the best-value gaming CPU from the blue camp, which is not only fast enough to drive the gaming needs but is also capable of handling other tasks. This is due to the powerful 6 P-Cores with 12 threads and 8 E-Cores operating at high clocks with a good amount of high-speed cache.
This time, we are spinning the mid-range offer from the blue camp. The Intel core i7 13700k has 8 P-Cores with 16 threads and 8 E-Cores. When compared to the Intel core i7 12700k, the number of P-Cores is the same, but there are architectural improvements. However, the E-Cores have been upped from 4 to 8 in the 13700k. As we mentioned in the content of core i5 13600k, Intel is using new “Raptor Cove” cores in the Raptor Lake-S CPUs. These are more powerful cores with increased clock speeds, more cache, and whatnot. As mentioned earlier, there is a +400MHz boost for the core i7 13700k CPUs thanks to fine-tuning the iso-frequency and iso-voltage on the V/F curve.
The hyper-threading is enabled on the core i7 13700k hence we have a thread count of 16 for the P-Cores. There is no multi-threading on the E-Cores. This would effectively make the thread count 24 on this SKU compared to the 20 thread count on the core i7 12700k. The base clock of P-Cores is 3.40GHz, and that of E-Cores is 2.50GHz. The Max Turbo Frequency is 5.4GHz overall. This is a single thread frequency coming from the Turbo Boost Max Technology 3, which is subjective to the thermal and power condition as well as the load type.
The max turbo frequency for the P-Cores is 5.3GHz. The max turbo frequency for the E-Cores is 4.2GHz. The total L2 cache is 24MB, and that of the L3 cache is 30 MB. The processor’s power at base clocks is 125W, whereas it is 253W on the max turbo frequency.
This SKU is using Intel UDH 770 GPU and has a base clock of 300MHz with a boost clock of 1.6GHz. It comprises 32 processing units. The maximum supported resolution using HDMI is 4096×2160 @60Hz. The output resolution on DP is 7680×[email protected] It supports Intel Quick Sync Video and Clear Video HD technology with maximum support of up to 4x displays.
The SKU uses 8 DMI lanes based on DMI 4.0 revision. The PCIe lanes count is 20, with up to 16 lanes for the graphics card and 4 lanes for the supported NVMe SSD. The SKU supports PCIe Gen 4.0 and 5.0. The thermal junction is still at 100°C. The “Raptor Lake” die measures 23.8 mm x 11.8 mm (257 mm² die-area).
Specifications
General Specs
- Architecture: Intel Raptor Lake
- CPU Socket: FCLGA1700
- Former Codename: Raptor Lake
- Lithography: Intel 7
- Total Cores: 16
- No. Of Performance-cores: 8
- No. Of Efficient-cores: 8
- Total Threads: 24
- Intel Hyper-Threading Technology: Yes
- Performance-core Base Frequency: 3.40 GHz
- Efficient-core Base Frequency: 2.50 GHz
- Performance-core Max Turbo Frequency: 5.30 GHz
- Efficient-core Max Turbo Frequency: 4.20 GHz
- Max Turbo Frequency: 5.40 GHz
- Intel Turbo Boost Max Technology 3.0 Frequency: 5.40 GHz
- Unlocked for Overclocking: Yes
- Direct Media Interface (DMI) Revision: 4.0
- Total DMI Lanes: 8
- Scalability: 1S Only
- PCI Express Revision: 5.0 and 4.0
- Total PCI Express Lanes: 20
- PCI Express Configurations: Up to 1×16+4, 2×8+4
- Maximum Operating Temperature (Tjmax): 100°C
- Thermal Monitoring Technologies: Yes
- Processor Base Power: 125 W
- Maximum Turbo Power: 253 W
- Instruction Set: 64-bit
- Instruction Set Extensions: Intel SSE4.1, Intel SSE4.2, Intel AVX2
Memory Specs
- Memory Type: Support DDR5 and DDR4
- Max Memory Size: 128GB
- Max no. of Memory Channels: 2
- Memory Speed:
-
- Up to DDR5 5600 MT/s
- Up to DDR4 3200 MT/s
-
- Max Memory Bandwidth: 89.6 GB/s
- Cache: 30MB Intel Smart Cache
- Total L2 Cache: 24MB
- ECC Memory Supported: Yes
Graphics Specs
- Integrated Graphics: Yes
- Graphics Model: Intel® UHD Graphics 770
- Multi-Format Codec Engines: 2
- Execution Units: 32
- Graphics Base Frequency: 300 MHz
- Graphics Max Dynamic Frequency: 1.60 GHz
- Graphics Output: eDP 1.4b, DP 1.4a, HDMI 2.1
- Max Resolution (HDMI): 4096 x 2160 @ 60Hz
- Max Resolution (DP): 7680 x 4320 @ 60Hz
- Max Resolution (eDP – Integrated Flat Panel): 5120 x 3200 @ 120Hz
- Intel Clear Video HD Technology: Yes
- Intel Quick Sync Video: Yes
Important Technologies
- Processor Technology for CPU Cores: TSMC 10nm FinFET
- Intel Gaussian & Neural Accelerator: 3.0
- Intel Thread Director: Yes
- Idle States: Yes
- Intel Deep Learning Boost (Intel DL Boost): Yes
- Intel Speed Shift Technology: Yes
- Enhanced Intel SpeedStep Technology: Yes
- Intel Turbo Boost Max Technology 3.0: Yes
- Intel Turbo Boost Technology: 2.0
- Intel Volume Management Device (VMD): Yes
Packing and Unboxing
The CPU is shipped inside the blue color-themed paperboard packing box.
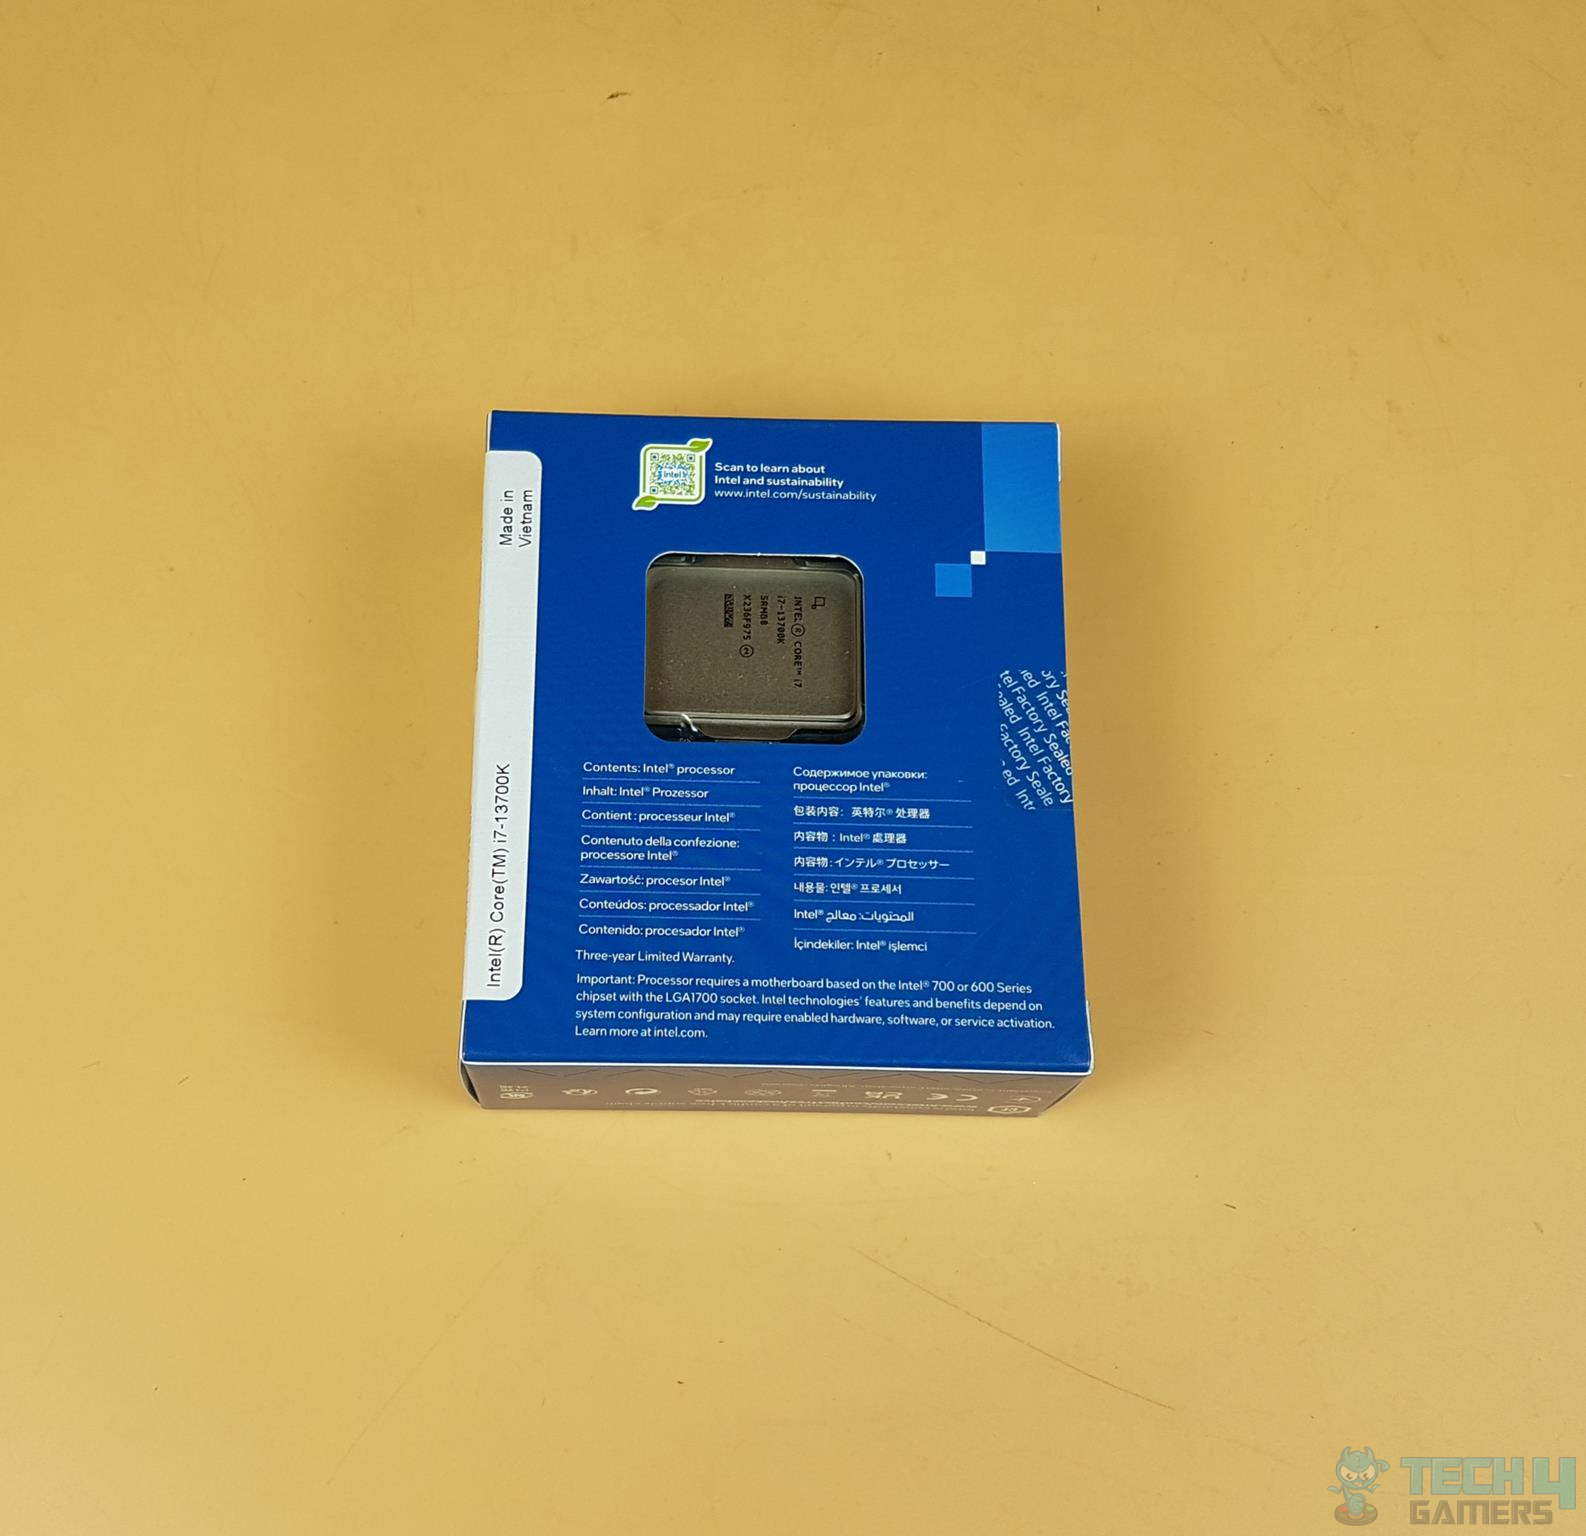
We can spot the IHS of the CPU over here. There is no cooling solution provided with the K/KF series CPUs and the i7 13700k is no exception to that.
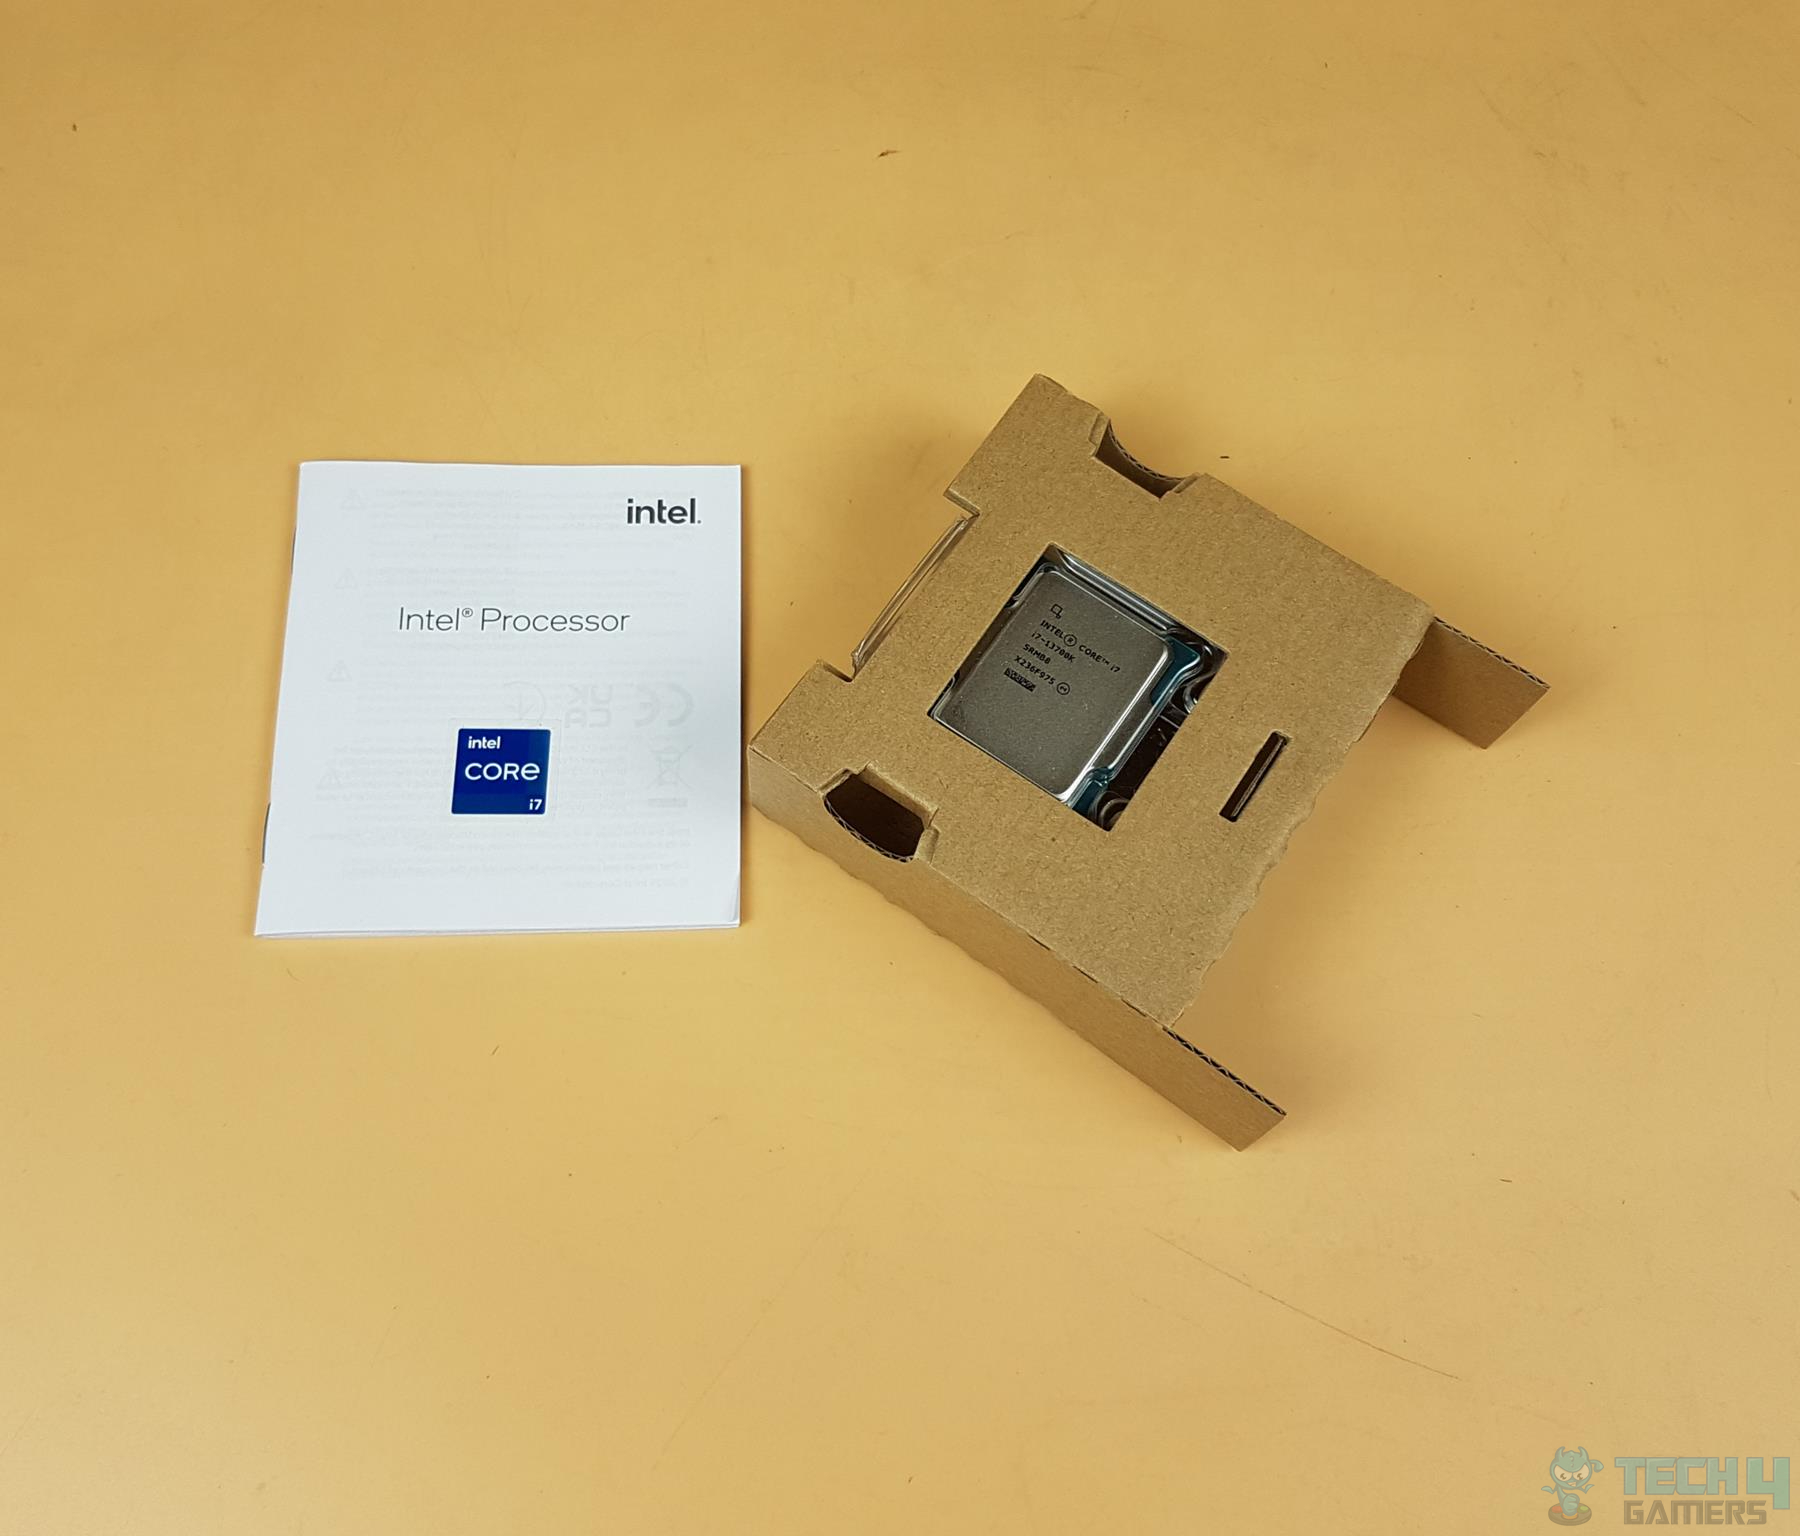
The CPU is safely placed inside a transparent container which is placed inside a cardboard box. There is an information booklet with the Intel logo on it.
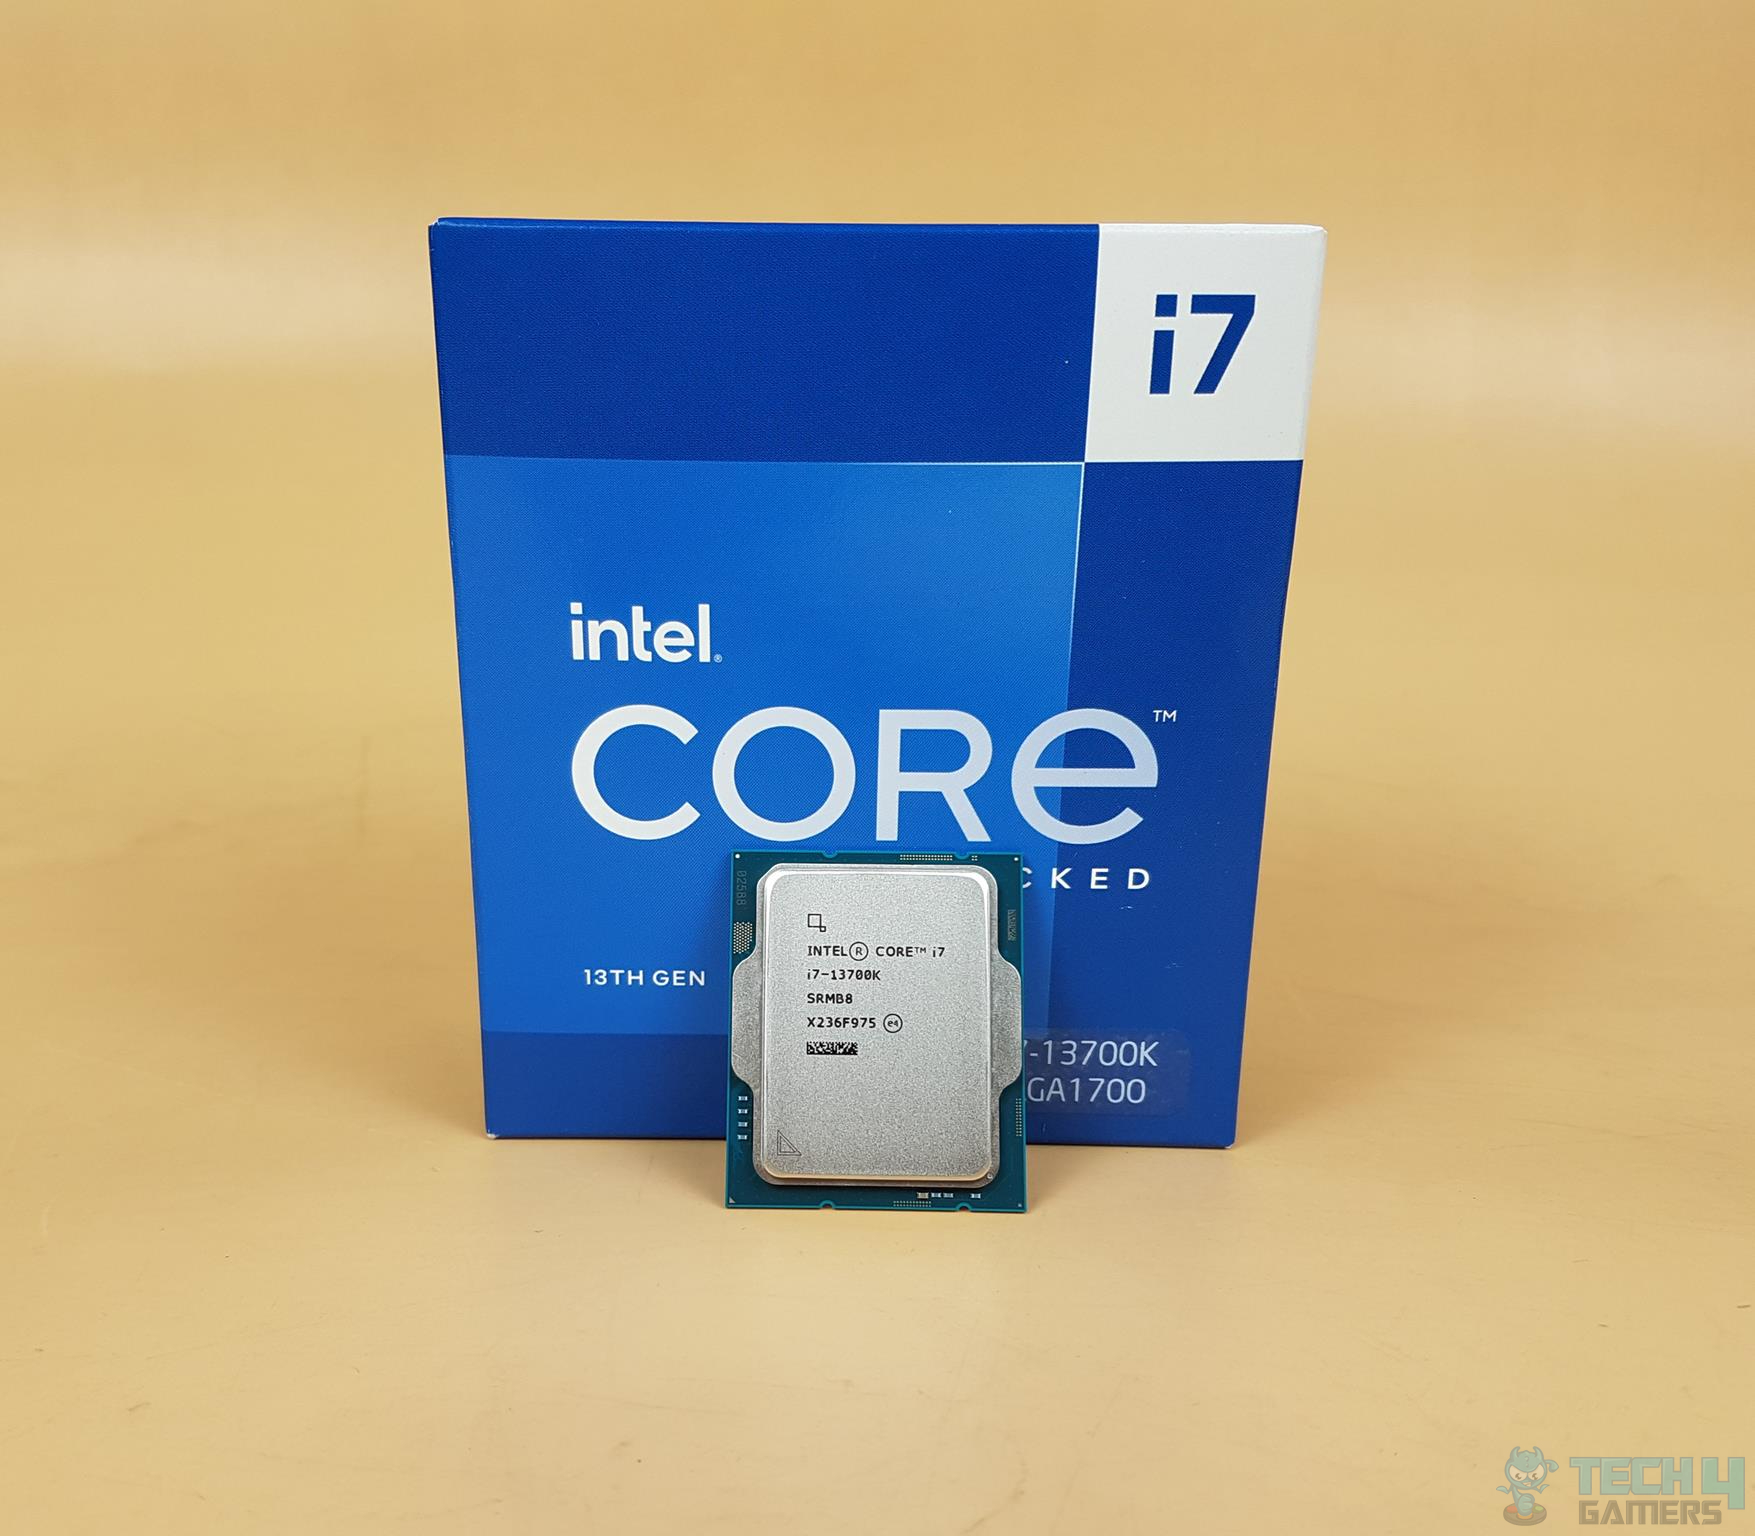
The above picture shows the CPU itself. We have two notches on the top and two on the bottom with an arrow marking on the bottom left corner. These are your hints when installing the cooler in the socket.
The above picture shows the backside of the CPU.
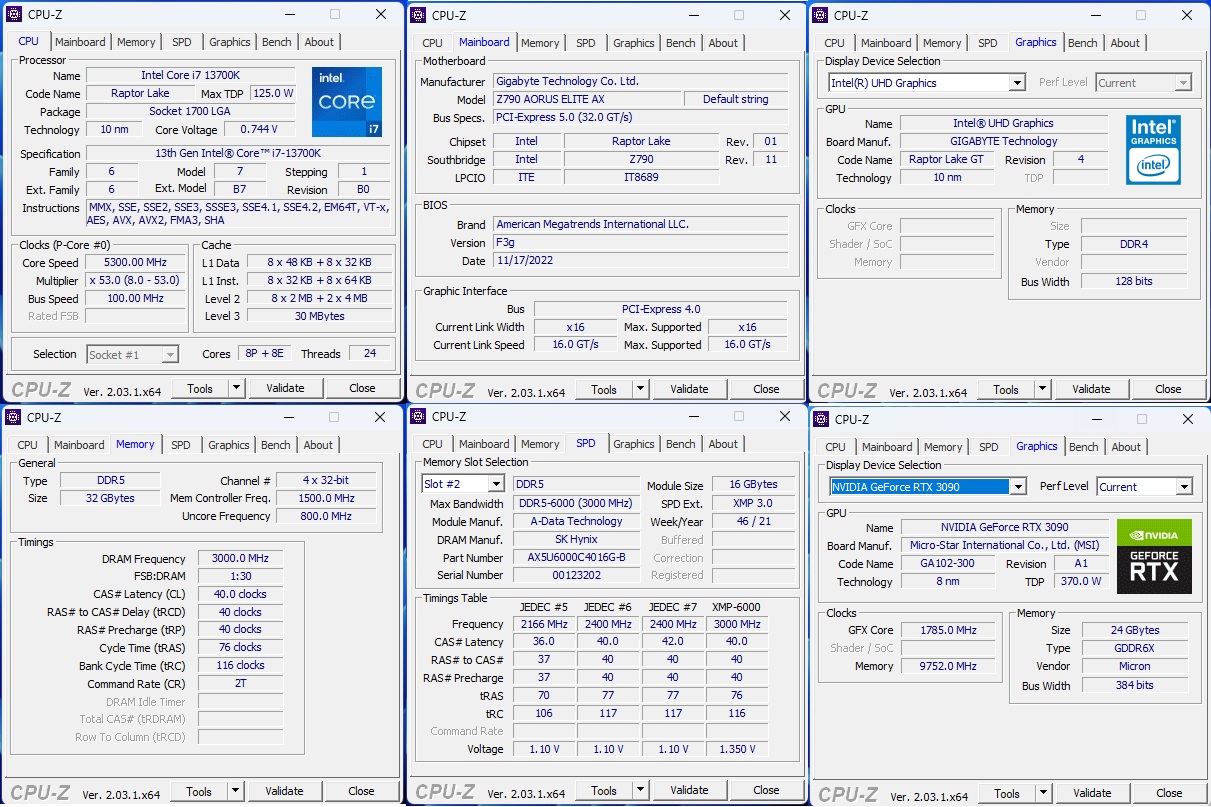
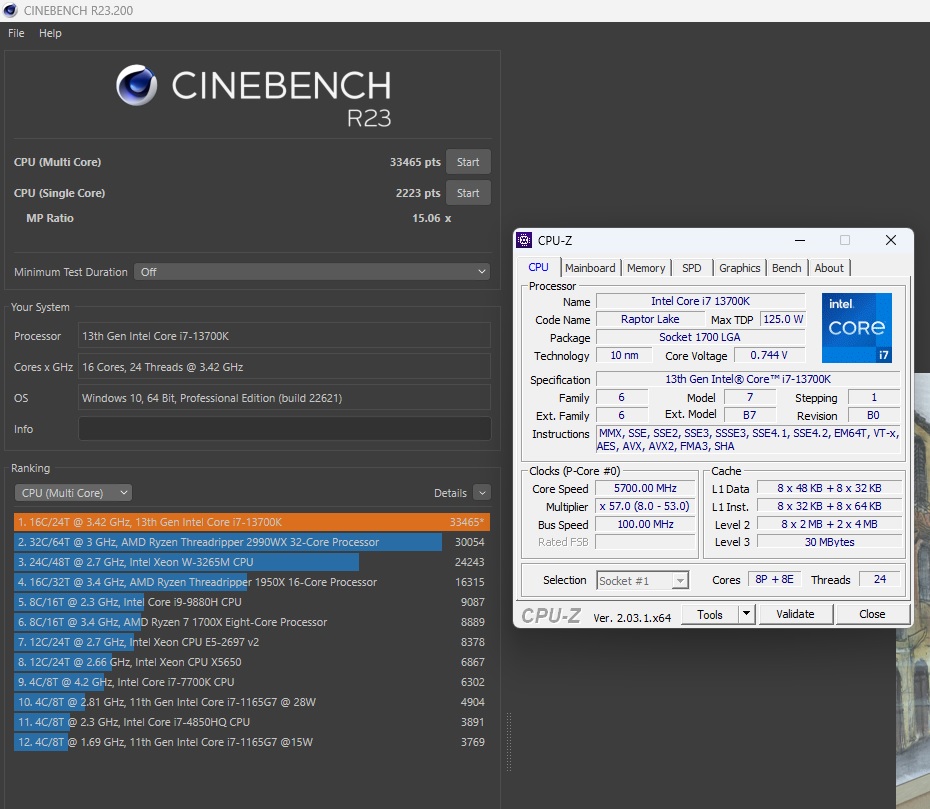
The above picture shows the CPU-Z run from the system. Our sample was boosted to 5.3GHz out of the box. Don’t expect 5.4GHz on the P-Cores right away. The max turbo on the P-Cores is 5.3GHz, and this is what you will get on this SKU under the heavy load. The 5.4GHz boost is for single-threaded applications.
Testing
Following is the configuration of the test benches that have been used for this content.
Intel Z790
- Intel i5 13700k/i5 13600k [Stock, Auto]
- GIGABYTE Z790 AORUS ELITE AX
- XPG Lancer RGB 32GB 6000MHz Kit
- Sabrent Rocket 4 Plus 2TB NVMe SSD
- MSI GeForce RTX 3090 Gaming X Trio
- AlphaCool Custom Loop Setup using 1260mm Radiator with 9x 140mm Fans
- be quiet! Straight Power 11 1000W Platinum
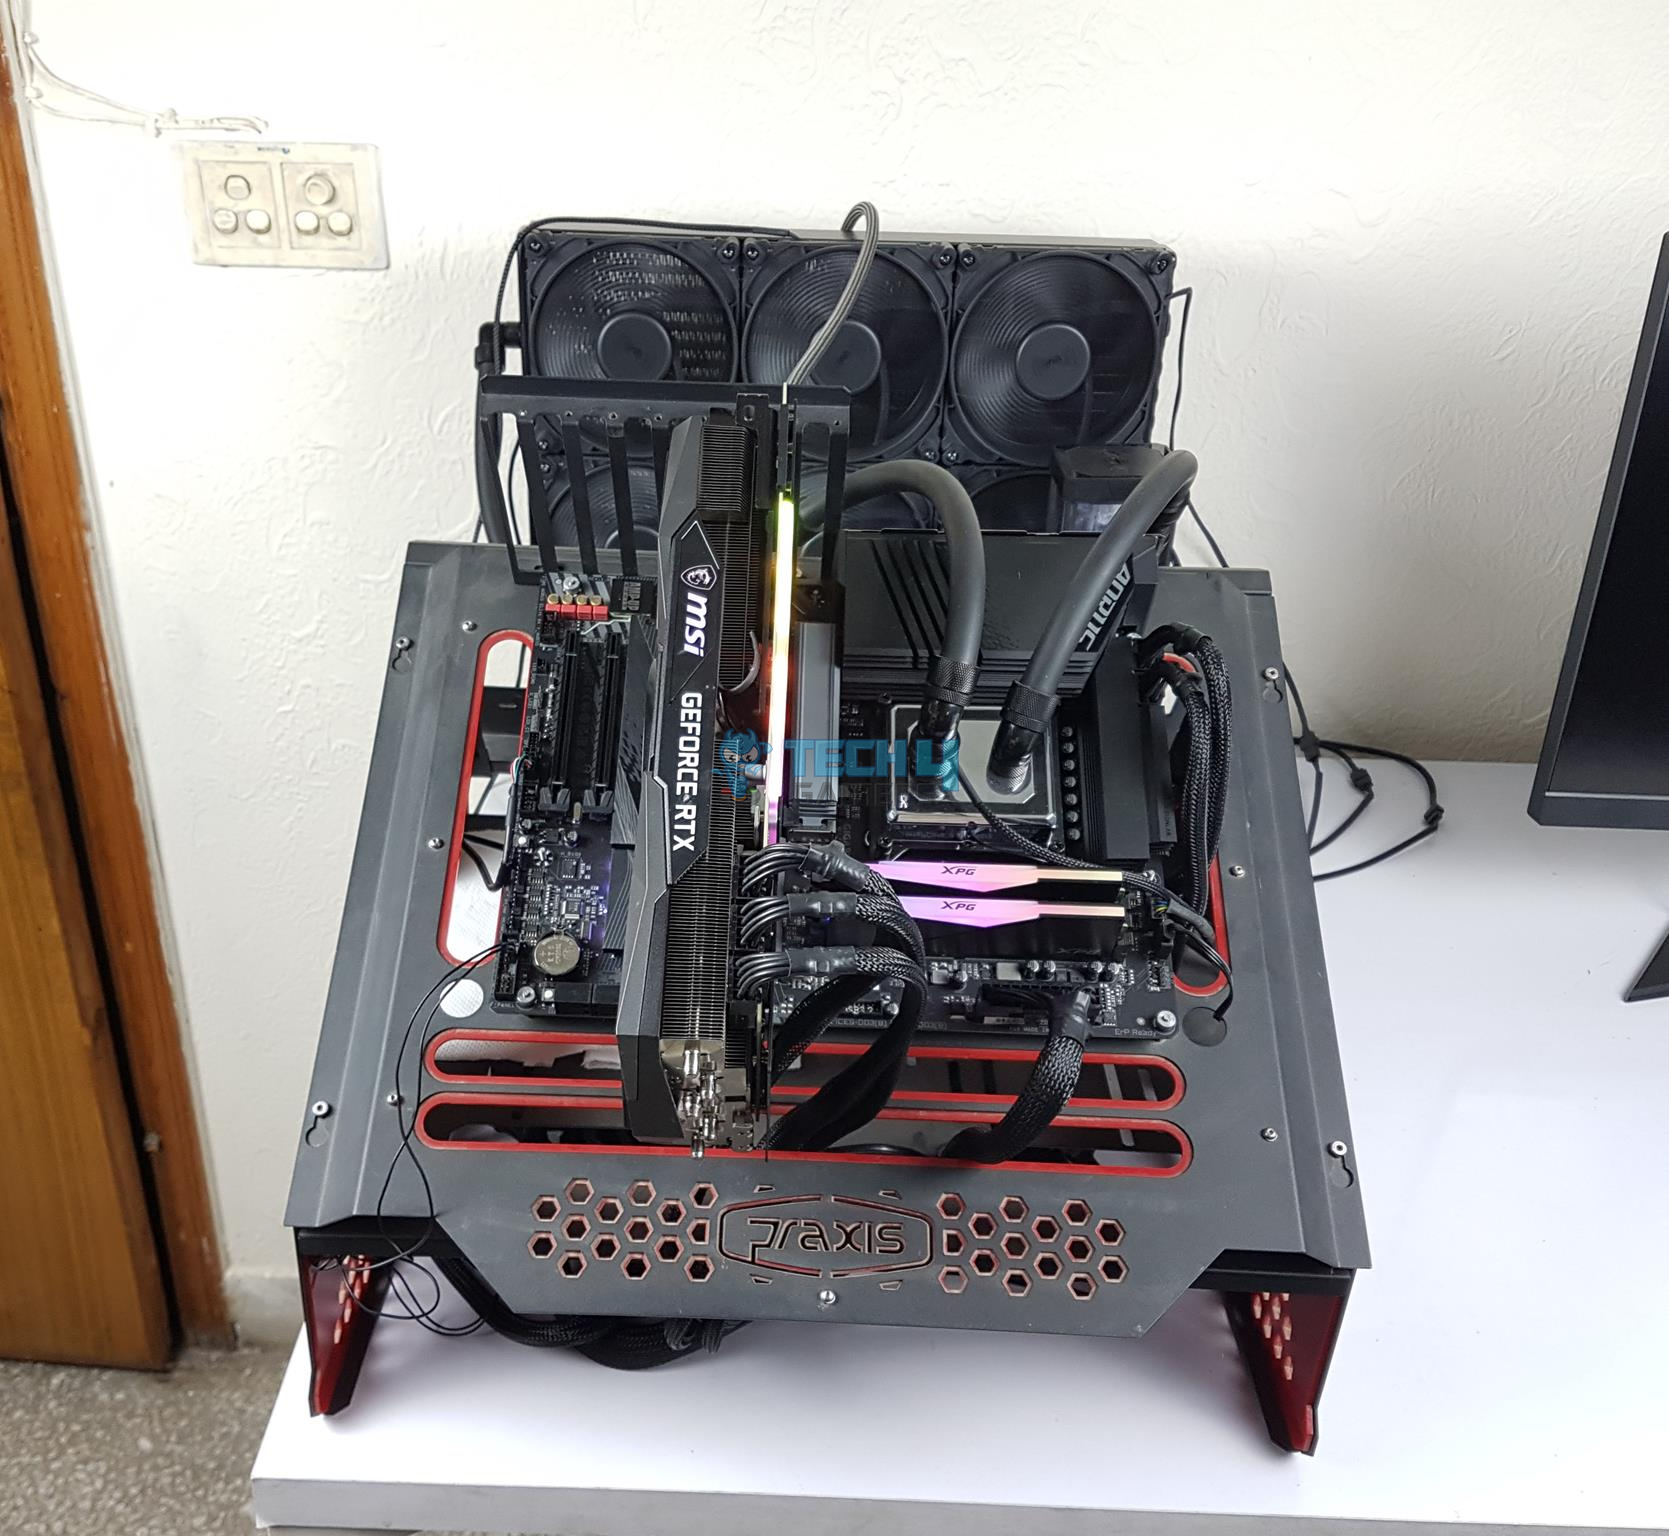
- Praxis Wetbench
AMD X670E
- AMD Ryzen 7 7700X [Stock, Auto]
- GIGABYTE X670E AORUS MASTER
- XPG Lancer RGB 32GB 6000MHz Kit
- Sabrent Rocket 4 Plus 2TB NVMe SSD for data and OS
- Samsung 840 EVO 1TB SSD for Games
- MSI GeForce RTX 3090 Gaming X Trio
- DeepCool LS720 AIO
- be quiet! Straight Power 11 1000W Platinum
- Praxis Wetbench
Intel Z690
- Intel i7 12700k [Stock, Auto]
- GIGABYTE Z690 AERO G
- XPG Lancer RGB 32GB 6000MHz Kit
- Sabrent Rocket 4 Plus 2TB NVMe SSD
- MSI GeForce RTX 3090 Gaming X Trio
- DeepCool LS720 AIO
- be quiet! Straight Power 11 1000W Platinum
- Thermaltake Core P6 TG Snow Edition in an open-frame layout
Intel Z390
- Intel i5 9600k
- Ballistix Elite 16GB @ 3000MHz
- Asus Strix Z390-E Gaming Motherboard
- Asus Ryujin 360 CPU Cooler
- Nvidia GeForce GTX 1080 FE
- HyperX 120GB SSD
- Samsung 840 EVO 1TB SSD
- Thermaltake ToughPower RGB 750 Gold-rated PSU
Intel Z390
- Intel i9-9900K
- Ballistix Elite 16GB @ 3000MHz
- Asus Strix Z390-E Gaming Motherboard
- EK-AIO 240 D-RGB CPU Cooler
- Nvidia GeForce GTX 1080 FE
- Lexar 250GB NVMe SSD
- Samsung 840 EVO 1TB SSD
- CORSAIR AX1200i PSU
Intel Z370
- Intel i7 8700k
- Ballistix Elite 16GB @ 3000MHz
- Gigabyte Ultra Durable Z370-HD3
- Asus Ryujin 360 CPU Cooler
- Nvidia GeForce GTX 1080 FE
- HyperX 120GB SSD
- Samsung 840 EVO 1TB SSD
- Thermaltake ToughPower RGB 750 Gold-rated PSU
Intel Z490
AMD X470
- AMD Ryzen 7 2700X
- Ballistix Elite 16GB @ 3000MHz
- Asus Ryujin 360 CPU Cooler
- Nvidia GeForce GTX 1080 FE
- HyperX 120GB SSD
- Samsung 840 EVO 1TB SSD
- Antec HCP1300 PSU
AMD X570
Special Note To Thank Our Sponsors: AMD, ASUS, GIGABYTE, MSI, Sabrent, DeepCool, be quiet!, and ANTEC.
Methodology
The following was ensured for each test:
- Each test is done on the Auto and Stock settings.
- Default tweaking/performance enhancement options are disabled in the BIOS.
- XMP is loaded for each test. DRAM timings and Voltage are set manually.
- All other voltages are left at Auto.
- The pump and fans of the cooling solution are set to run at 100% during the testing.
- Games are benched on the stock clocks.
- The overclocking results of the processor under discussion are shown.
- The Graphics card is not overclocked.
- The motherboards’ BIOS is updated to their latest.
- Nvidia’s driver 517.48 is used.
- HWinfo64 is used to monitor the sensors.
- Each game was tested on maxed setting using the built-in benchmark utility where available, and the MSI After Burner was used to record the FPS from the actual gameplay.
The following test suite has been used for the testing:
- AIDA64 Engineer
- Performance Test (for CPU and Memory)
- CPU Profile
- PCMark 10
- 7-Zip
- Blender Benchmark (BMW27, Classroom)
- FryBench FryRender
- Corona
- Indigo Benchmark
- V-Ray
- POV-Ray
- Cinebench R23
- Geekbench 5.0
- X264 HD 5.0 Benchmark
- X265 HD 1.4 Benchmark
- Kraken
- Octane
- Web XPRT 4
- Fritz Chess
- Super-PI
Synthetic Gaming Benchmarks:
Games:
- Assassin’s Creed Origin [Ultra High]
- Far Cry 5 [Ultra]
- Shadow of the Tomb Raider [DX12, Highest]
- DOOM Eternal [Vulkan, Ultra Nightmare]
- Metro Exodus [DX12, Ultra]
- Battlefield V [DX11, Ultra]
- Red Dead Redemption 2 [Vulkan, Ultra]
- CONTROL [DX12, High]
- CYBERPUNK [DX12, Ultra]
- The Witcher 3, The Wild Hunt [DX11, Ultra with Hair works off]
Let’s start with the results.
The testing was done on Microsoft Windows 11 x64 version 22H2.
General Tests
7-Zip
7-Zip is free software with open source. Most of the code is under the GNU LGPL license. Some parts of the code are under the BSD 3-clause License. 7-Zip has a high compression ratio in 7z format with LZMA and LZMA2 compression with supported formats of Packing/unpacking: 7z, XZ, BZIP2, GZIP, TAR, ZIP, and WIM and unpacking only: AR, ARJ, CAB, CHM, CPIO, CramFS, DMG, EXT, FAT, GPT, HFS, IHEX, ISO, LZH, LZMA, MBR, MSI, NSIS, NTFS, QCOW2, RAR, RPM, SquashFS, UDF, UEFI, VDI, VHD, VMDK, WIM, XAR and Z. For ZIP and GZIP formats, 7-Zip provides a compression ratio that is 2-10 % better than the ratio provided by PKZip This software has a built-in benchmark which tests the performance of the given CPU by compressing and decompressing the load. The results are in MIPS, and higher count is preferable.
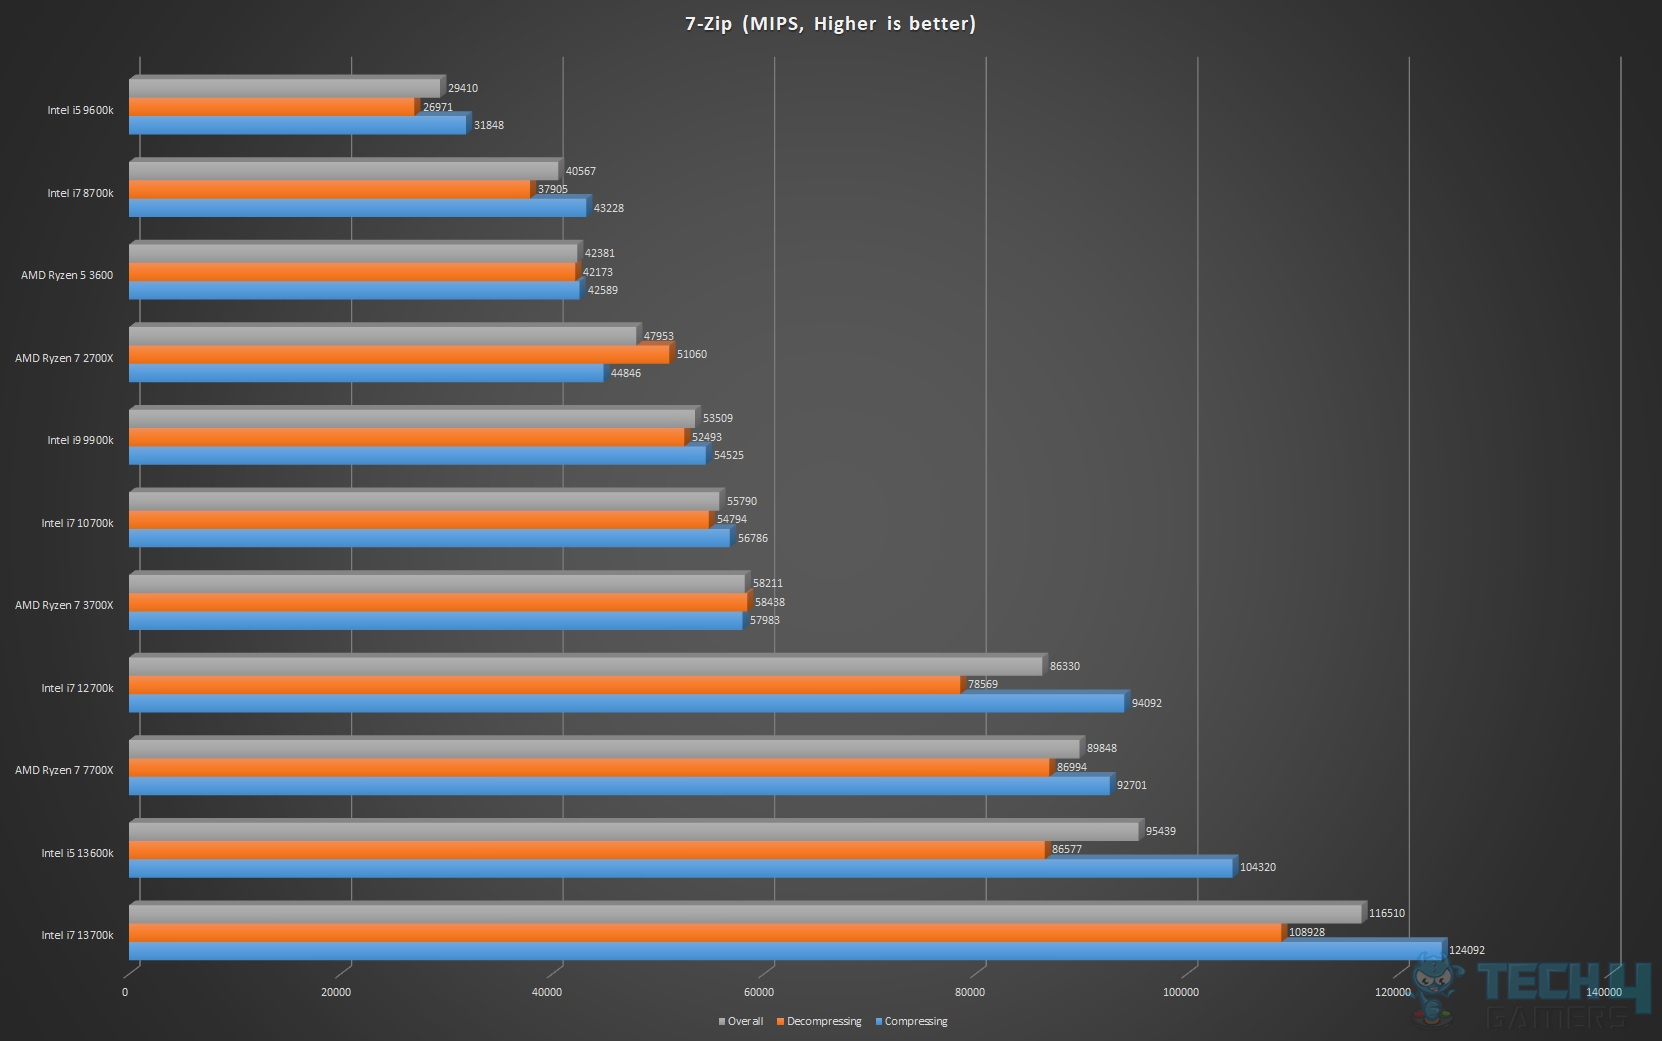
The i5 13700k is showing impressive performance compared to the i7 12700k and Ryzen 7 7700X.
AIDA64
AIDA64 Engineer has a hardware detection engine unrivaled in its class. It provides detailed information about installed software and offers diagnostic functions and support for overclocking.
As it monitors sensors in real-time, it can gather accurate voltage, temperature, and fan speed readings, while its diagnostic functions help detect and prevent hardware issues. It also offers a couple of benchmarks for measuring either the performance of individual hardware components or the whole system.
The following built-in benchmarks were run in this software:
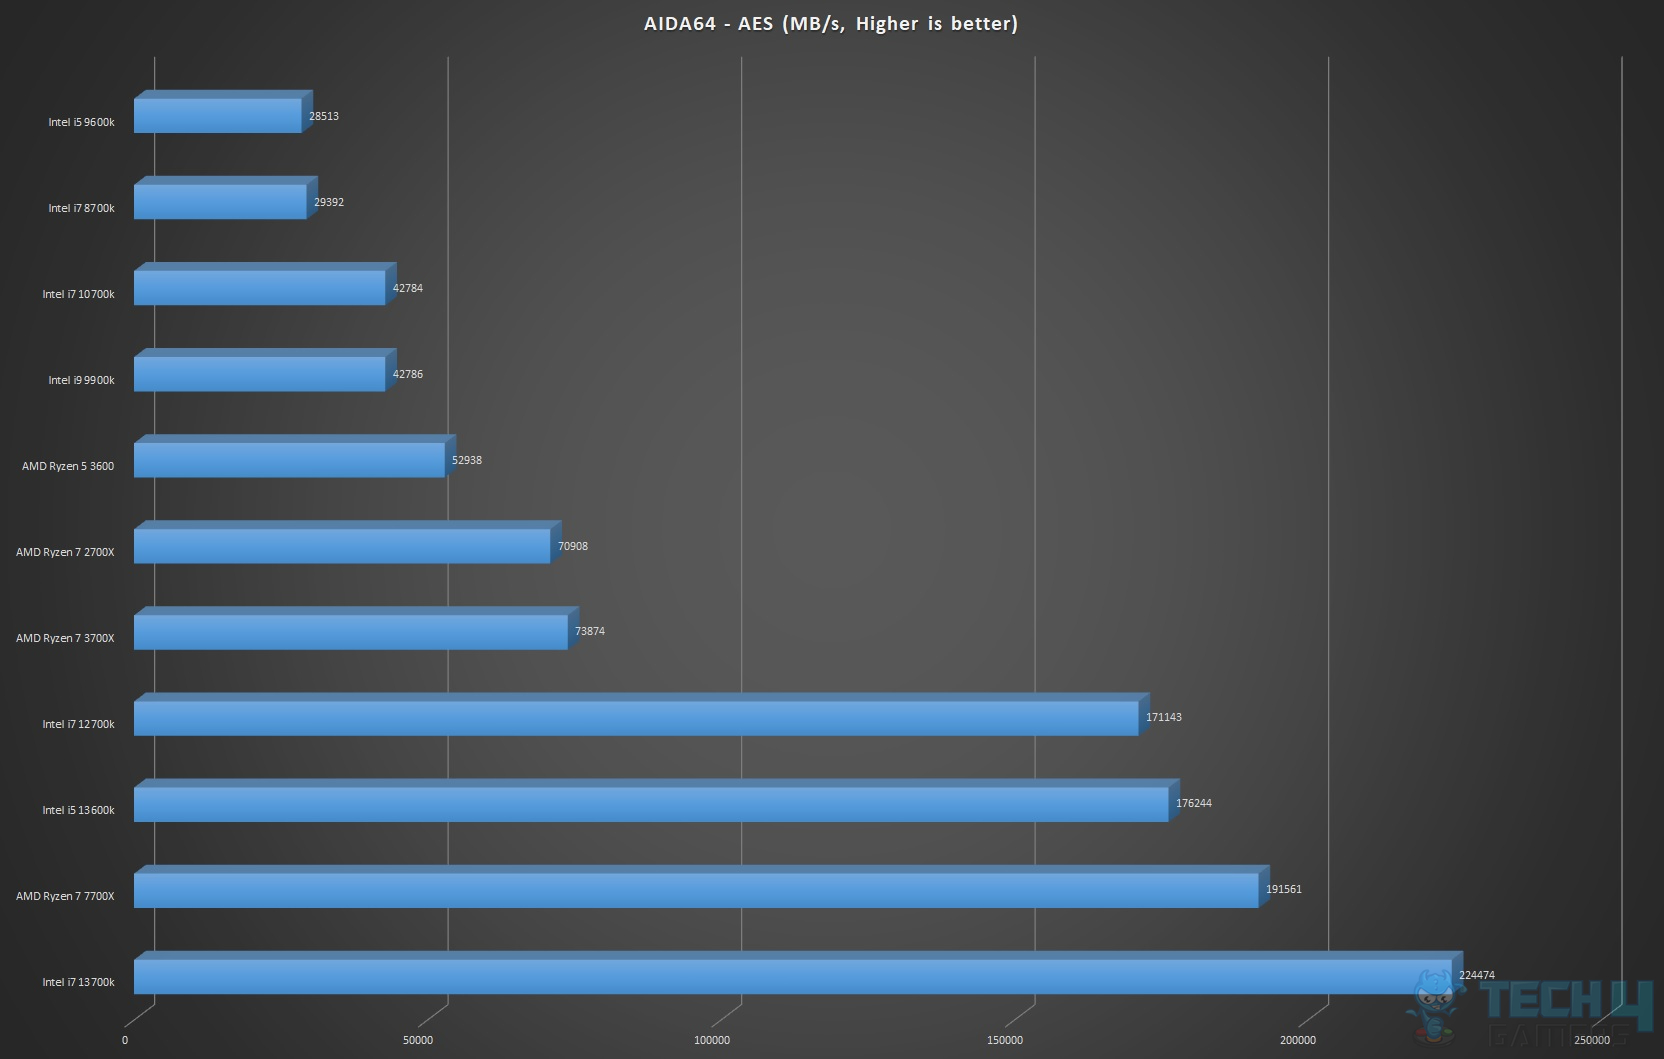
CPU AES
This integer benchmark measures CPU performance using AES (a.k.a. Rijndael) data encryption. It utilizes Vincent Rijmen, Antoon Bosselaers, and Paulo Barreto’s public domain C code in ECB mode.
CPU AES test uses only the basic x86 instructions, and it is hardware accelerated on VIA PadLock Security Engine capable VIA C3, VIA C7, VIA Nano, and VIA QuadCore processors; and on Intel AES-NI instruction set extension capable processors. The test consumes 48 MB of memory, and it is HyperThreading, multi-processor (SMP), and multi-core (CMP) aware.
CPU Queen
This simple integer benchmark focuses on the branch prediction capabilities and the misprediction penalties of the CPU. It finds the solutions for the classic “Queens problem” on a 10 by 10-sized chessboard.
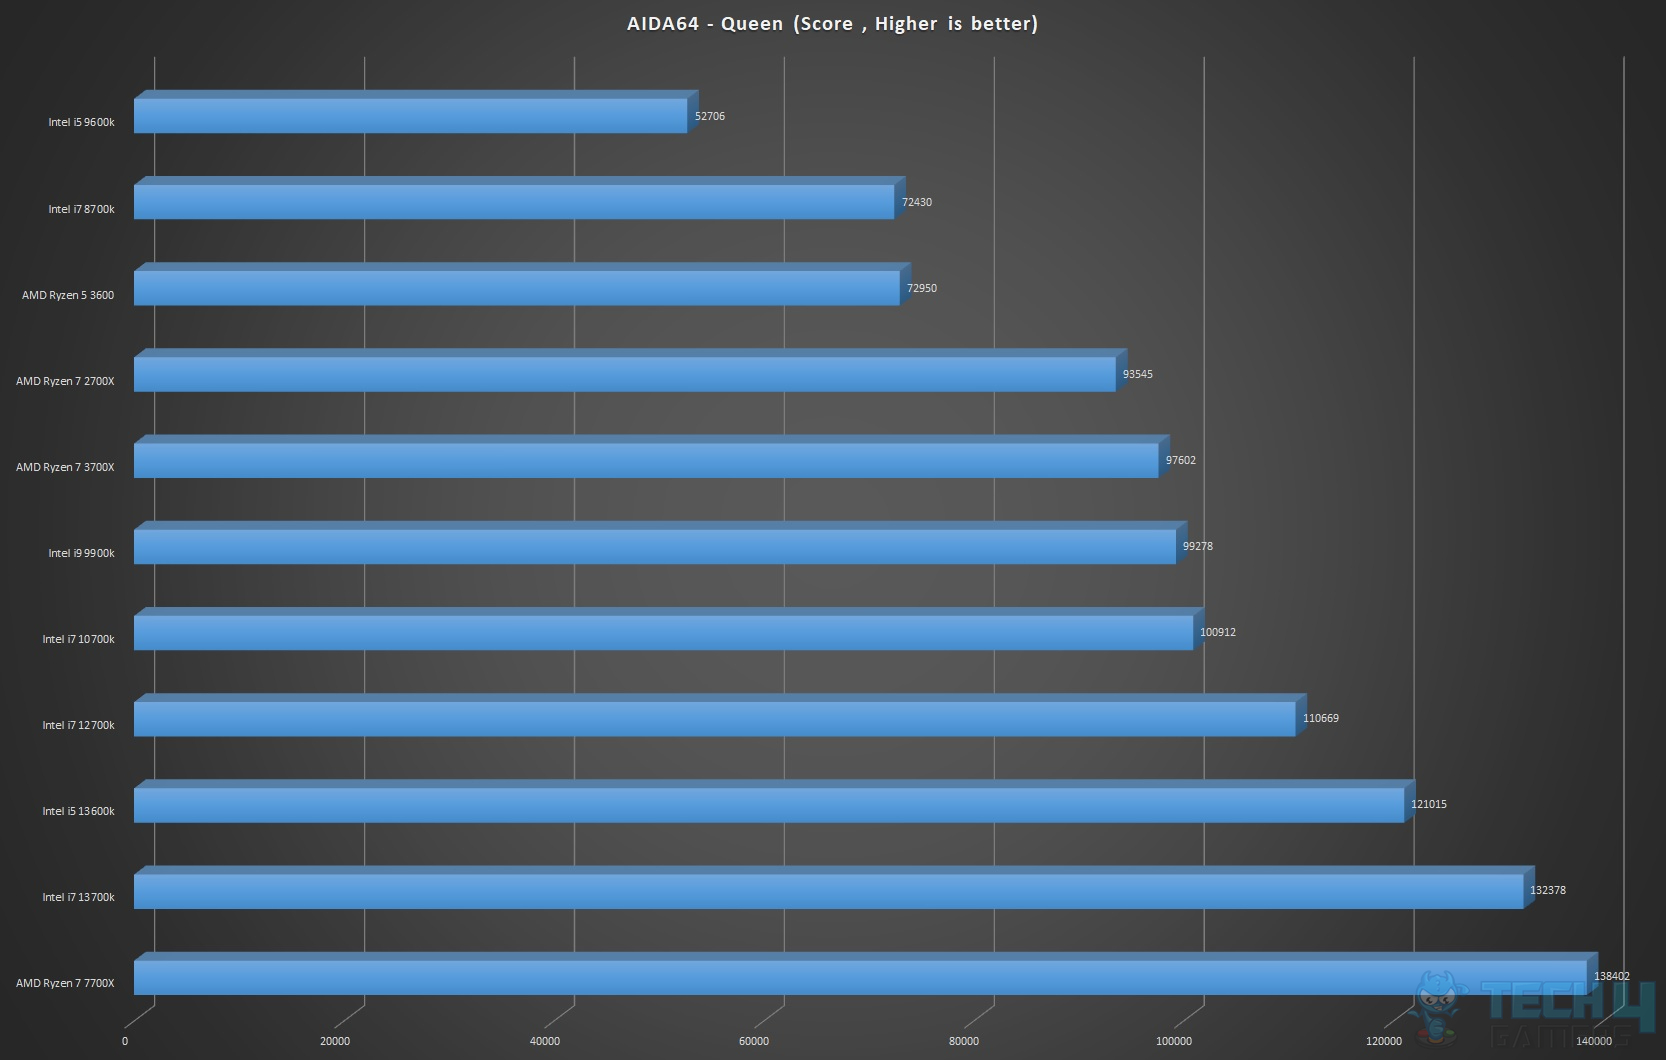
The Ryzen 7 7700X is thriving the results in both tests. Intel i7 13700k is managing a fine closure over the i7 12700k.
Memory
This test measures the system memory’s read, write and copy speeds as well as the latency.
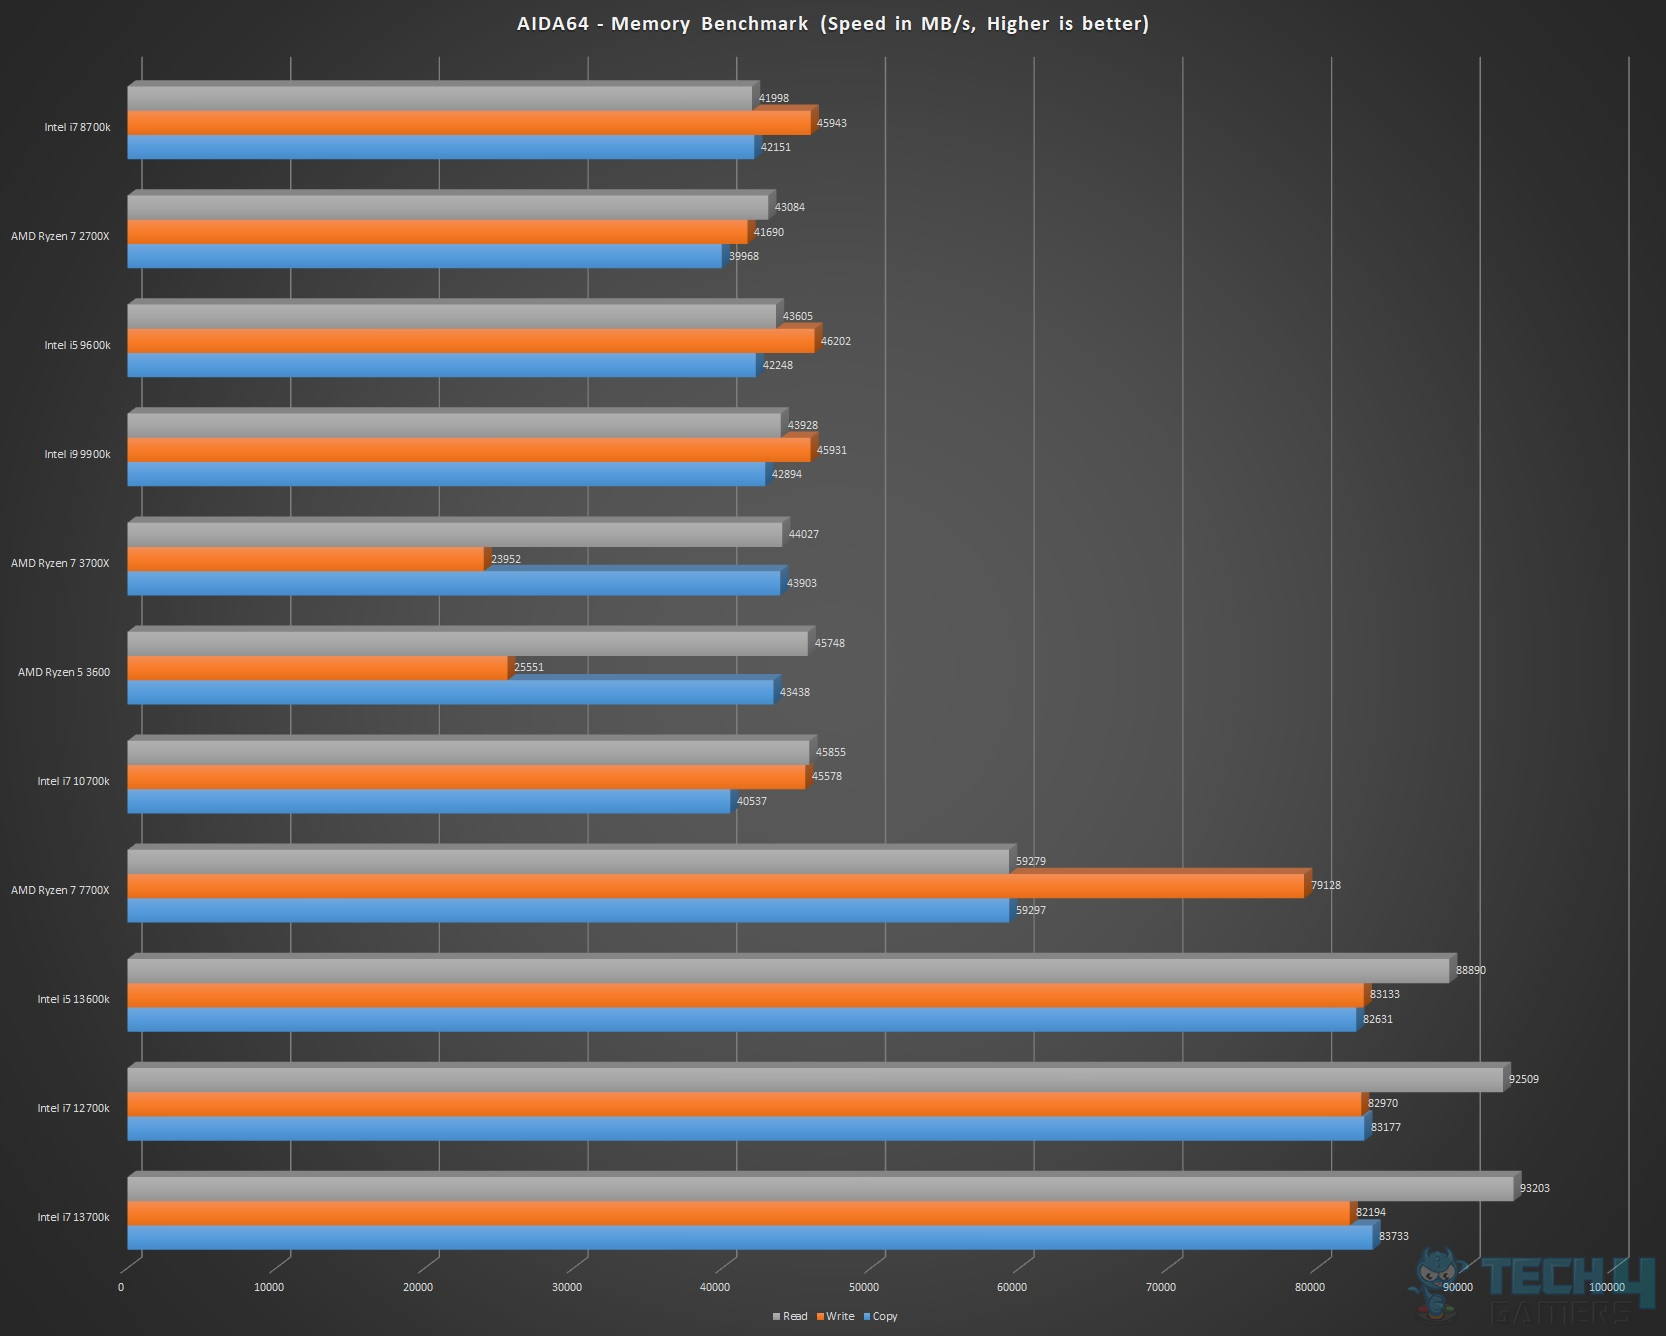
The Intel i7 13700k has a solid performance when it comes to memory operations.
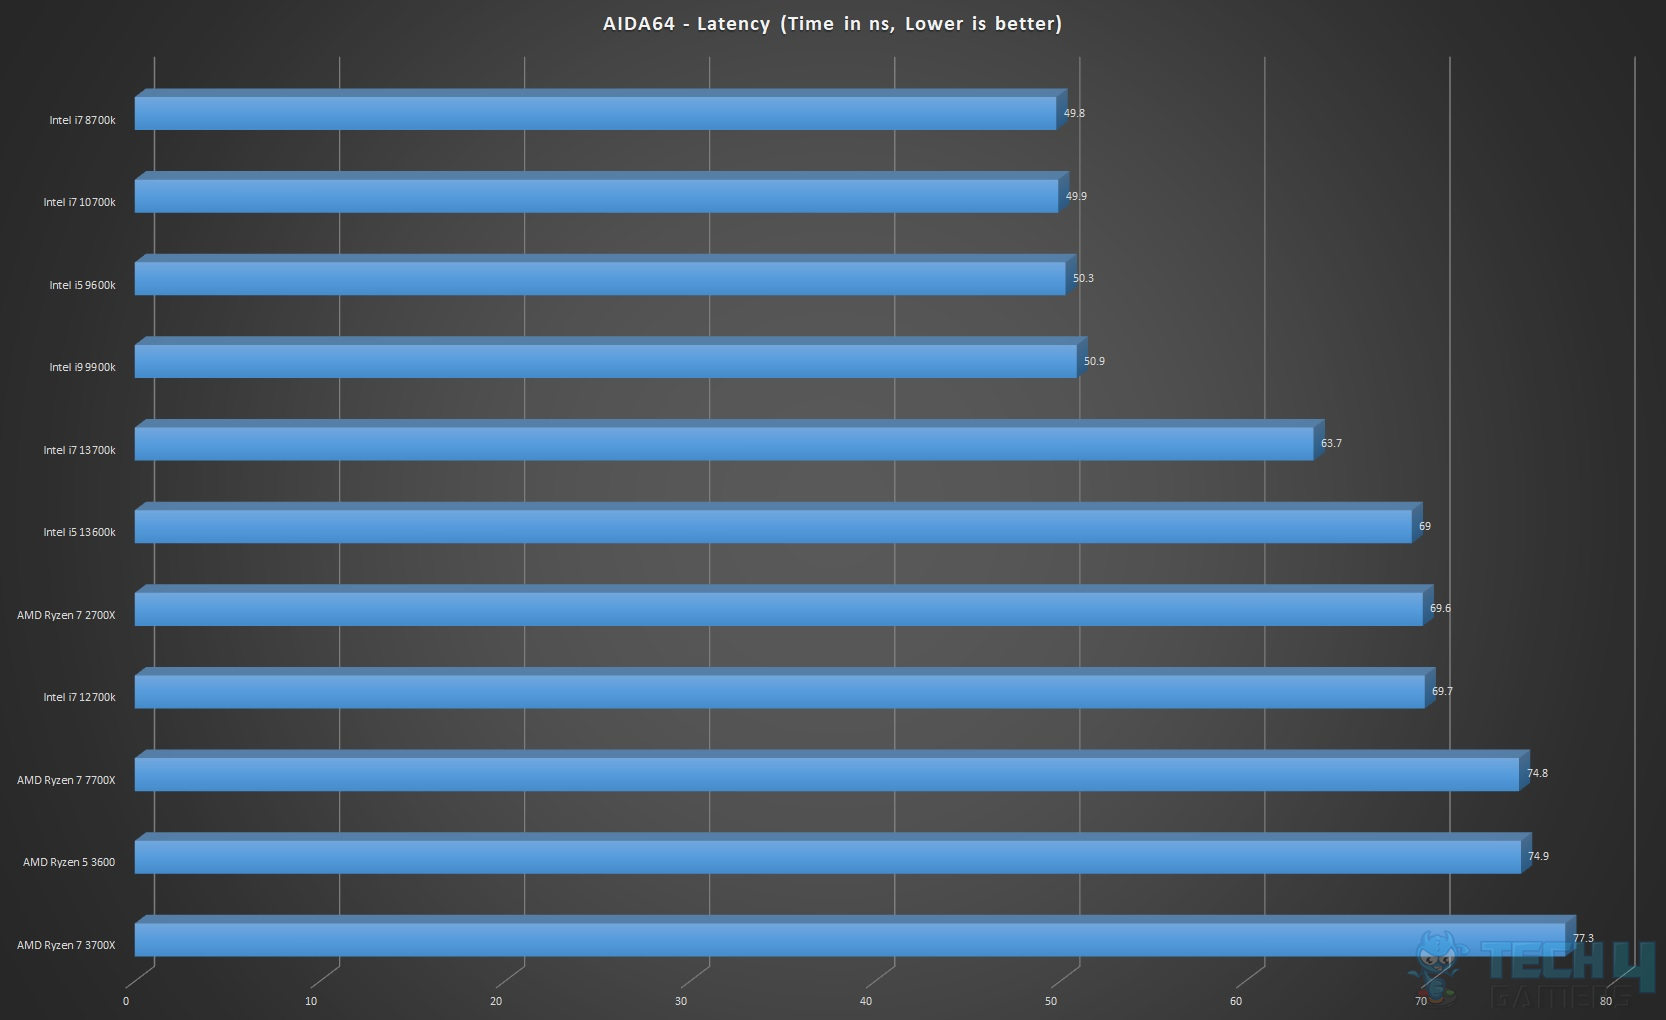
Impressive performance again. In fact, in the DDR5 test benches, the lowest time comes from this test bench powered by i7 13700k.
PCMark 10
PCMark 10 is the latest version in the series of industry-standard PC benchmarks. PCMark 10 features a comprehensive set of tests that cover the wide variety of tasks performed in the modern workplace. With express, extended, and custom run options to suit your needs, PCMark 10 is the complete PC benchmark for the modern office.
It is the ideal test for organizations that are evaluating PCs for a workforce with a range of performance needs. The tests in this benchmark cover a wide range of activities, from everyday productivity tasks to demanding work with digital media content.
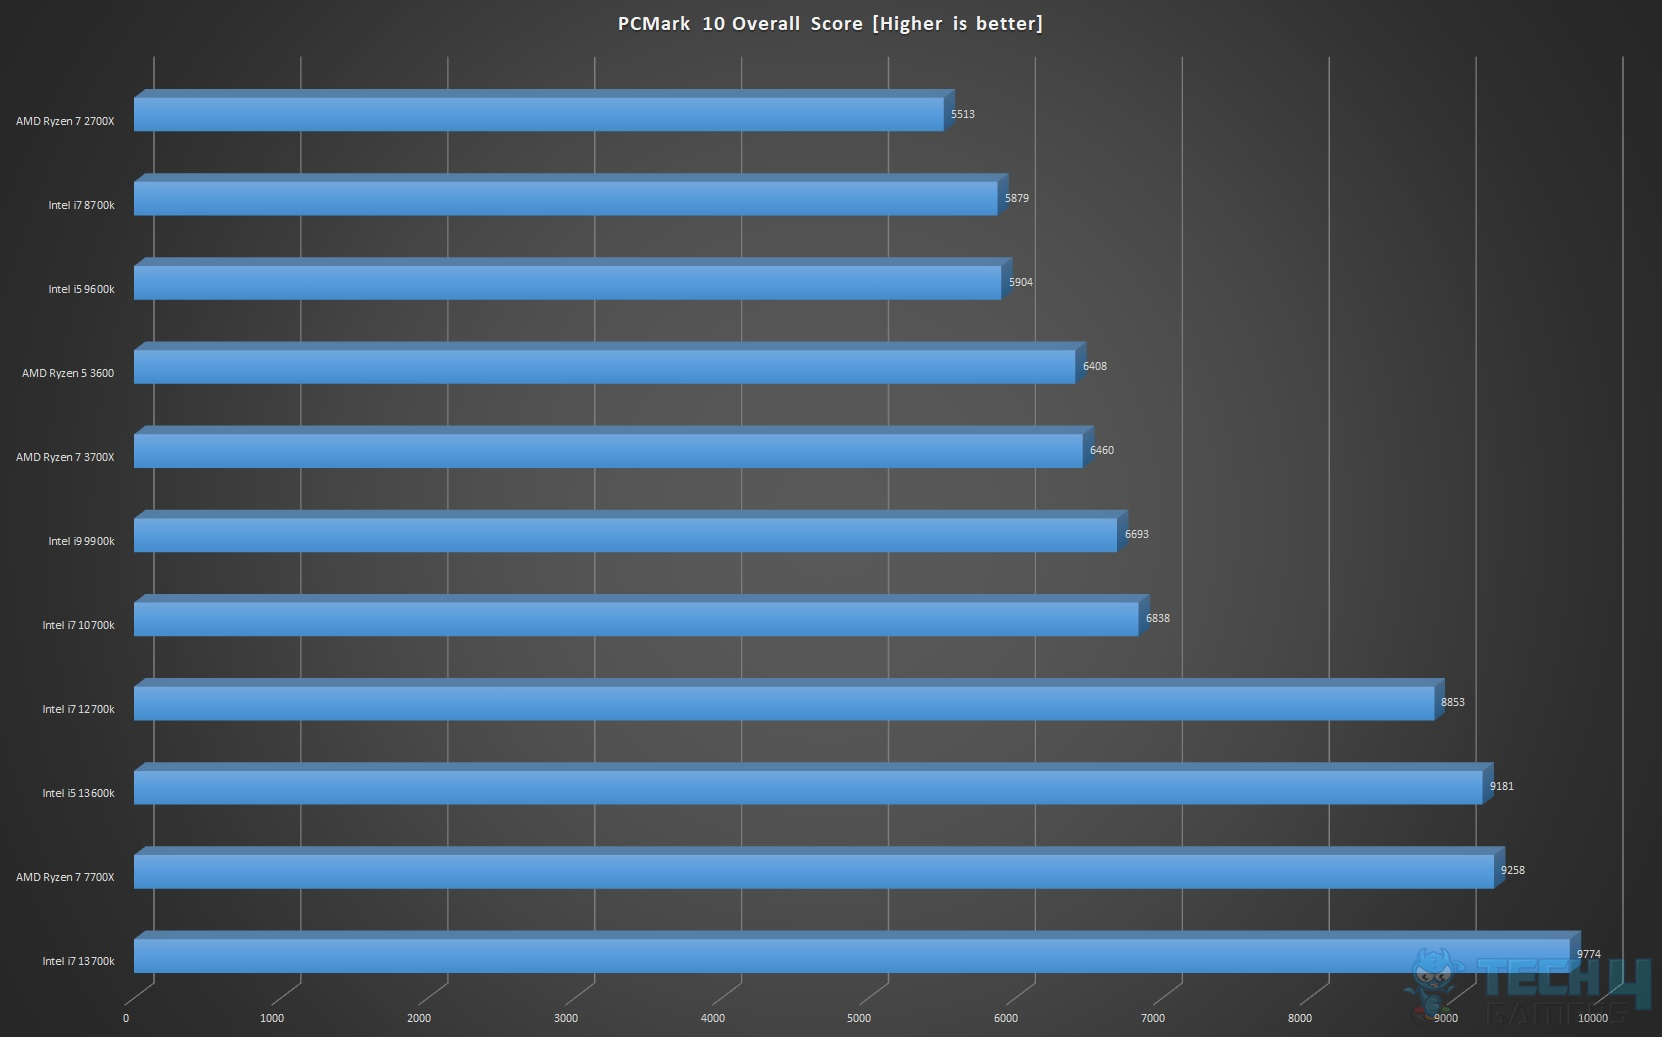
The Intel i7 13700k means business with its impressive performance feat.
Performance Test
PassMark PerformanceTest allows you to objectively benchmark a PC using a variety of different speed tests and compare the results to other computers. We have used only CPU and Memory benchmarks.
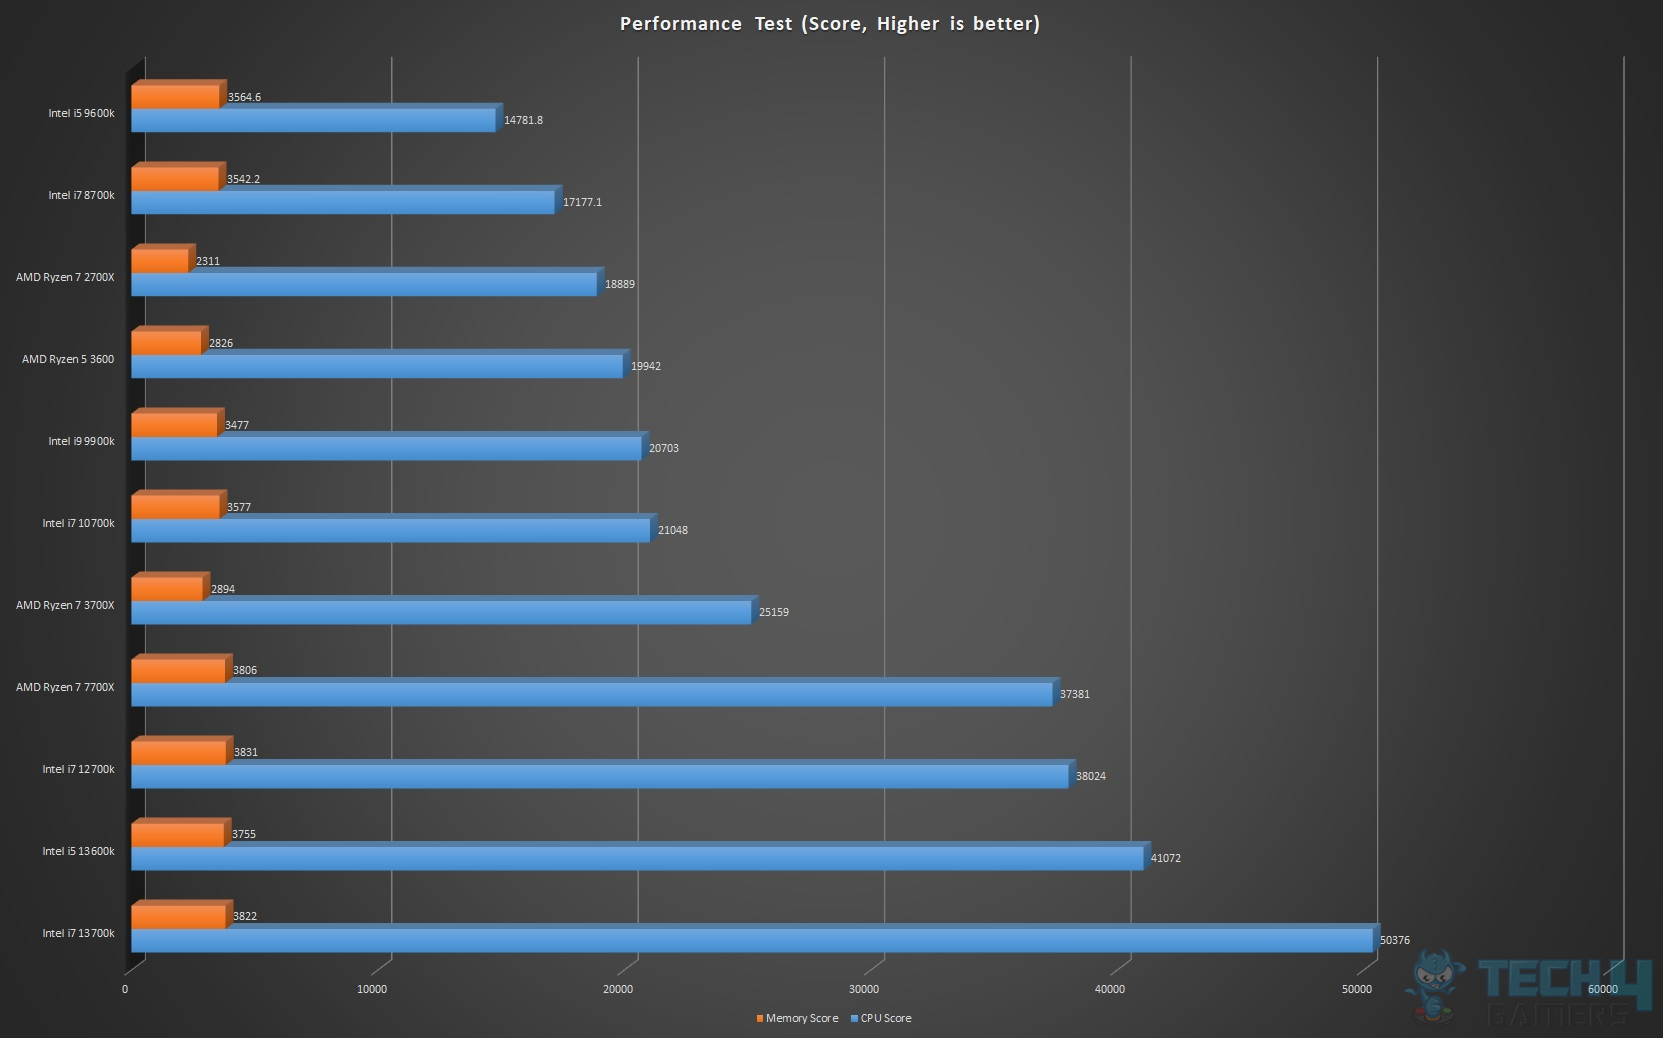
Another stunner from the i7 13700k. This CPU is smashing the results.
Super-PI
Super PI is a single-threaded benchmark that calculates pi to a specific number of digits. It uses the Gauss-Legendre algorithm and is a Windows port of a program used by Yasumasa Kanada in 1995 to compute pi to 232 digits.
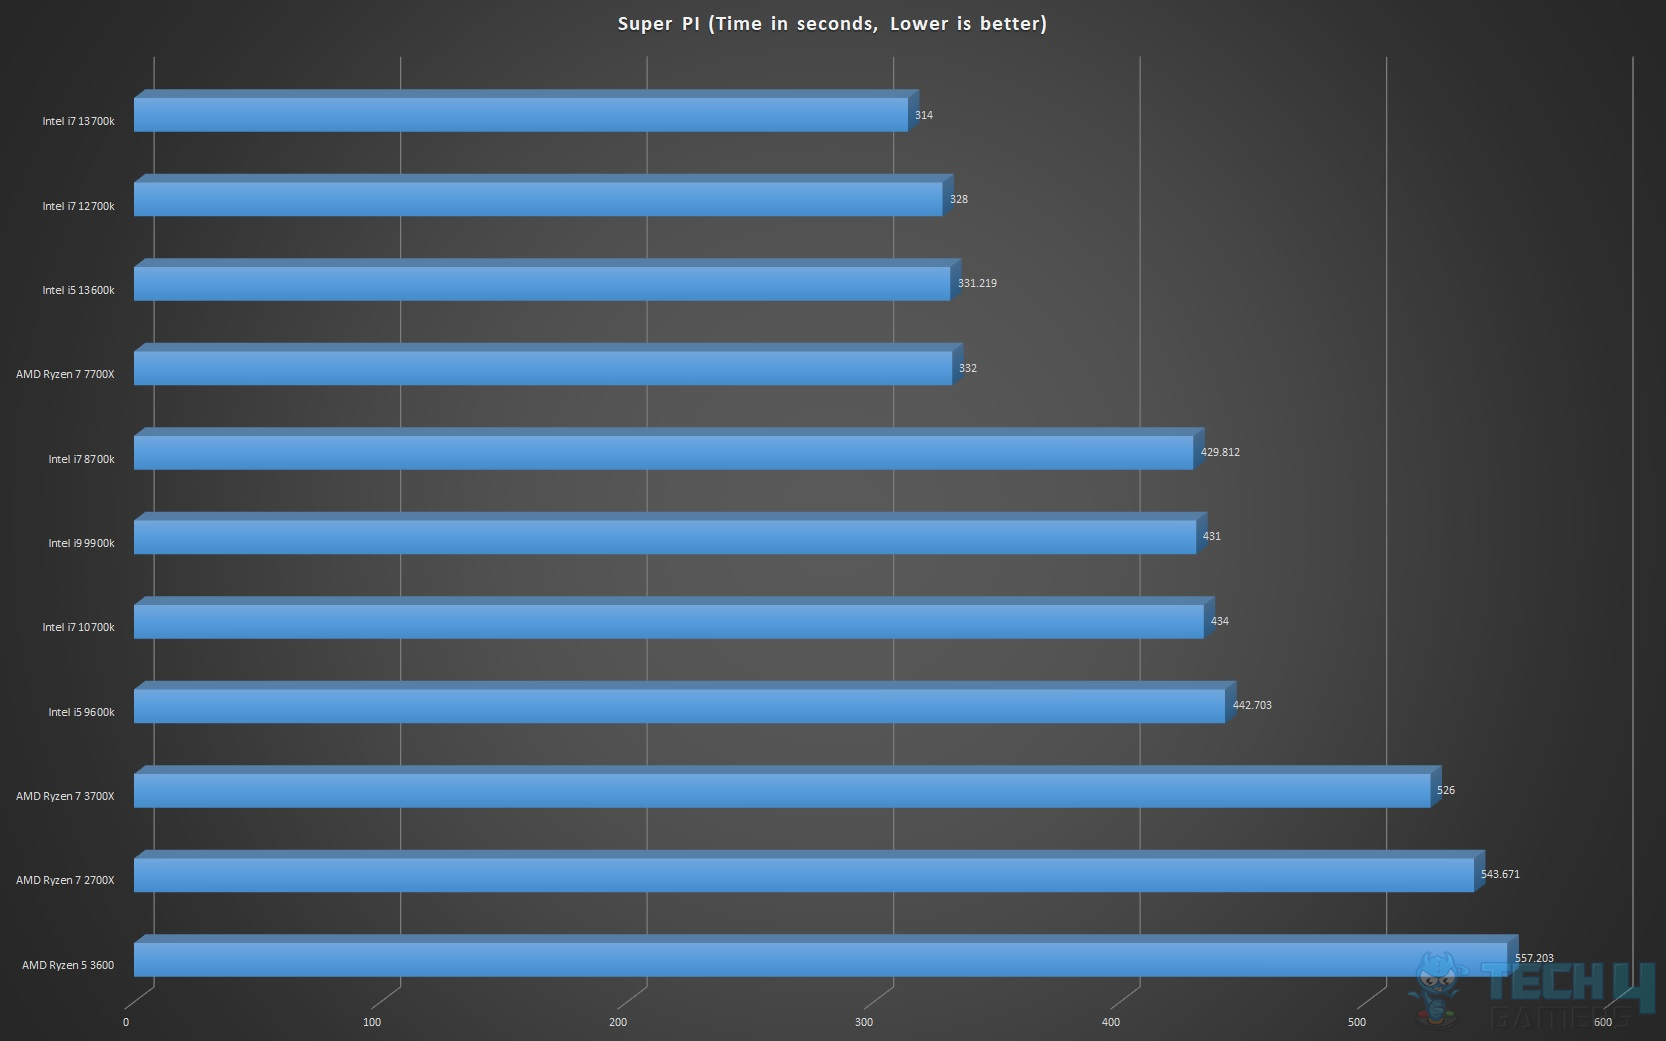
The reported results are converted into seconds from minutes and seconds. The core i7 13700k has a marginal lead over the core i5 13600k.
wPrime
wPrime uses a recursive call of Newton’s method for estimating functions, with f(x)=x2-k, where k is the number we’re sqrting, until Sgn(f(x)/f'(x)) does not equal that of the previous iteration, starting with an estimation of k/2. It then uses an iterative calling of the estimation method a set amount of times to increase the accuracy of the results.
It then confirms that n(k)2=k to ensure the calculation was correct. It repeats this for all numbers from 1 to the requested maximum. Each thread is designed to do 1/n of the work, where n is the number of threads.
We have used the 1024M calculation. The reported time is in seconds. Please, take note that you would need to set the thread count manually.
For i5 9600k, it was set to 6, for i7 8700k, it was set to 12. For Ryzen 7 2700X, it was set to 16, and for Ryzen 5 3600, it was set to 12. Without setting the proper thread count, the results would not be comparable.
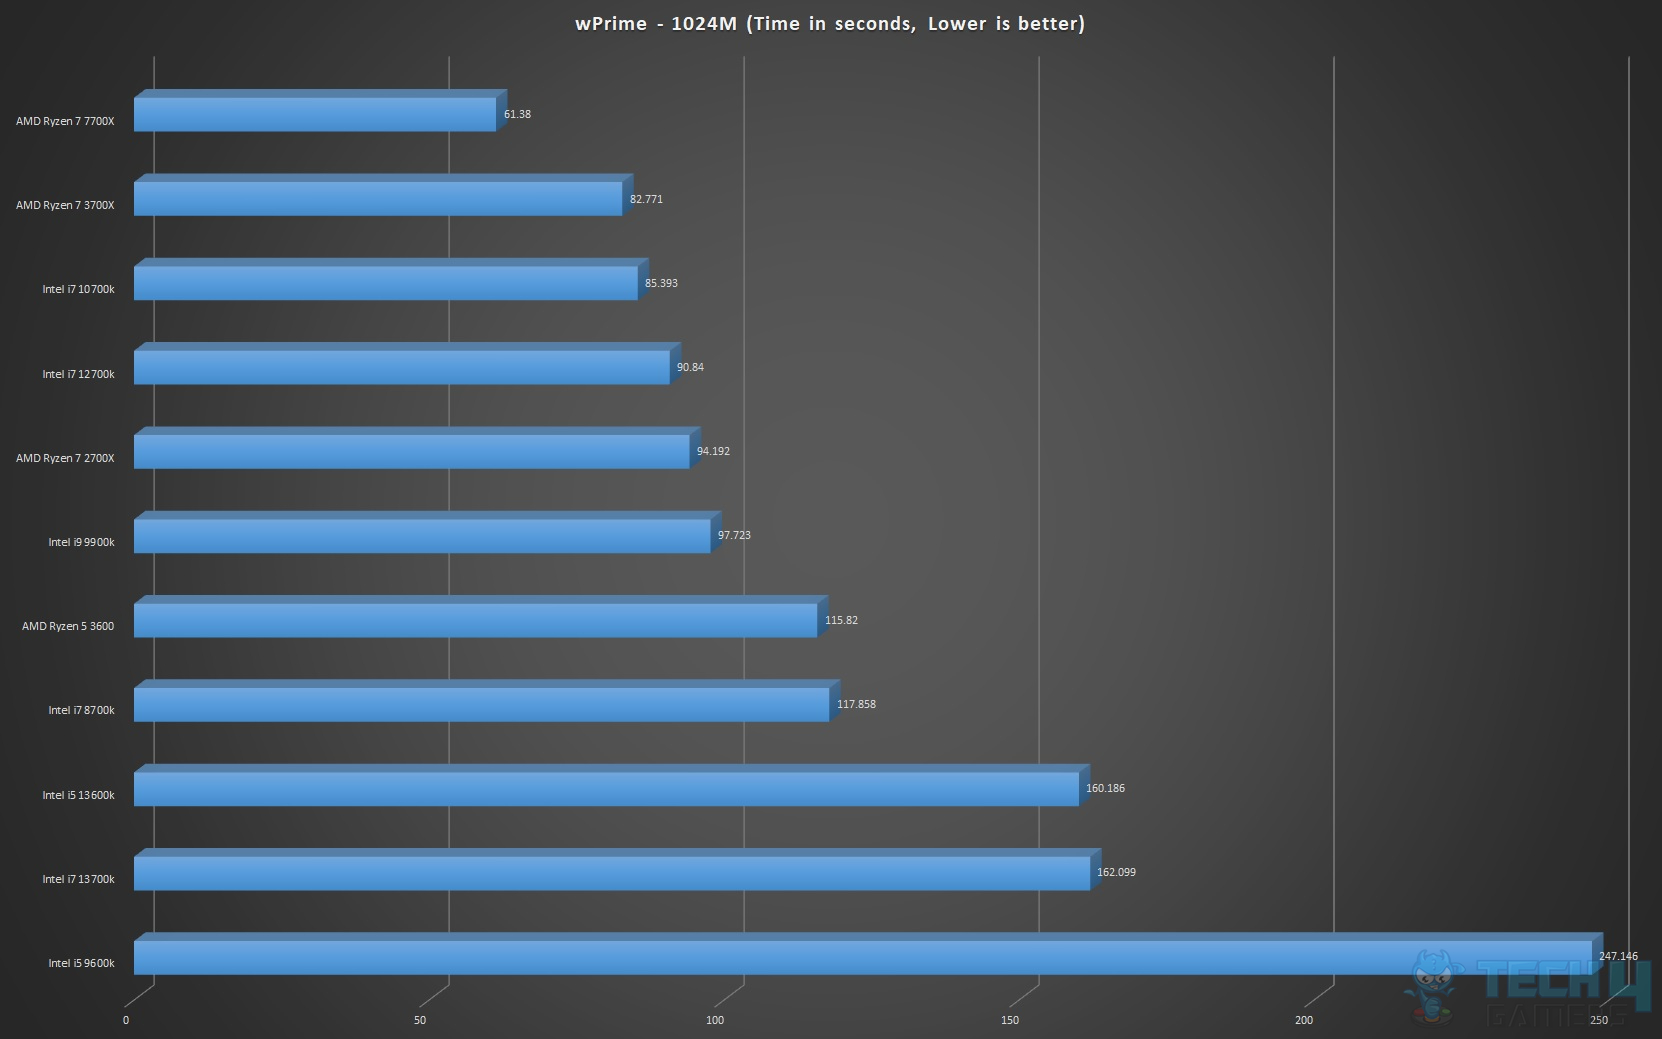
We encountered an issue with the Intel 12-gen and 13-gen platforms on this benchmark. We are using version 2.11 and somehow, this software seems not fully ready for the hybrid architecture. AMD has delivered a solid punch.
Fritz Chess
Fritz Chess benchmark tests the CPU performance in terms of as many chess board positions as possible. It is using Deep Fritz 12 engine.
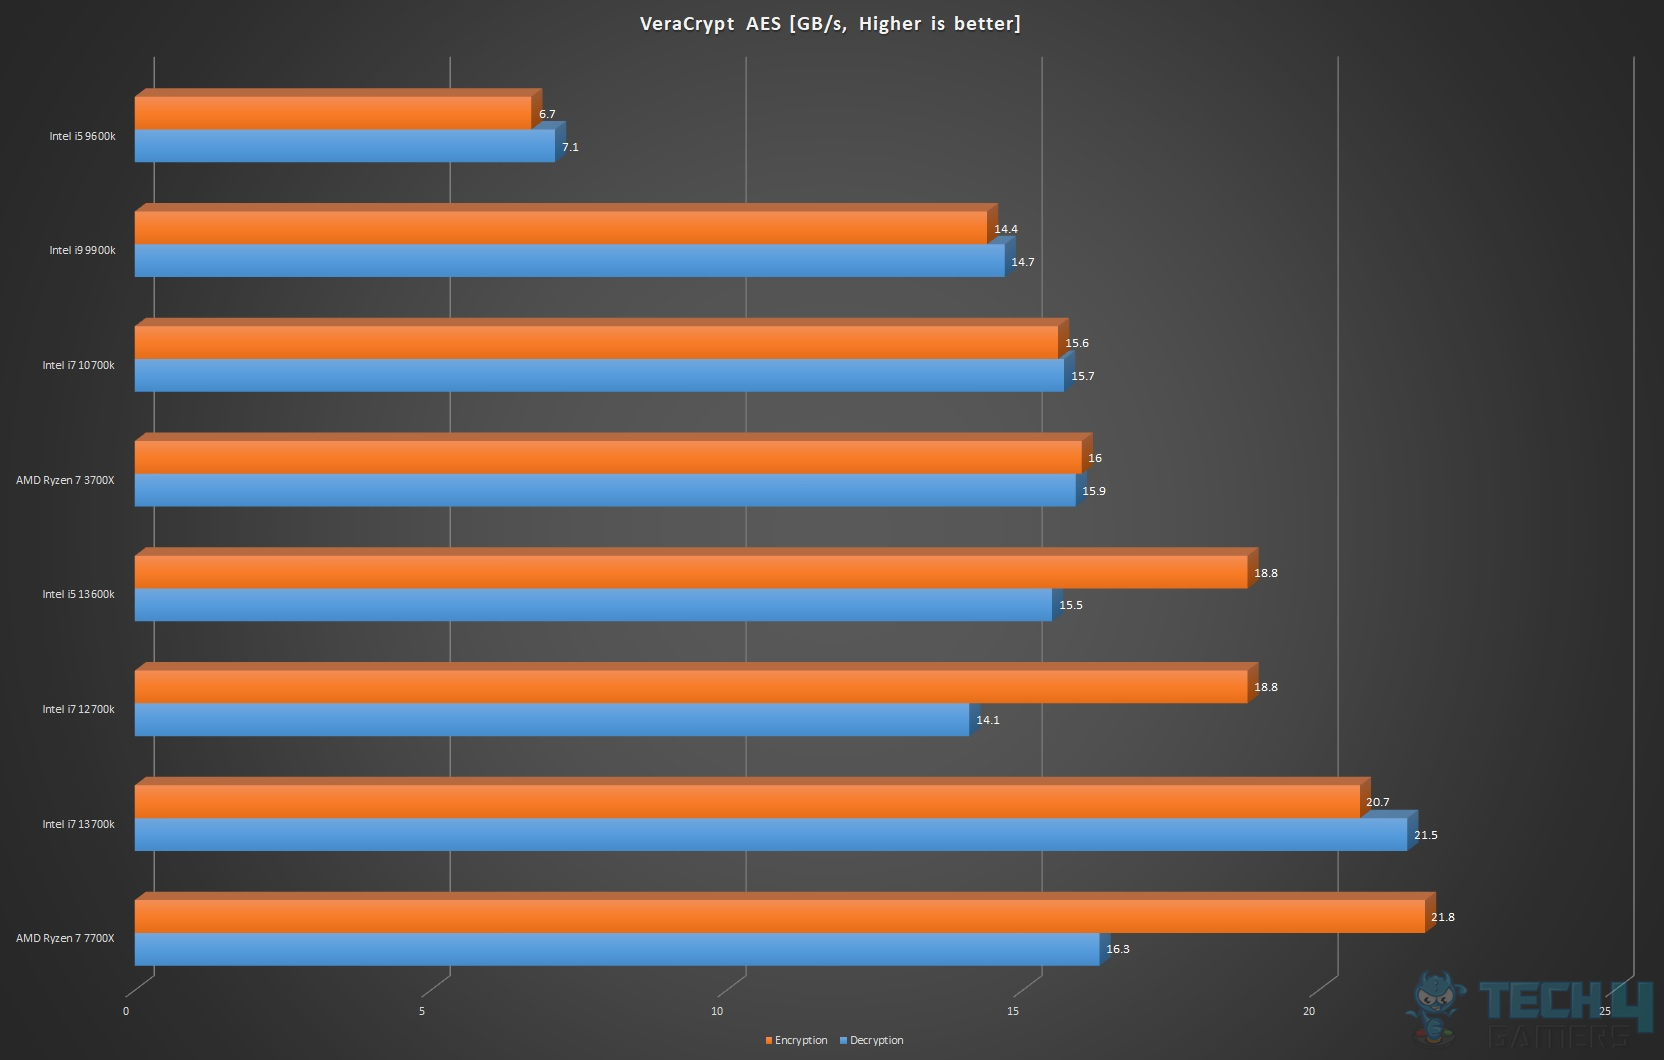
Vera-Crypt
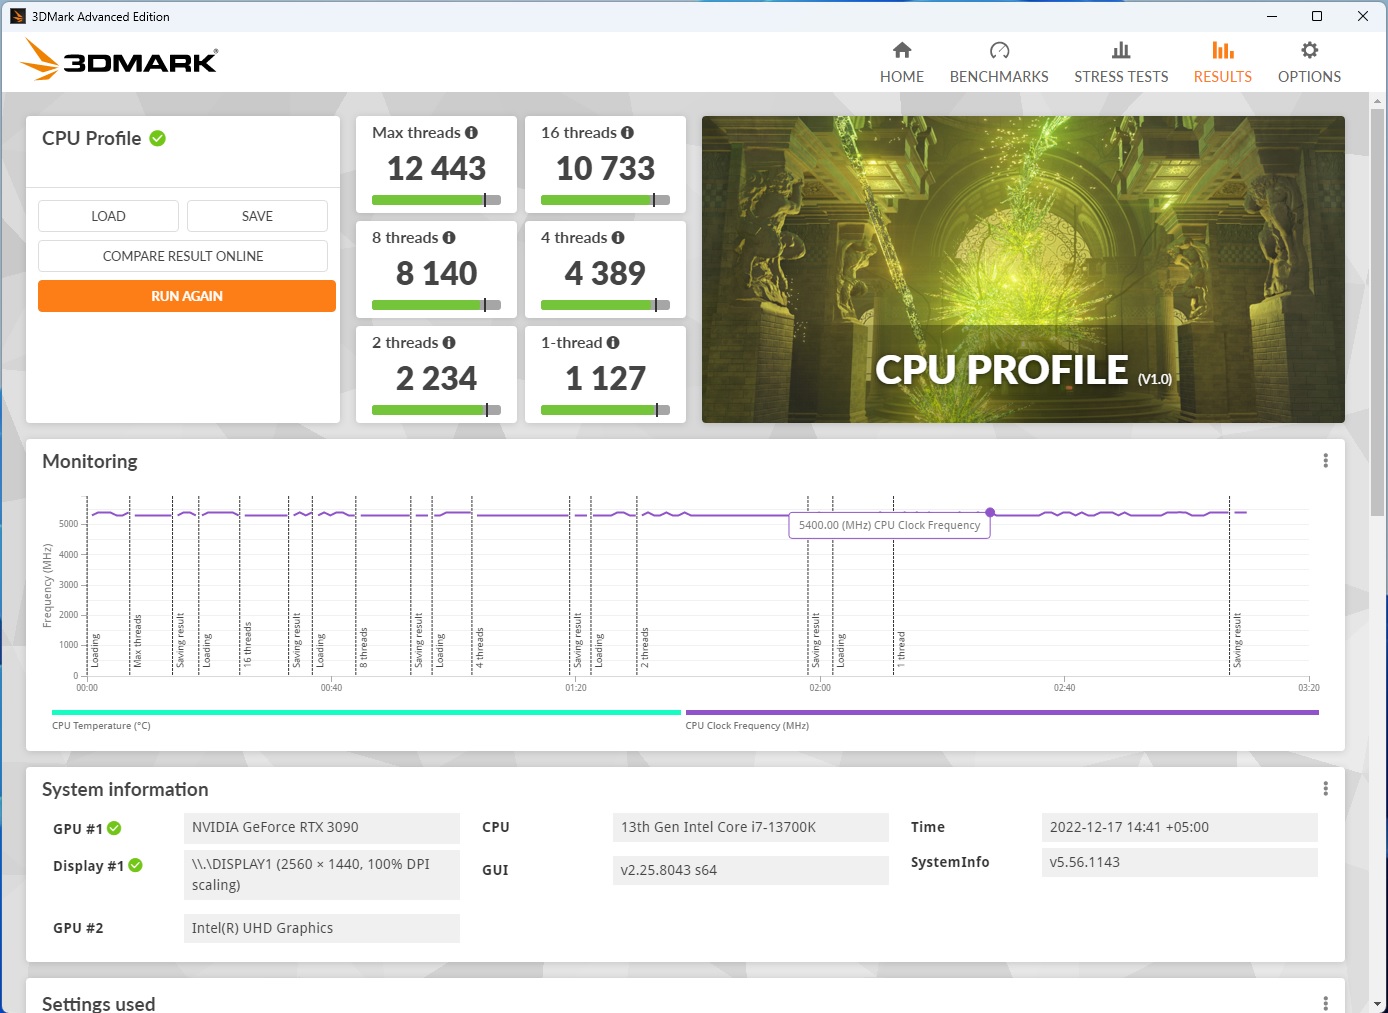
CPU Profile
The 3DMark CPU Profile introduces a new approach to CPU benchmarking. Instead of producing a single number, the 3DMark CPU Profile shows how CPU performance scales and changes with the number of cores and threads used. The CPU Profile has six tests, each of which uses a different number of threads.
The benchmark starts by using all available threads. It then repeats using 16 threads, 8 threads, 4 threads, and 2 threads, and ends with a single-threaded test.
These six tests help you benchmark and compare CPU performance for a range of threading levels. They also provide a better way to compare different CPU models by looking at the results from thread levels they have in common.
Rendering Tests
We have run multiple rendering tests for evaluation. The results of these tests are mostly the rendering time and frames per second unless stated otherwise. Lower time and higher FPS are what we are looking for.
Blender
We have used the blender benchmark app for this purpose in addition to rendering the BMW27 scenario in the main Blender software. The Blender Benchmark will compute performance for CUDA, OpenCL, and CPU, along with GPU performance. Blender Benchmark is a new platform to collect and display the results of hardware and software performance tests. Blender is a free and open-source 3D creation suite.
It supports the entirety of the 3D pipeline—modeling, rigging, animation, simulation, rendering, compositing and motion tracking, and even video editing and game creation. For the purpose of this testing, the quick run method was used in the Blender Benchmark. BMW27 and Classroom rendering scenes have been used.
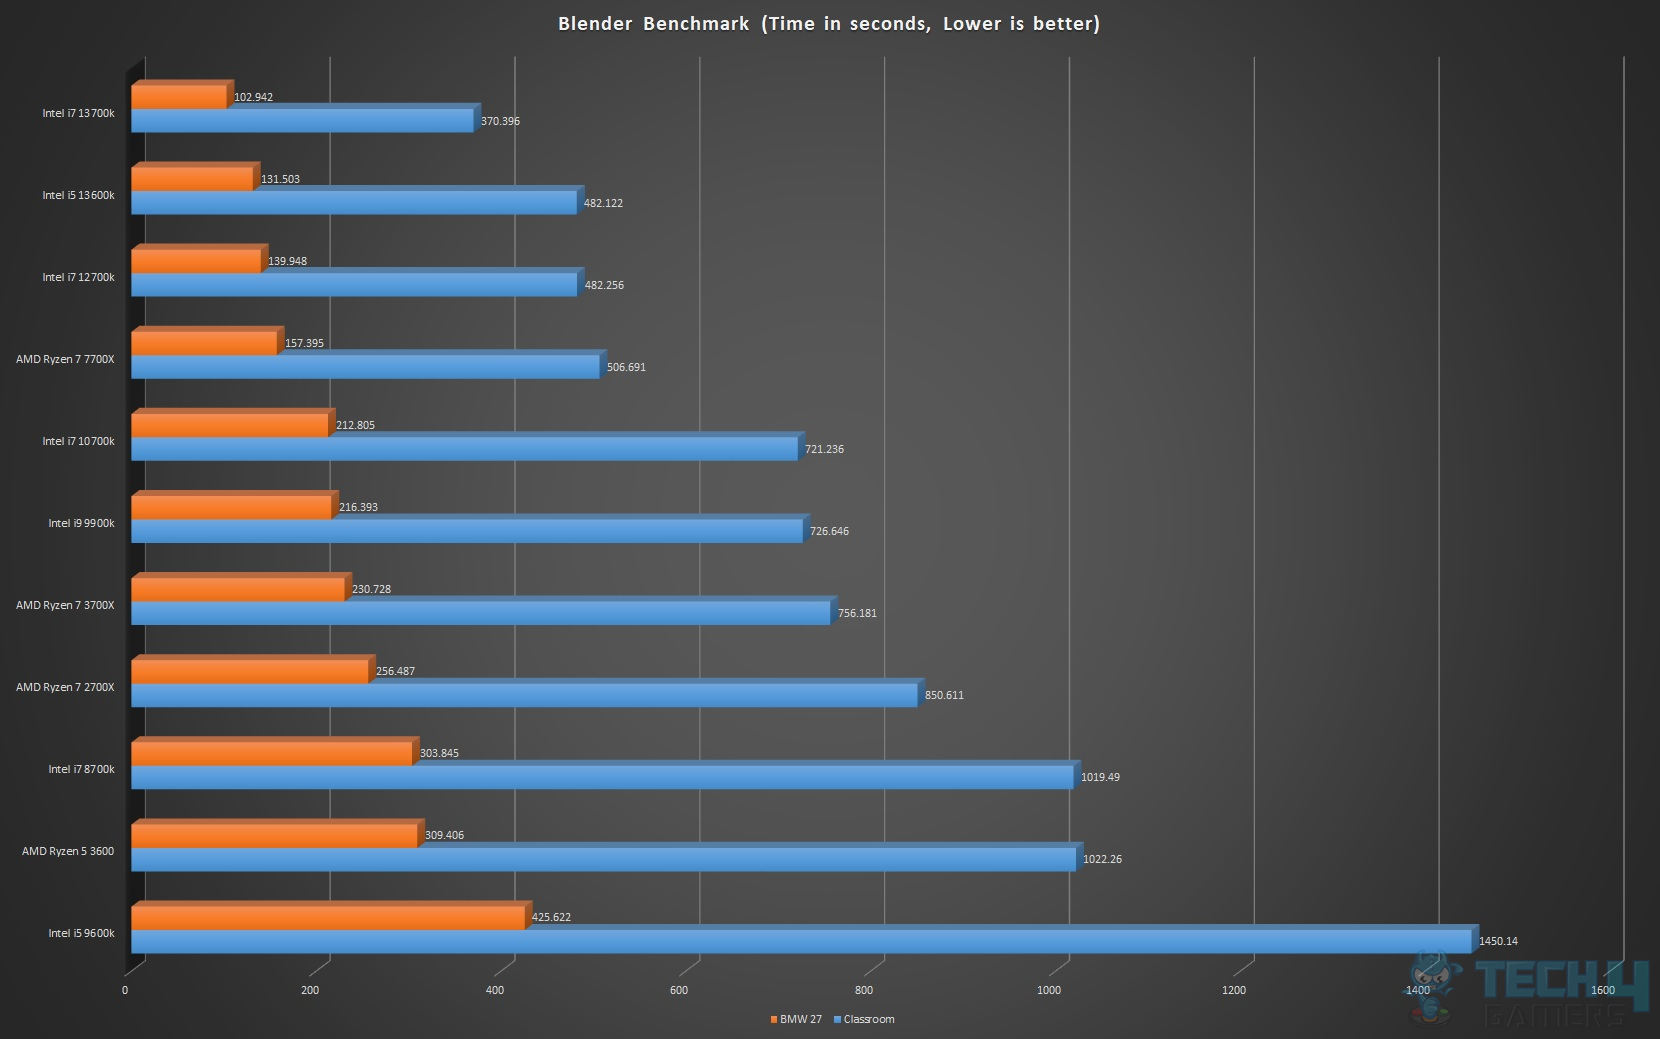
Impressive performance from core i7 13700k in the blender benchmark.
Corona
Corona is another simple-to-use rendering benchmark. It starts benching as soon as the software is run. It reports the results in the rendering time and rays per second.
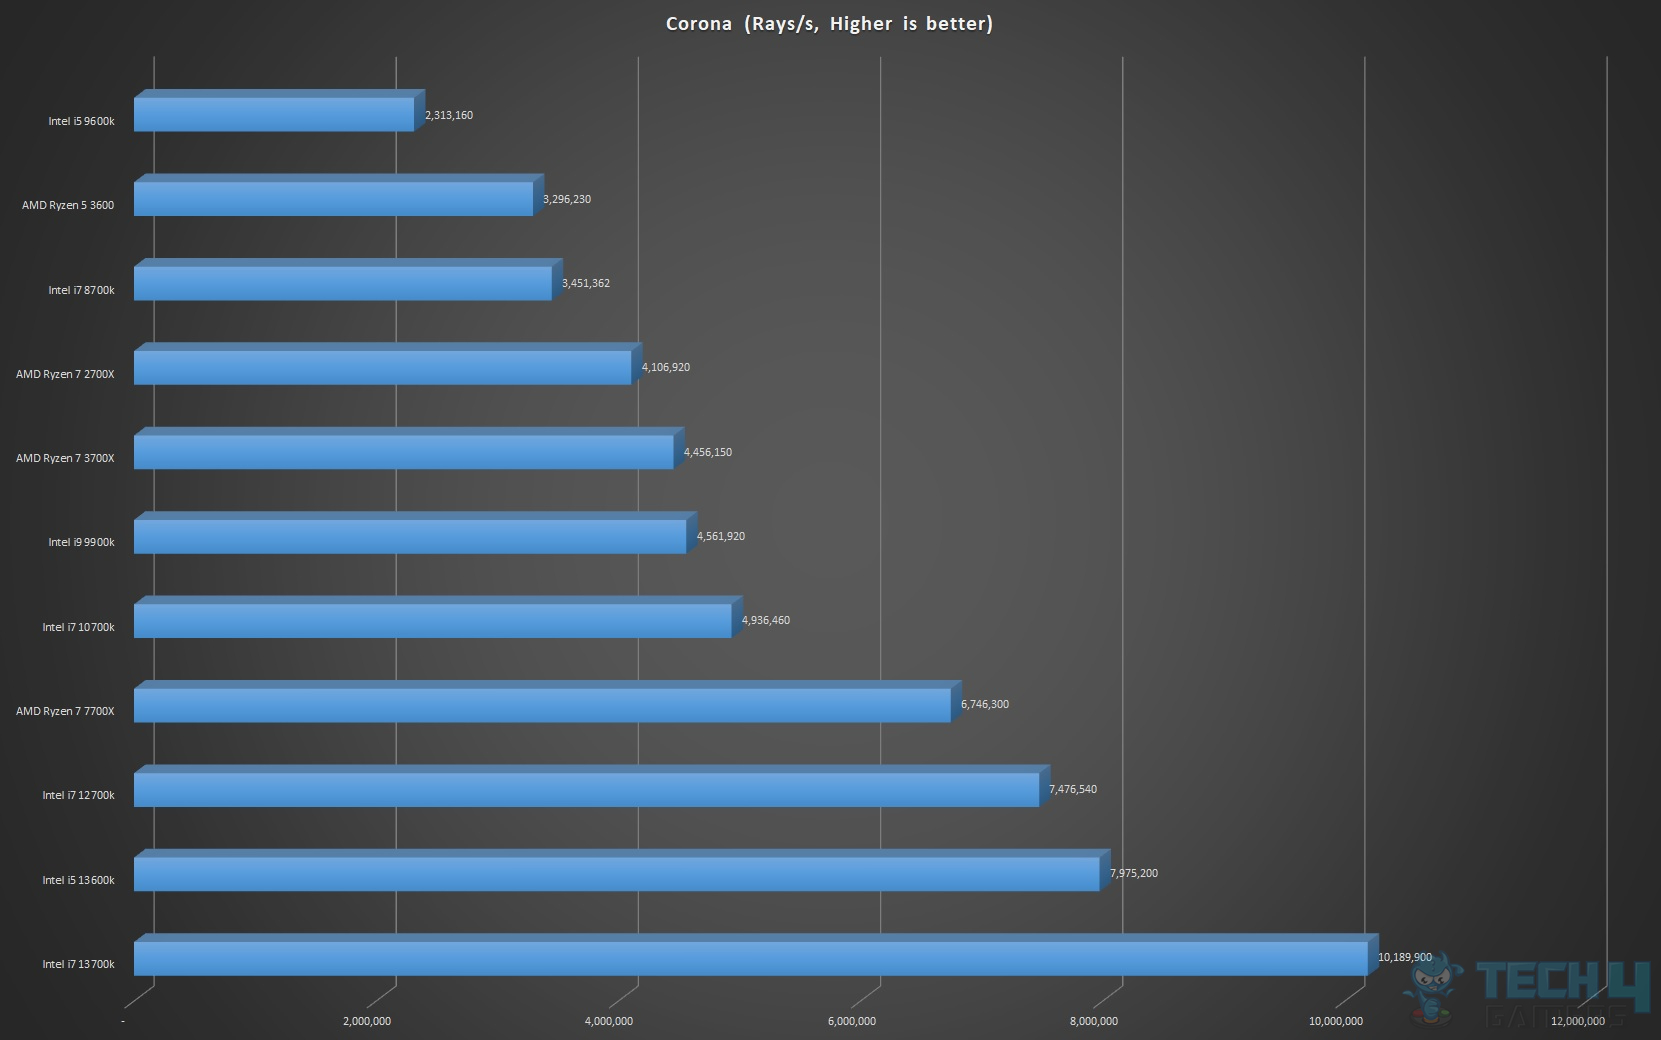
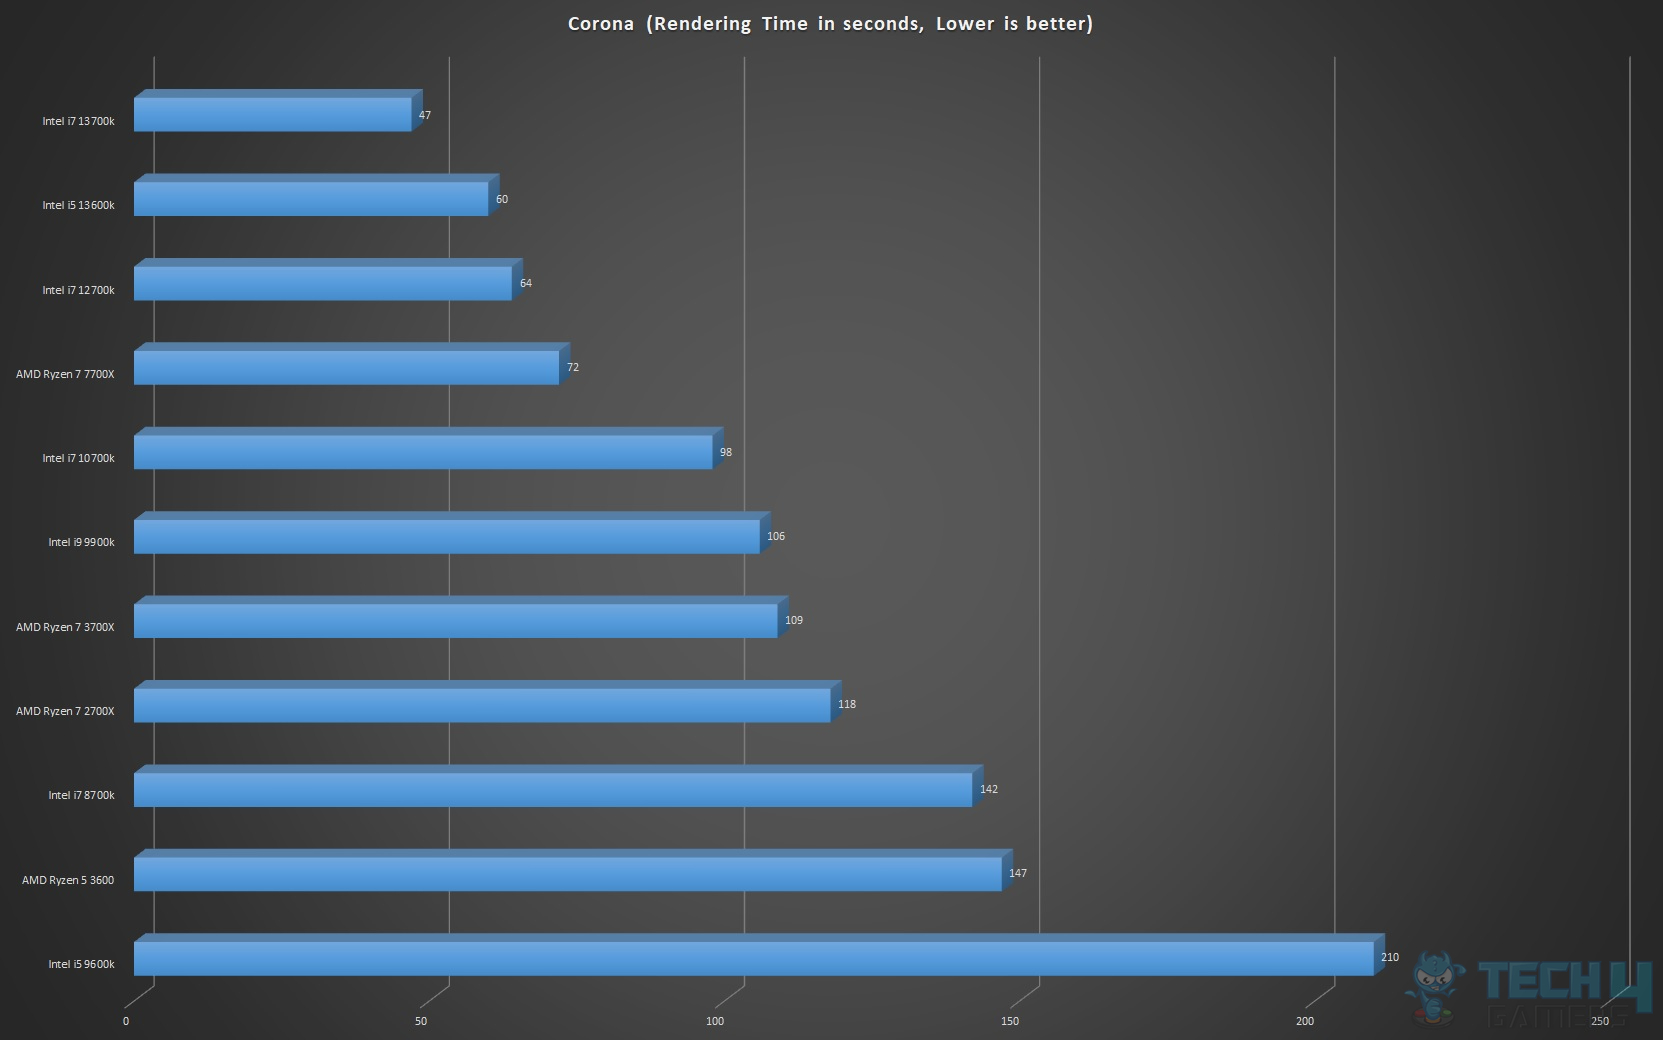
Once again, the core i7 13700k is smashing the competition.
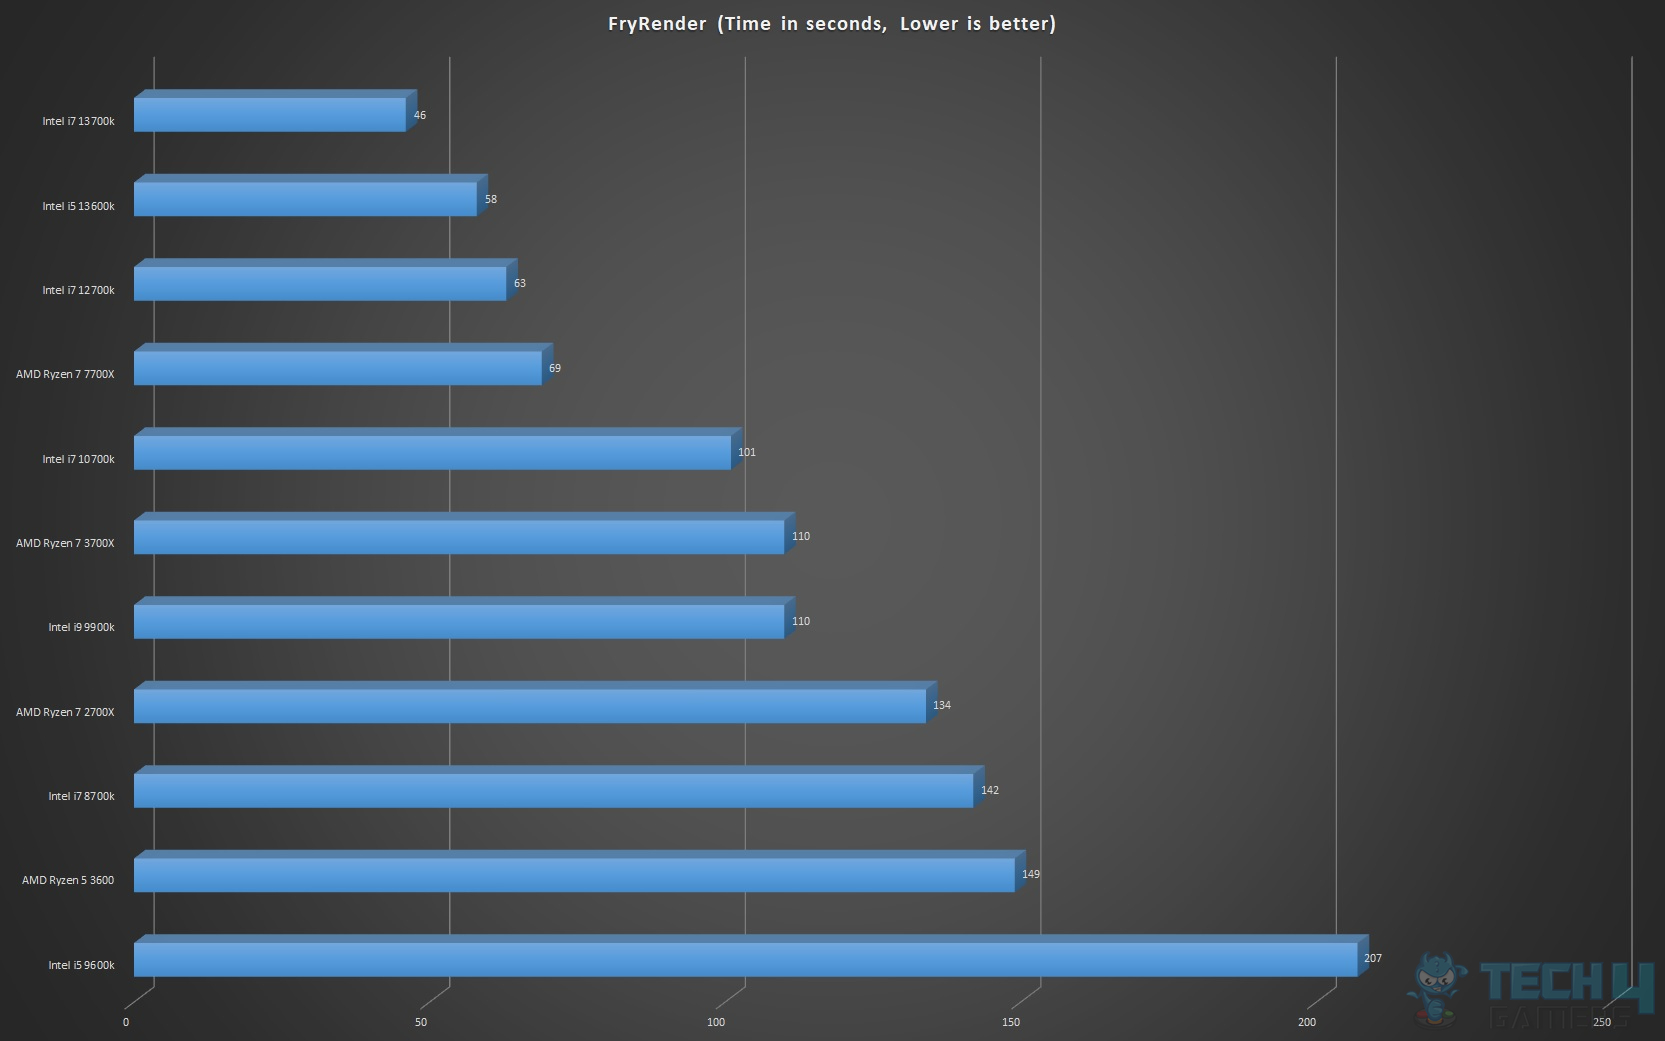
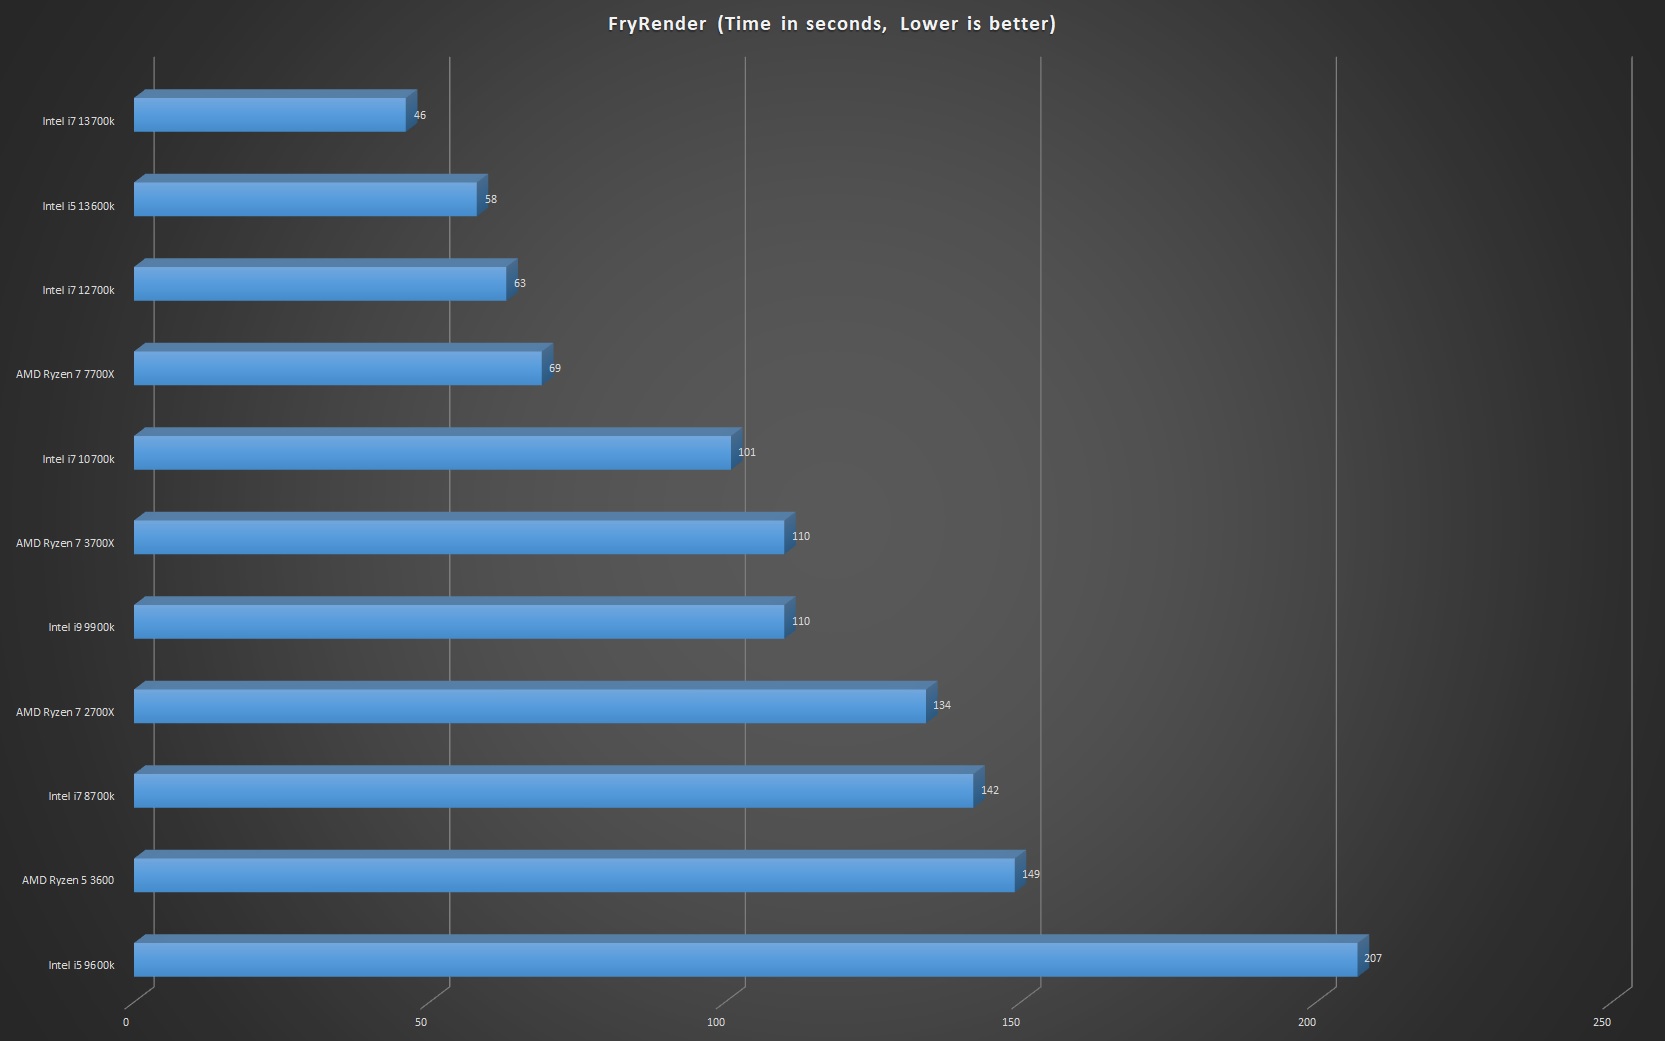
FryBench
Frybench is a multi-core CPU benchmark based on fryrender. fryrender is a physically-based light simulator developed by RandomControl, a Spanish company located in Madrid.
fryrender is a photo-realistic render engine where all elements involved in the generation of the final image (materials, lights, and cameras) are based on physically accurate models.
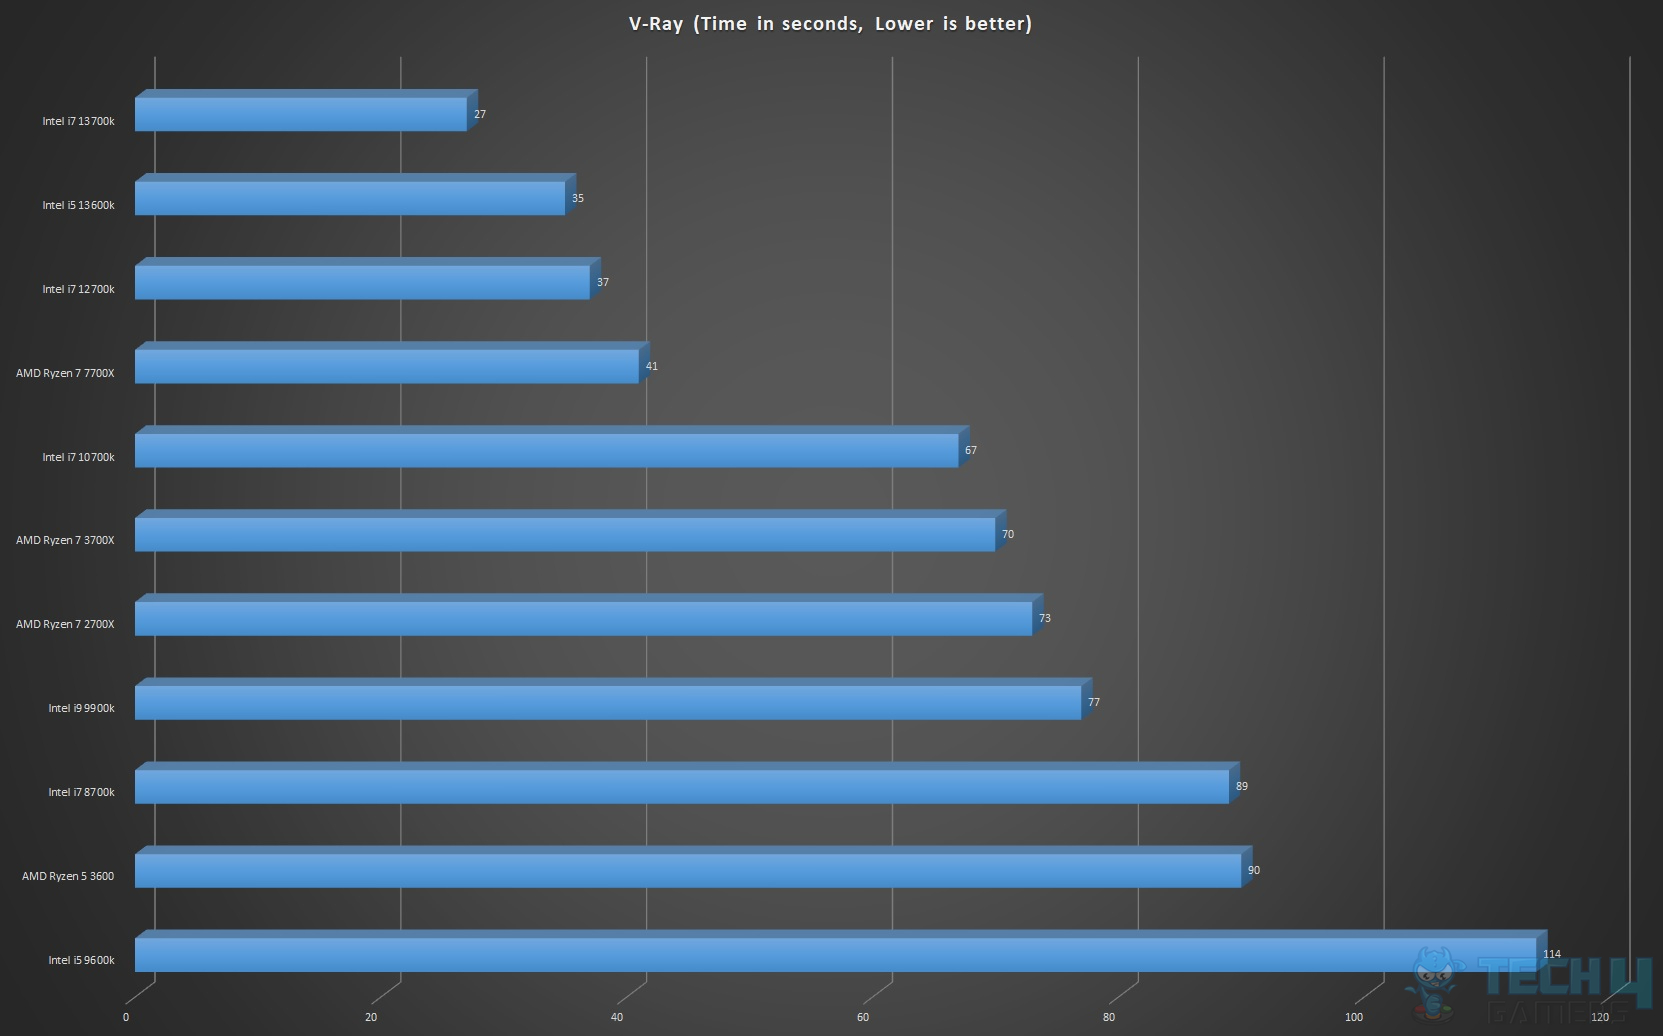
V-Ray
V-Ray Benchmark is a free stand-alone application to help you test how fast your hardware renders. The benchmark includes two test scenes, one for GPUs and another for CPUs, depending on the processor type you’d like to measure.
POV-Ray
The Persistence of Vision Ray Tracer, or POV-Ray, is a ray tracing program that generates images from a text-based scene description and is available for a variety of computer platforms. It was originally based on DKBTrace, written by David Kirk Buck and Aaron A. Collins for the Amiga computers.
There are also influences from the earlier Polyray[6] raytracer contributed by its author Alexander Enzmann. POV-Ray is free and open-source software with the source code available under AGPLv3.
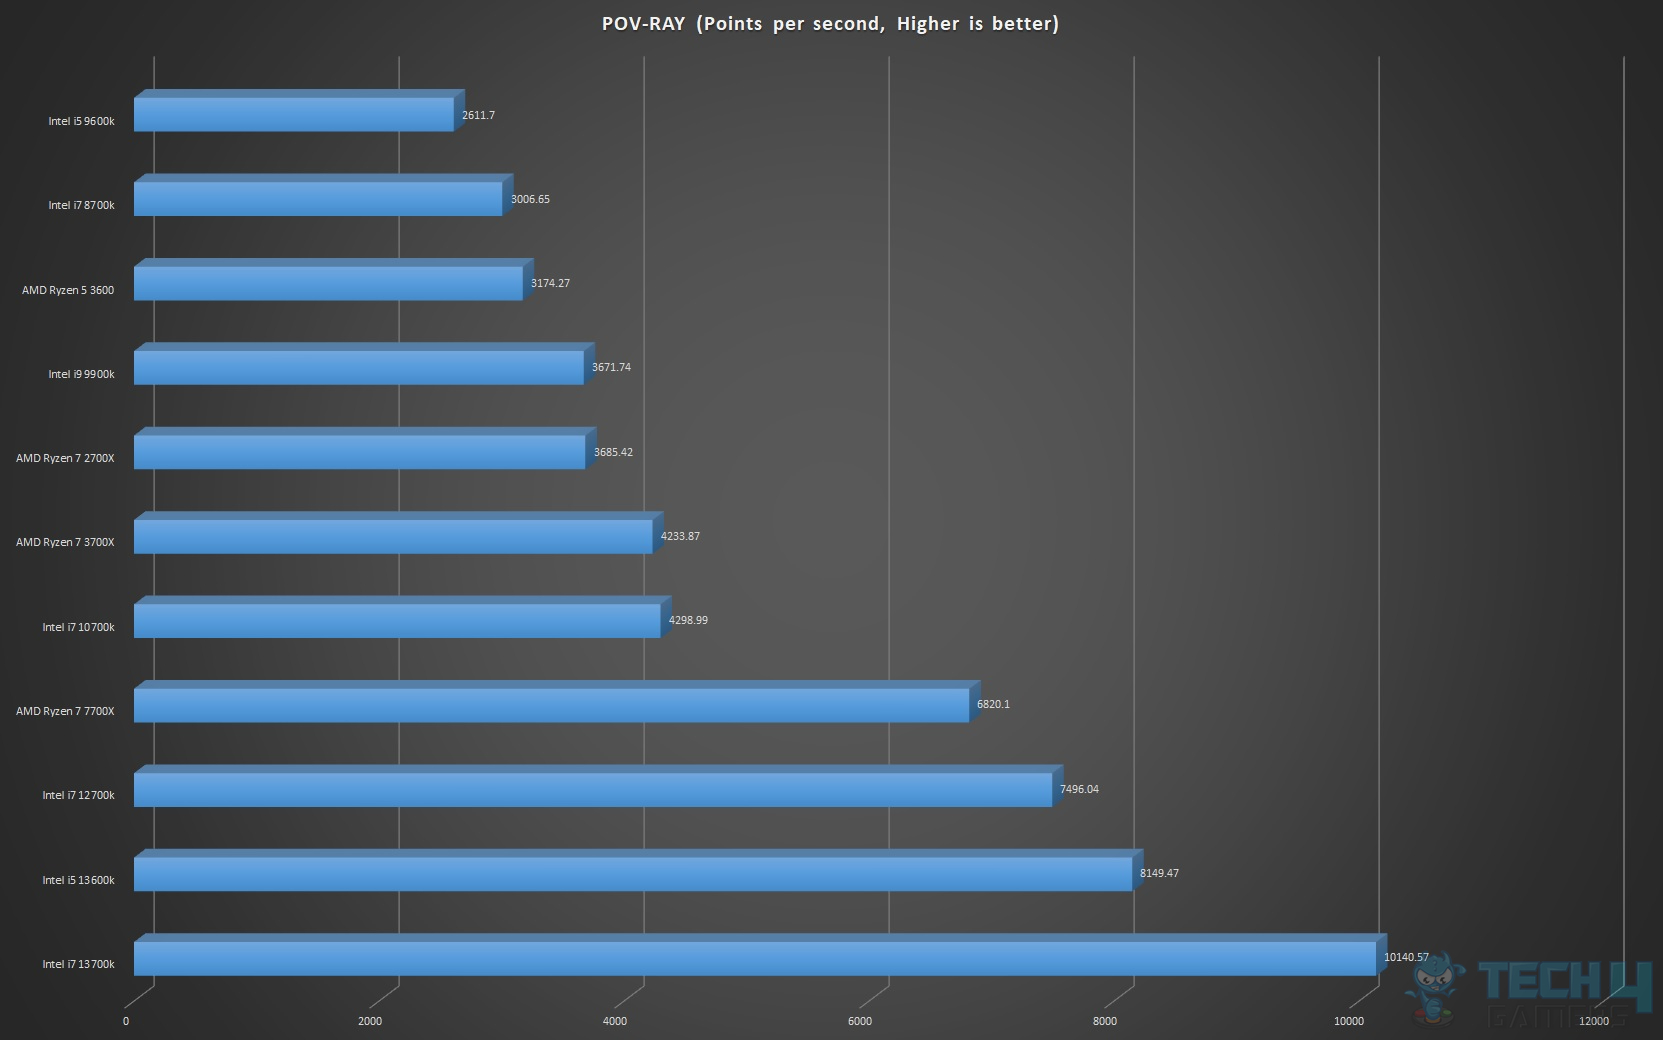
The result is in the points per second format; the higher, the better. The core i7 13700k has superb performance.
Indigo
Indigo Renderer is an unbiased, photorealistic GPU and CPU renderer aimed at ultimate image quality by accurately simulating the physics of light. State-of-the-art rendering performance, materials, and camera models – it’s all made simple through an interactive, photographic approach with few abstract settings, letting you concentrate on lighting and composing your imagery.
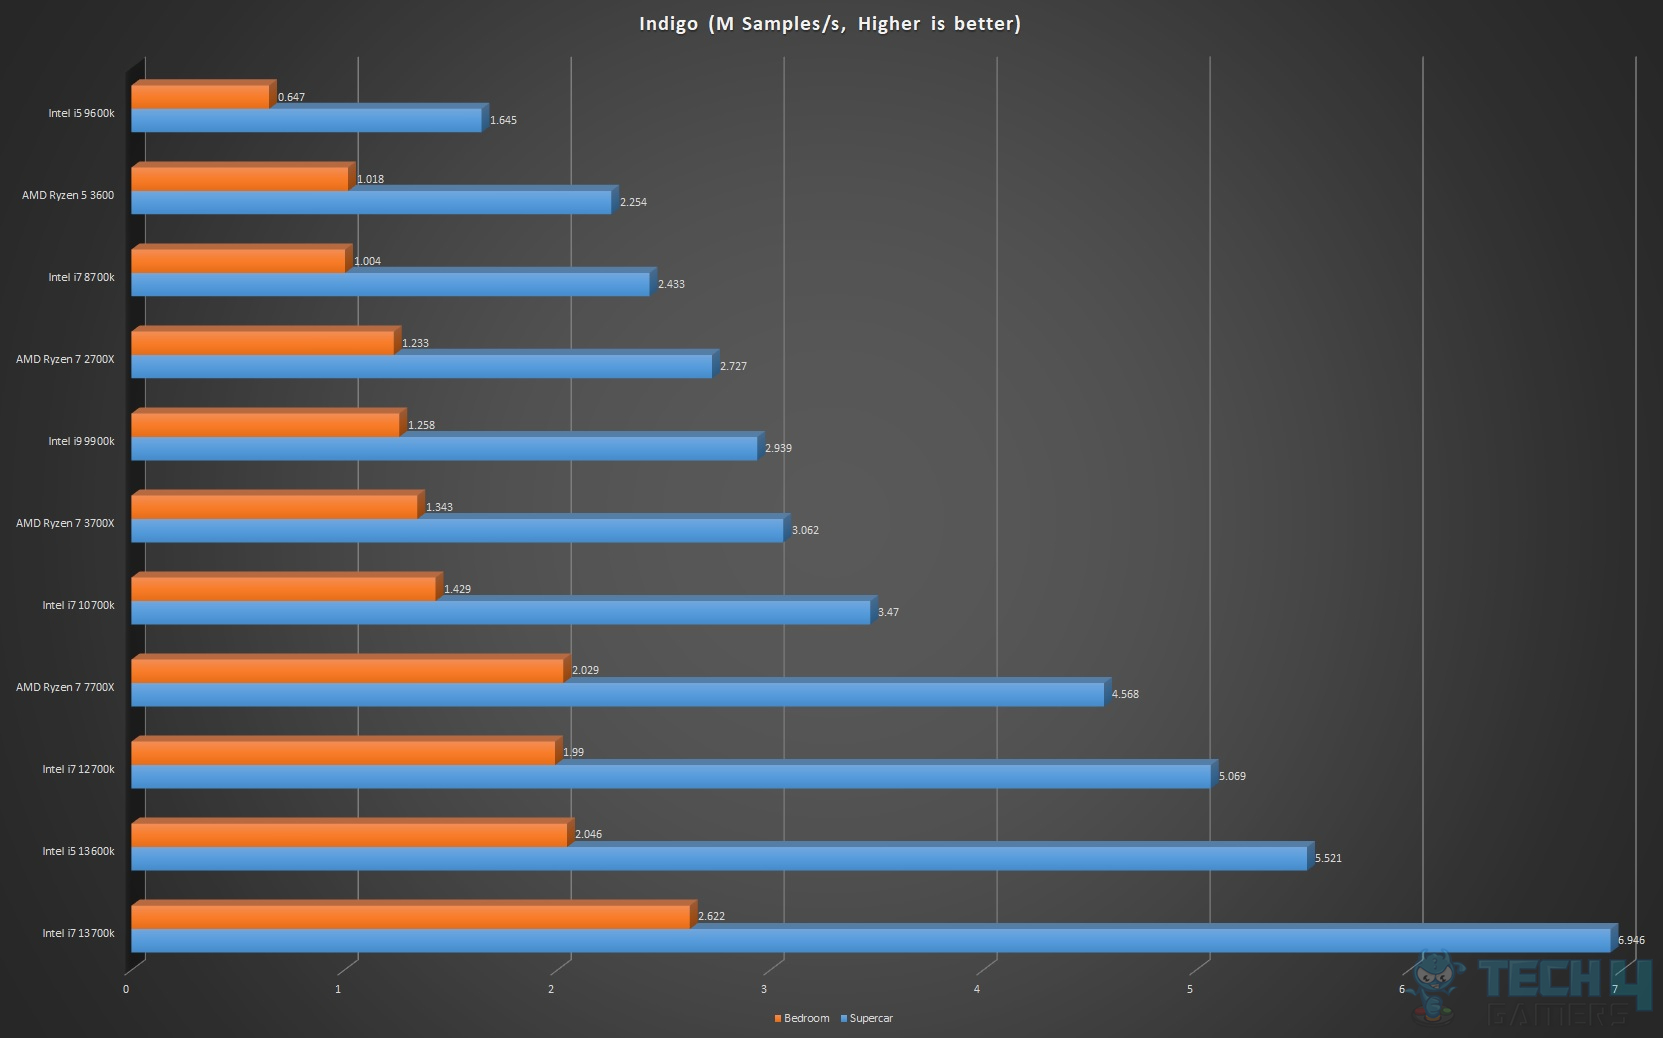
The result is in M Samples/sec; the higher, the better. The performance gain with core i7 13700k is impressive.
Cinebench R23
CINEBENCH is a real-world cross-platform test suite that evaluates a computer’s performance capabilities. CINEBENCH is based on MAXON’s award-winning animation software Cinema 4D, which is used extensively by studios and production houses worldwide for 3D content creation. MAXON software has been used in blockbuster movies such as Iron Man 3, Oblivion, Life of Pi or Prometheus, and many more.
CINEBENCH is the perfect tool to compare CPU and graphics performance across various systems and platforms (Windows and OS X). R23 is the latest version and includes the AVX load as well.
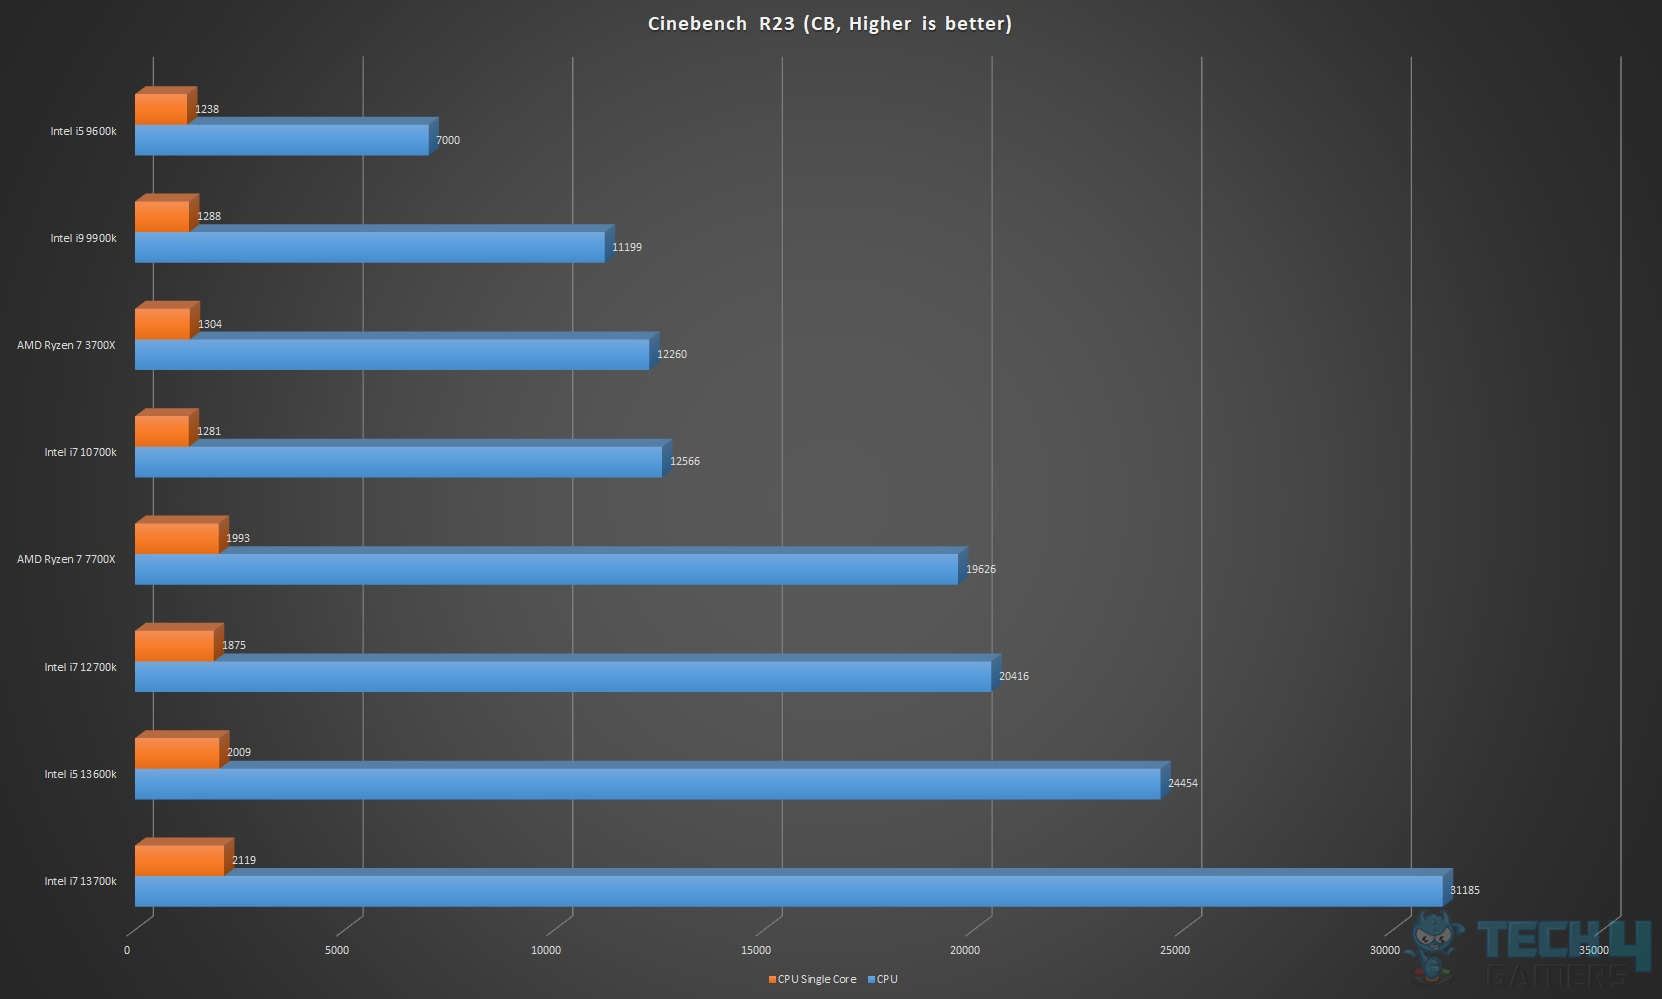
The Intel i7 13700k is rocking the graph with good scores in the multi-core and single-threaded tests.
Geekbench 5
Geekbench 5 measures your system’s power and tells you whether your computer is ready to roar. How strong is your mobile device or desktop computer? How will it perform when push comes to crunch? These are the questions that Geekbench can answer. In Geekbench, the result is in the form of Single Core and Multi-Core performance.
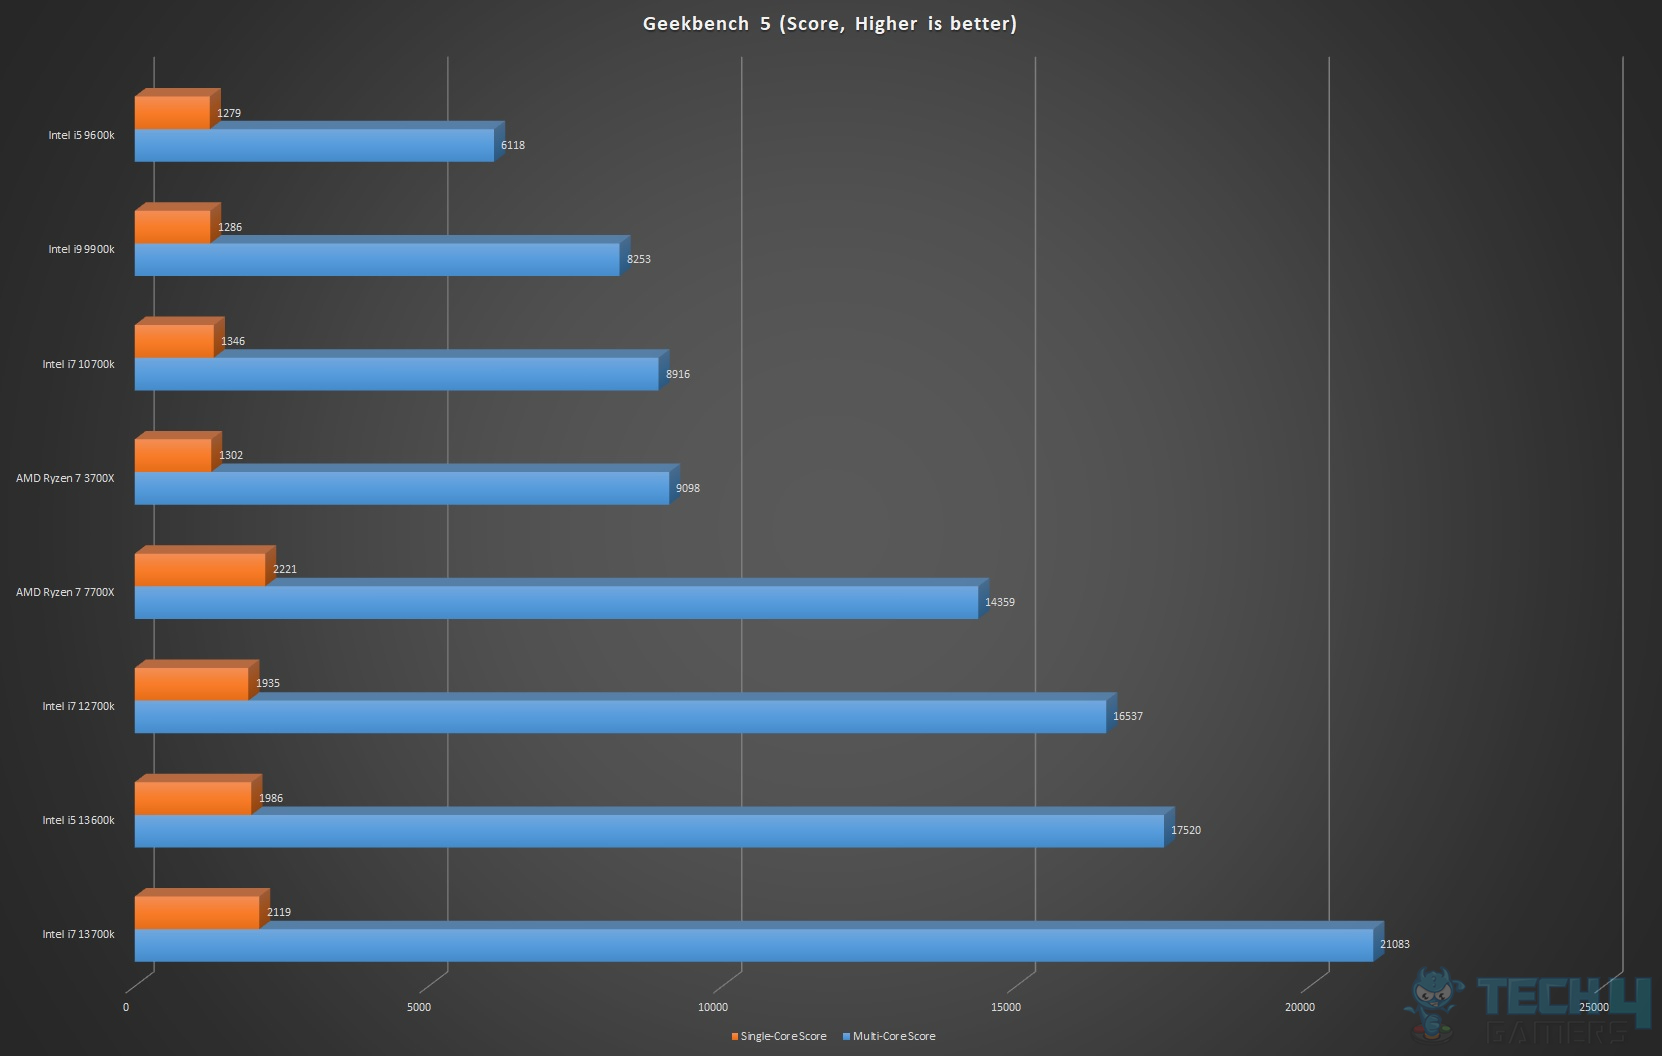
We are seeing a similar trend as in the Cinebench R23.
Transcoding
We have used Handbrake, X264 HD, and X265 HD Benchmarks to measure the transcoding performance of the CPU.
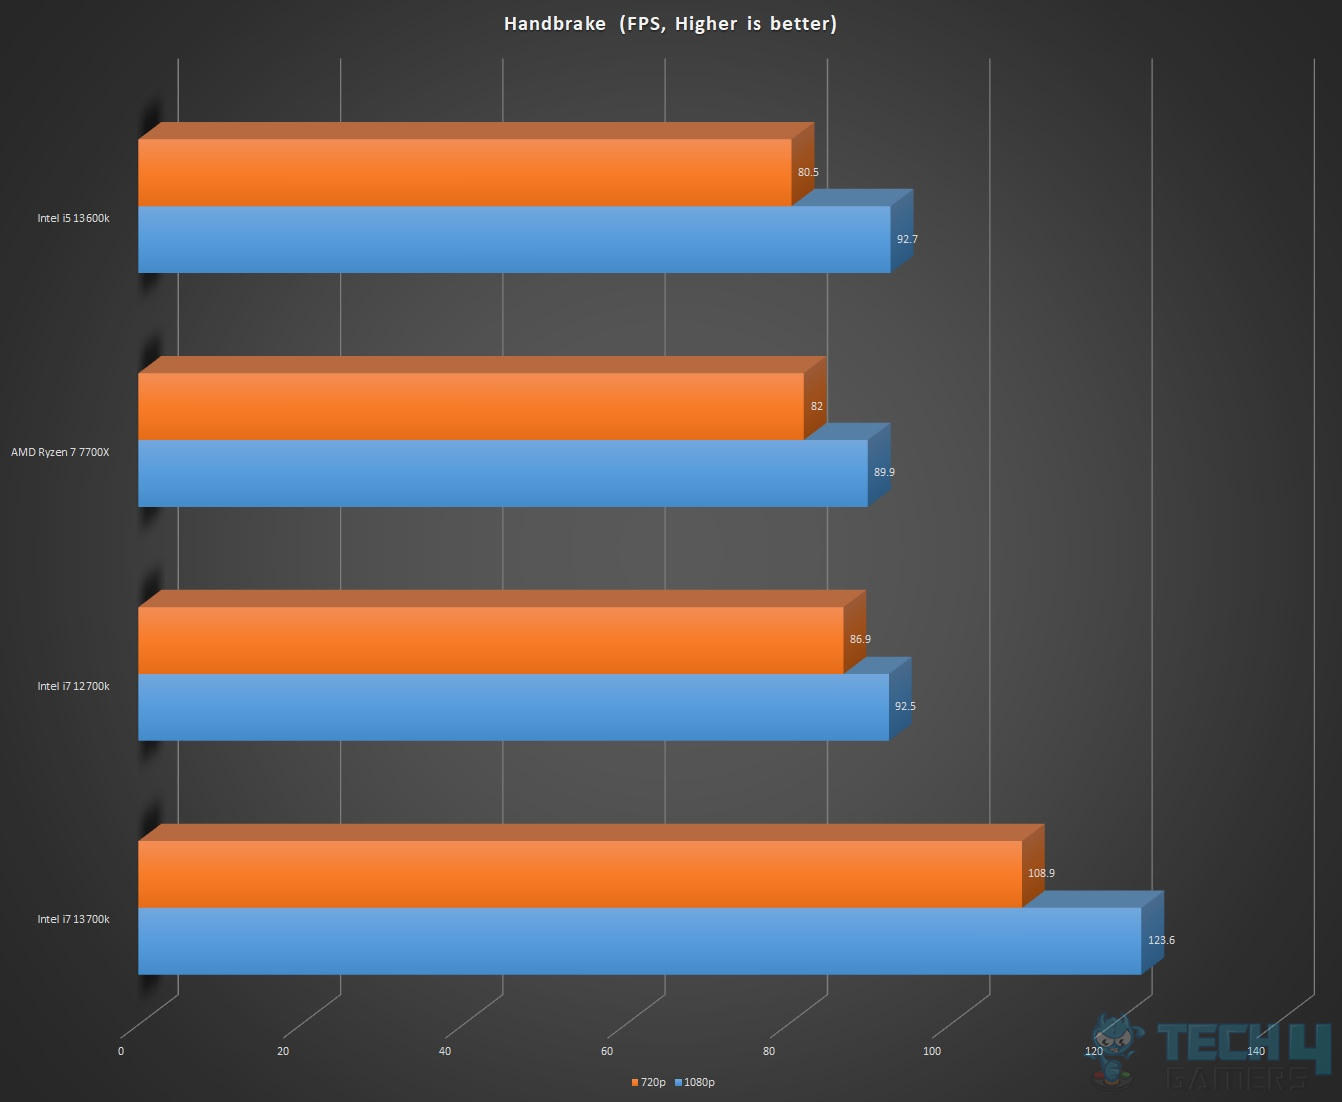
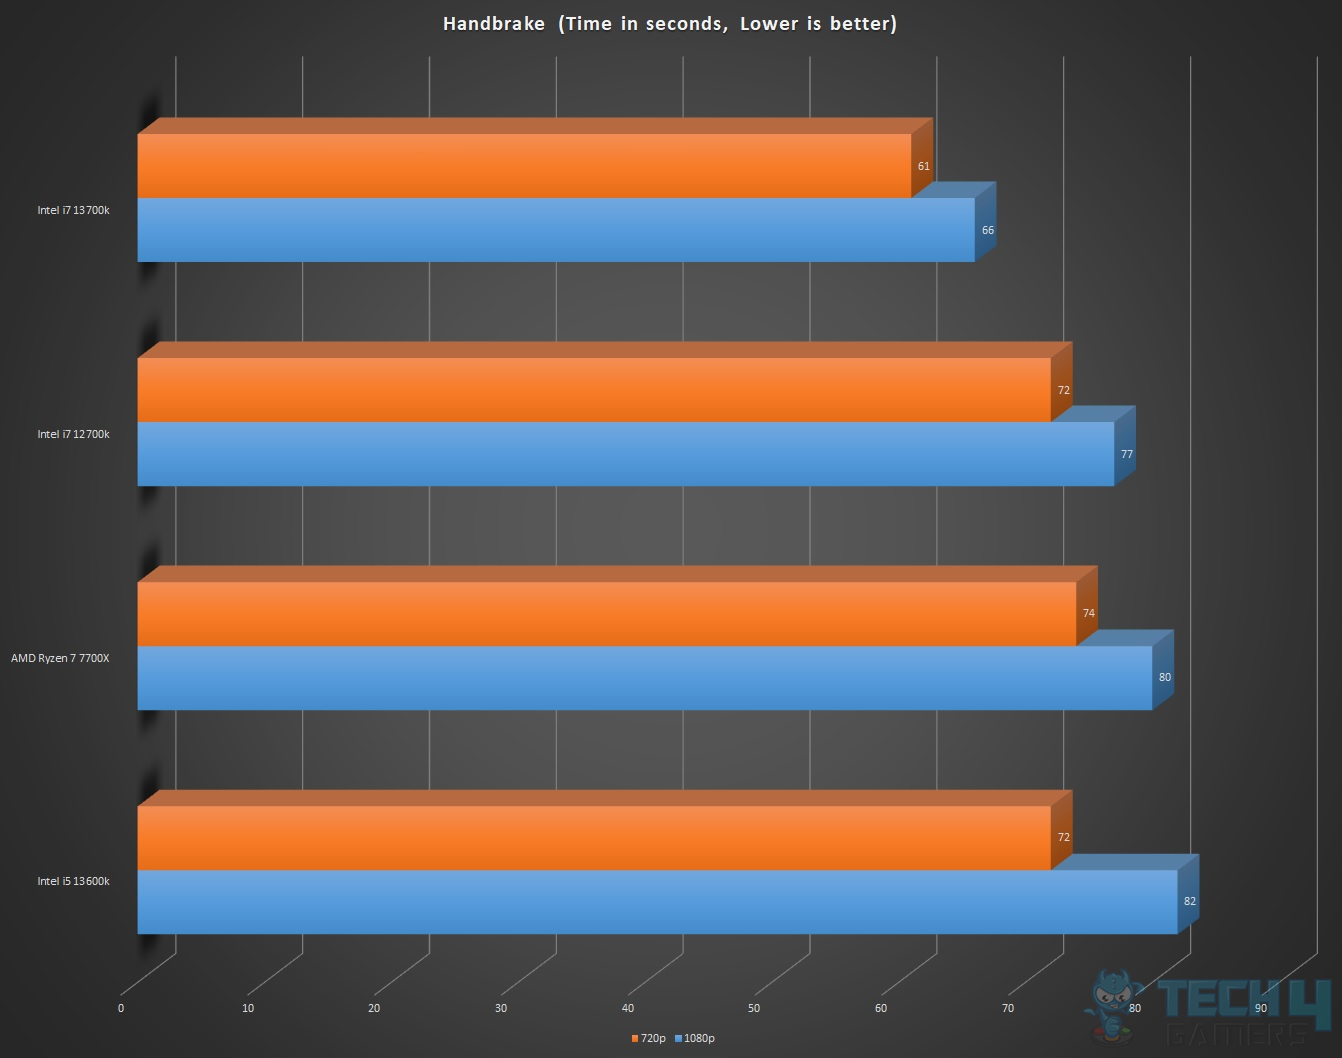
Handbrake
HandBrake is an open-source tool built by volunteers for converting video from nearly any format to a selection of modern, widely supported codecs.
X264 HD Benchmark
x264 HD Benchmark is a benchmark that allows you to measure how fast your PC can encode a 1080p video clip into a high-quality x264 video file. It allows for easy comparison because everyone running it will use the same video clip and software.
The x264 video encoder has a fairly accurate internal benchmark (in frames per second) for each pass of the video encode, and it also uses multi-core processors very efficiently. All these factors make the x264 HD Benchmark an ideal tool for comparing the video encoding performance of different processors and systems.
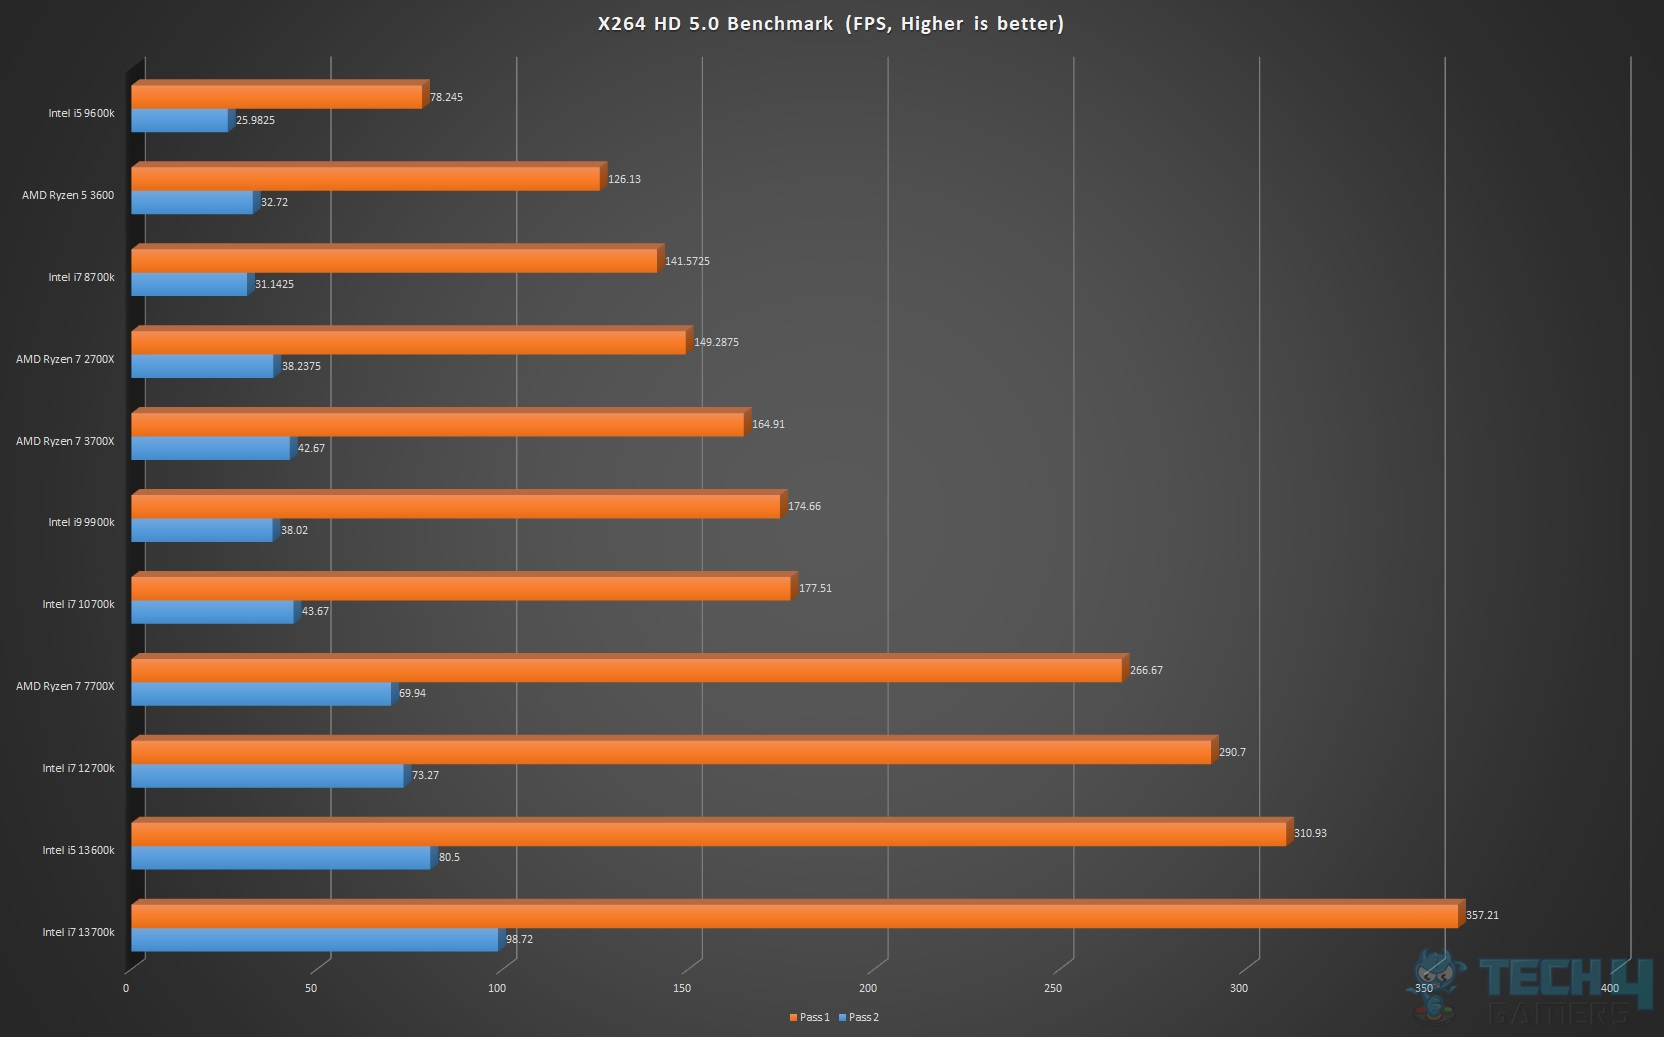
The reported result is in FPS. It is calculated by summing up the FPS count on each run of each pass and dividing it by 4, as there are 4 runs per pass. The average result is what is reported on the graph. A Higher FPS count means better performance. Clearly, the Intel core i7 13700k is winning the game.
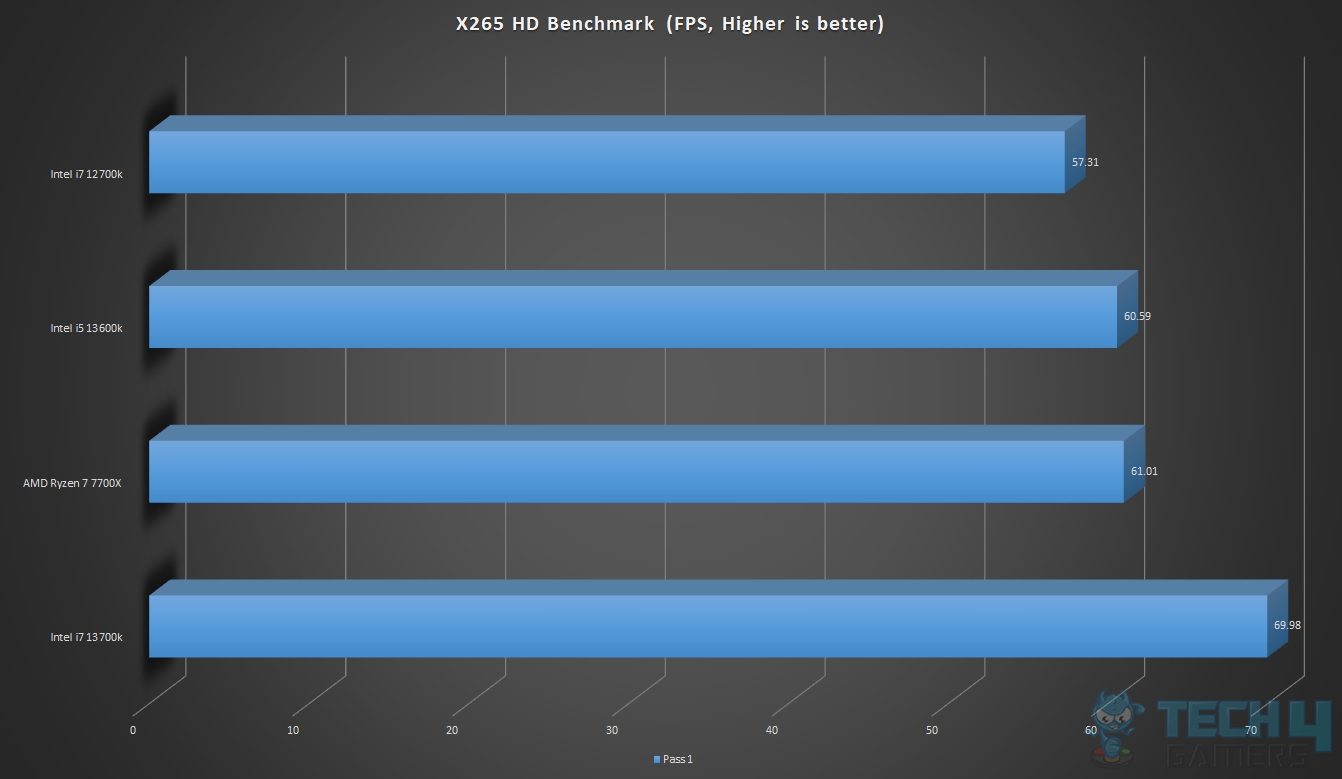
X265 HD Benchmark
The result is reported in terms of frame per second and encoding time.
Web-based benchmarks
Just to give an idea of how the CPUs impact general web browsing, we ran a few benchmarks.
Kraken
Kraken is a JavaScript performance benchmark created by Mozilla that measures the speed of several different test cases extracted from real-world applications and libraries.
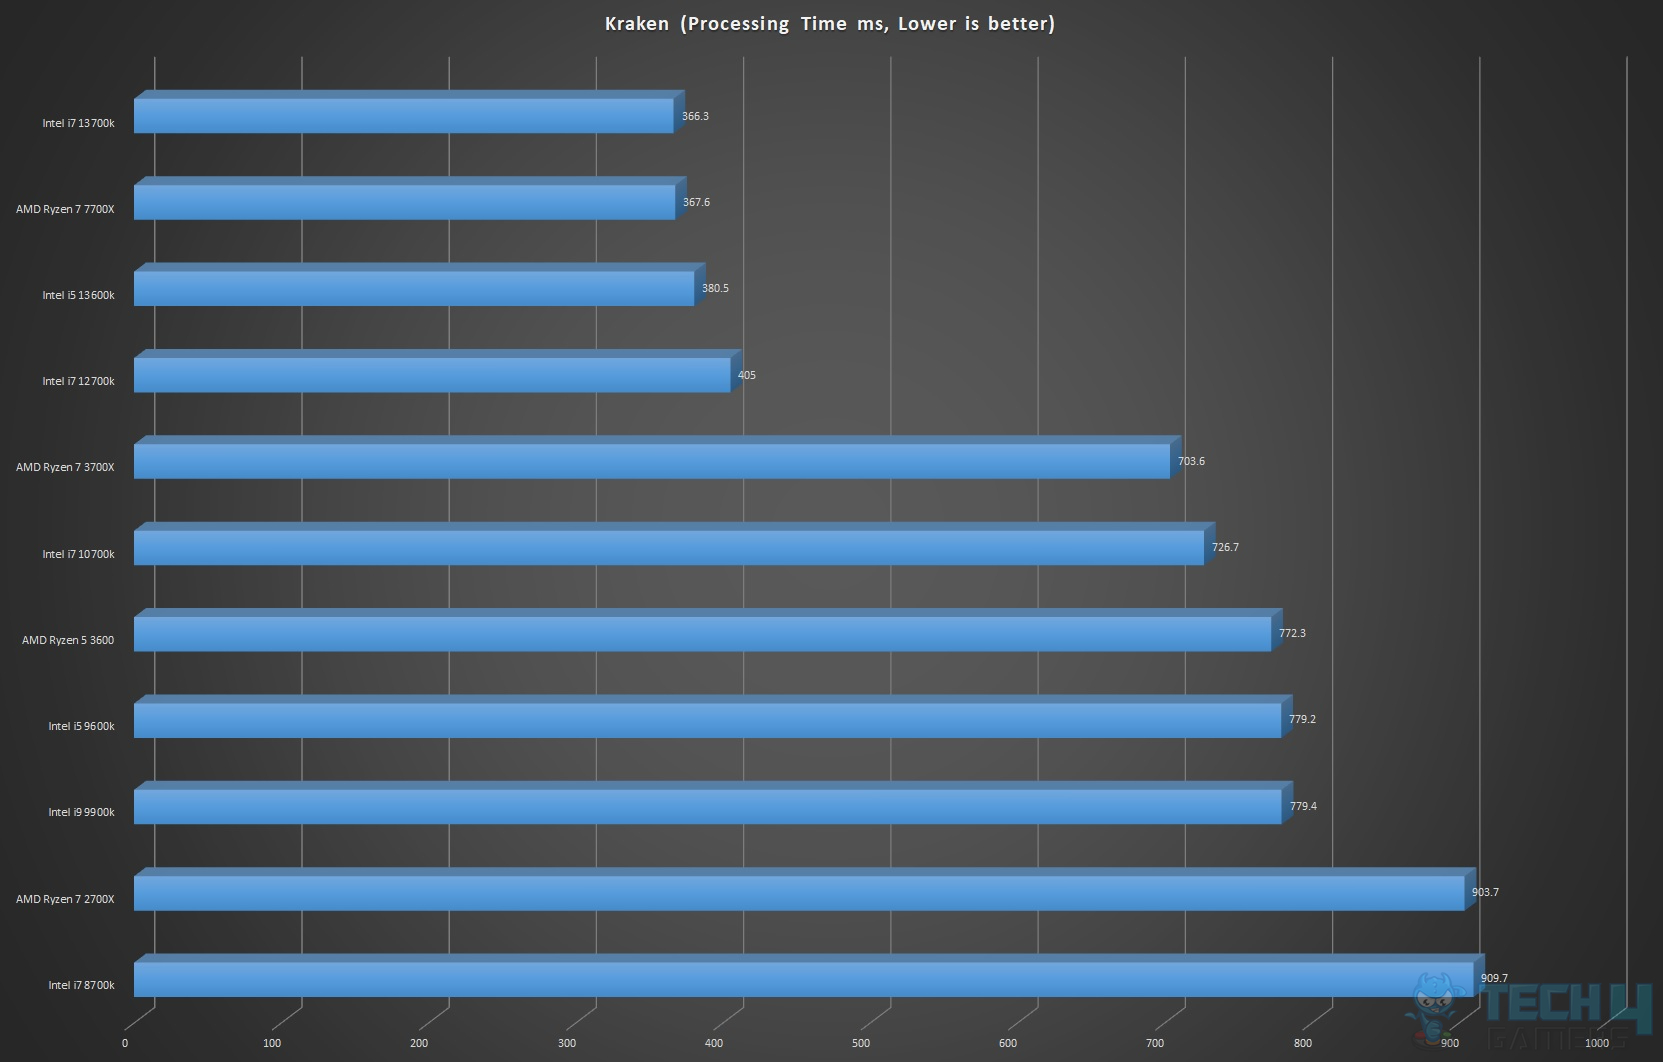
Processing time is reported in seconds; lower is better. The Ryzen 7 7700X and Intel core i7 13700k are almost neck to neck.
Octane
Octane 2.0 is a benchmark that measures a JavaScript engine’s performance by running a suite of tests representative of certain use cases in JavaScript applications. Please note that Octane is retired and no longer maintained. We have used it to give an idea of the performance only.
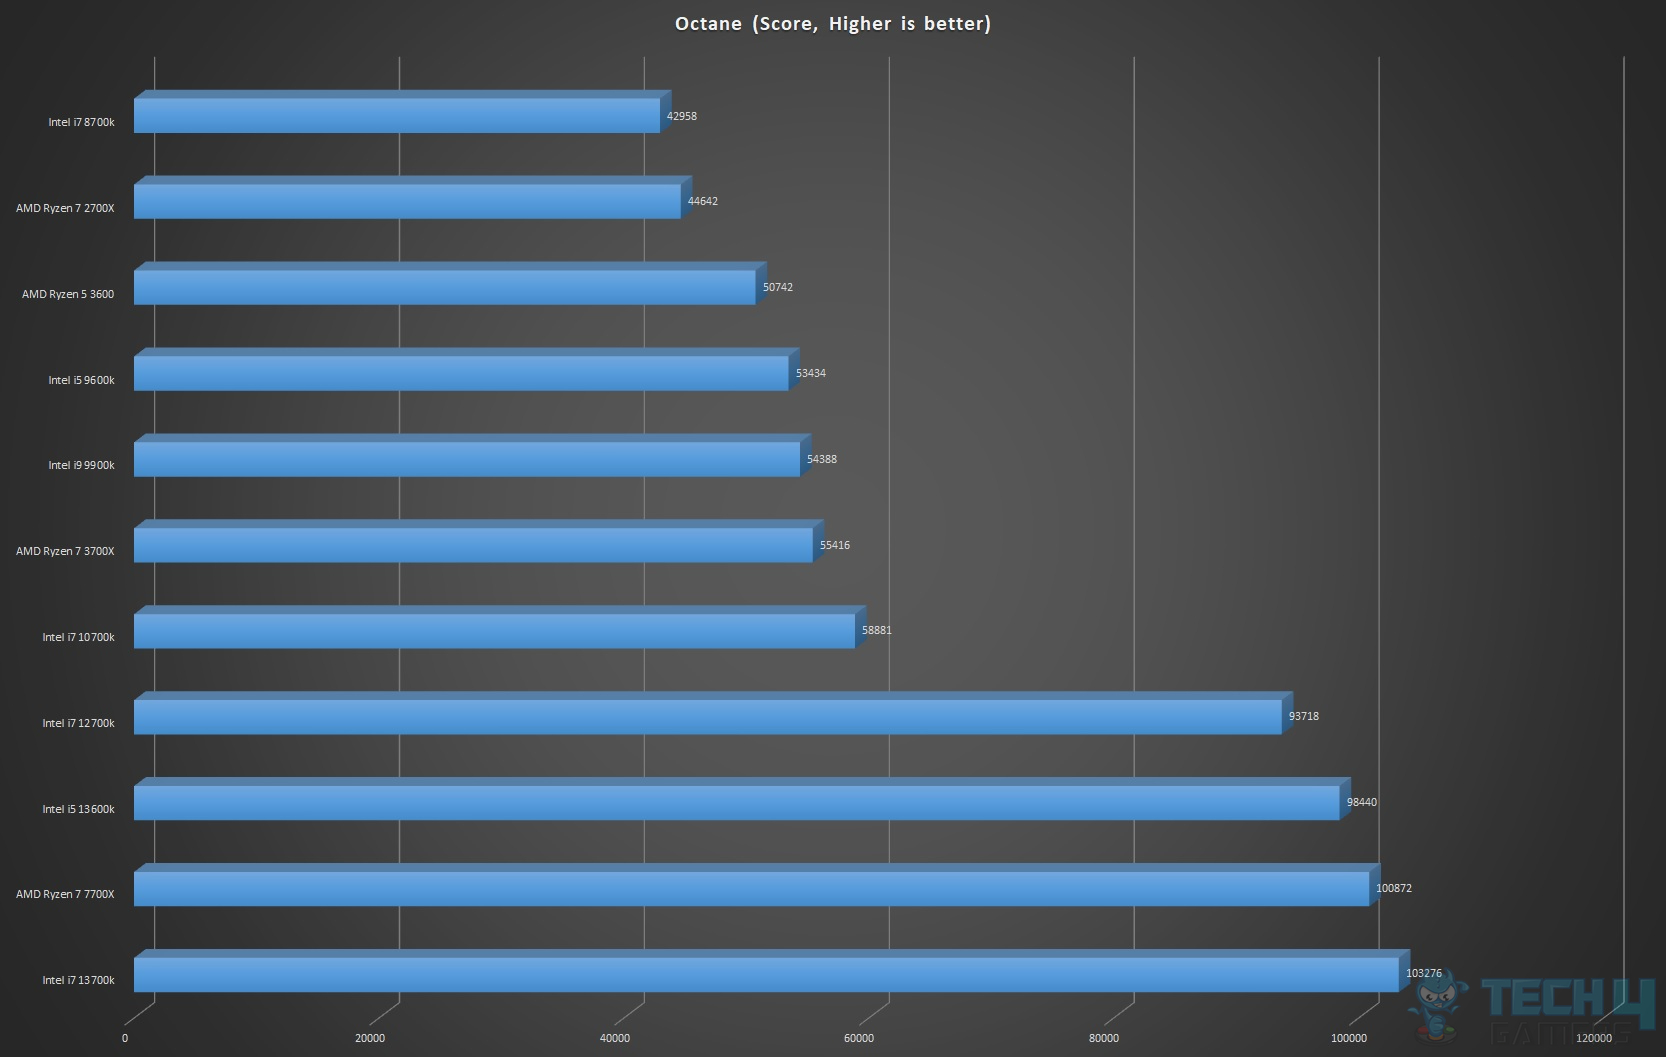
The Intel core i7 13700k packs a solid performance.
WebXPRT 4
WebXPRT 4 is a browser benchmark that compares the performance of almost any web-enabled device. It contains HTML5, JavaScript, and WebAssembly-based scenarios created to mirror the tasks you do every day: Photo Enhancement, Organize Album Using AI, Stock Option Pricing, Encrypt Notes and OCR Scan using WASM, Sales Graphs, and Online Homework. Use WebXPRT to see exactly how well different devices handle real-world tasks.
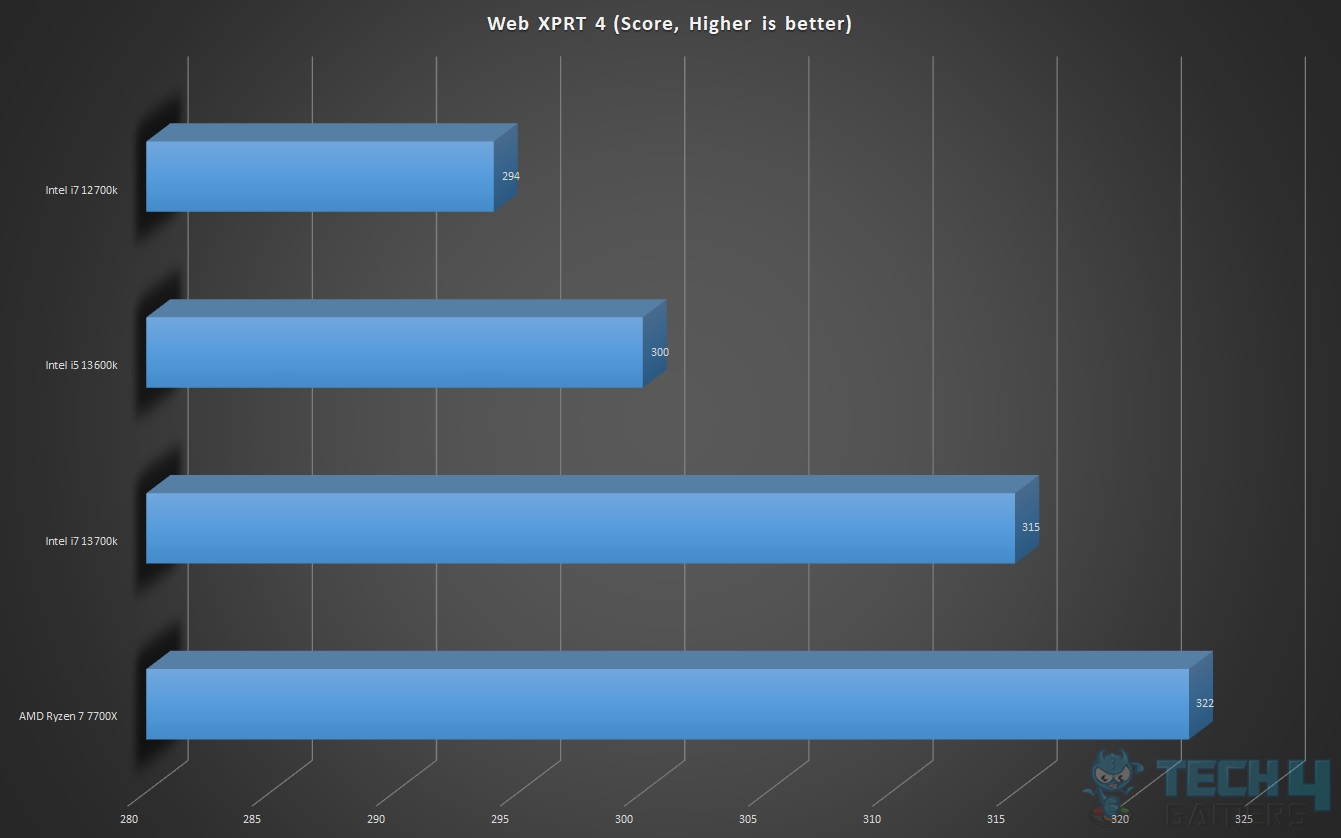
Ryzen 7 7700X packs a solid performance.
In the web-based tests, the i7 13700k has managed a fine closure over the i7 12700k, but the performance is comparable with the 7700X.
Gaming Benchmarks
Let’s start with the synthetic benchmarks. For this purpose, we have used 3DMark Fire Strike and Time Spy benchmarks.
Fire Strike
Fire Strike is a showcase DirectX 11 benchmark for modern gaming PCs. Its ambitious real-time graphics are rendered with detail and complexity far beyond other DirectX 11 benchmarks and games. Fire Strike includes two graphics tests, a physics test and a combined test that stresses the CPU and GPU.
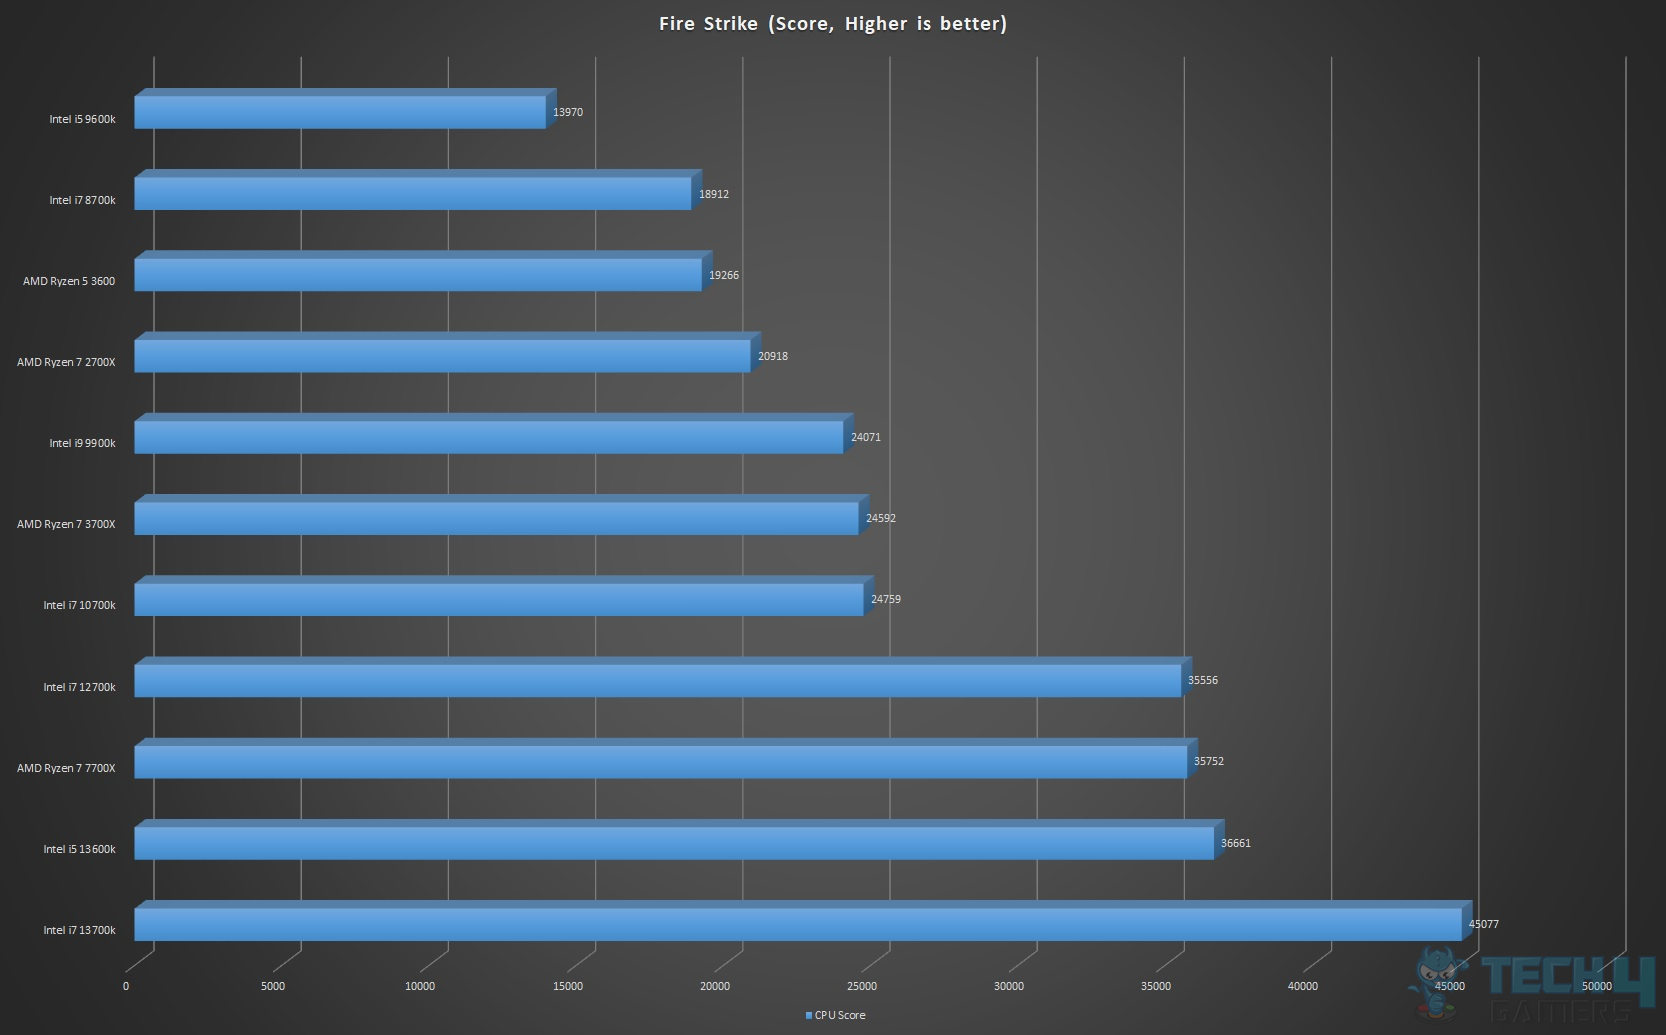
We have included the CPU score only to showcase the result coming from the CPU only and not the graphics card. The Intel i7 13700k is the topper here.
Time Spy
3DMark Time Spy is a DirectX 12 benchmark test for Windows 10 gaming PCs. Time Spy is one of the first DirectX 12 apps to be built the right way from the ground up to fully realize the performance gains that the new API offers. With its pure DirectX 12 engine, which supports new API features like asynchronous computing, explicit multi-adapter, and multi-threading, Time Spy is the ideal test for benchmarking the latest graphics cards.
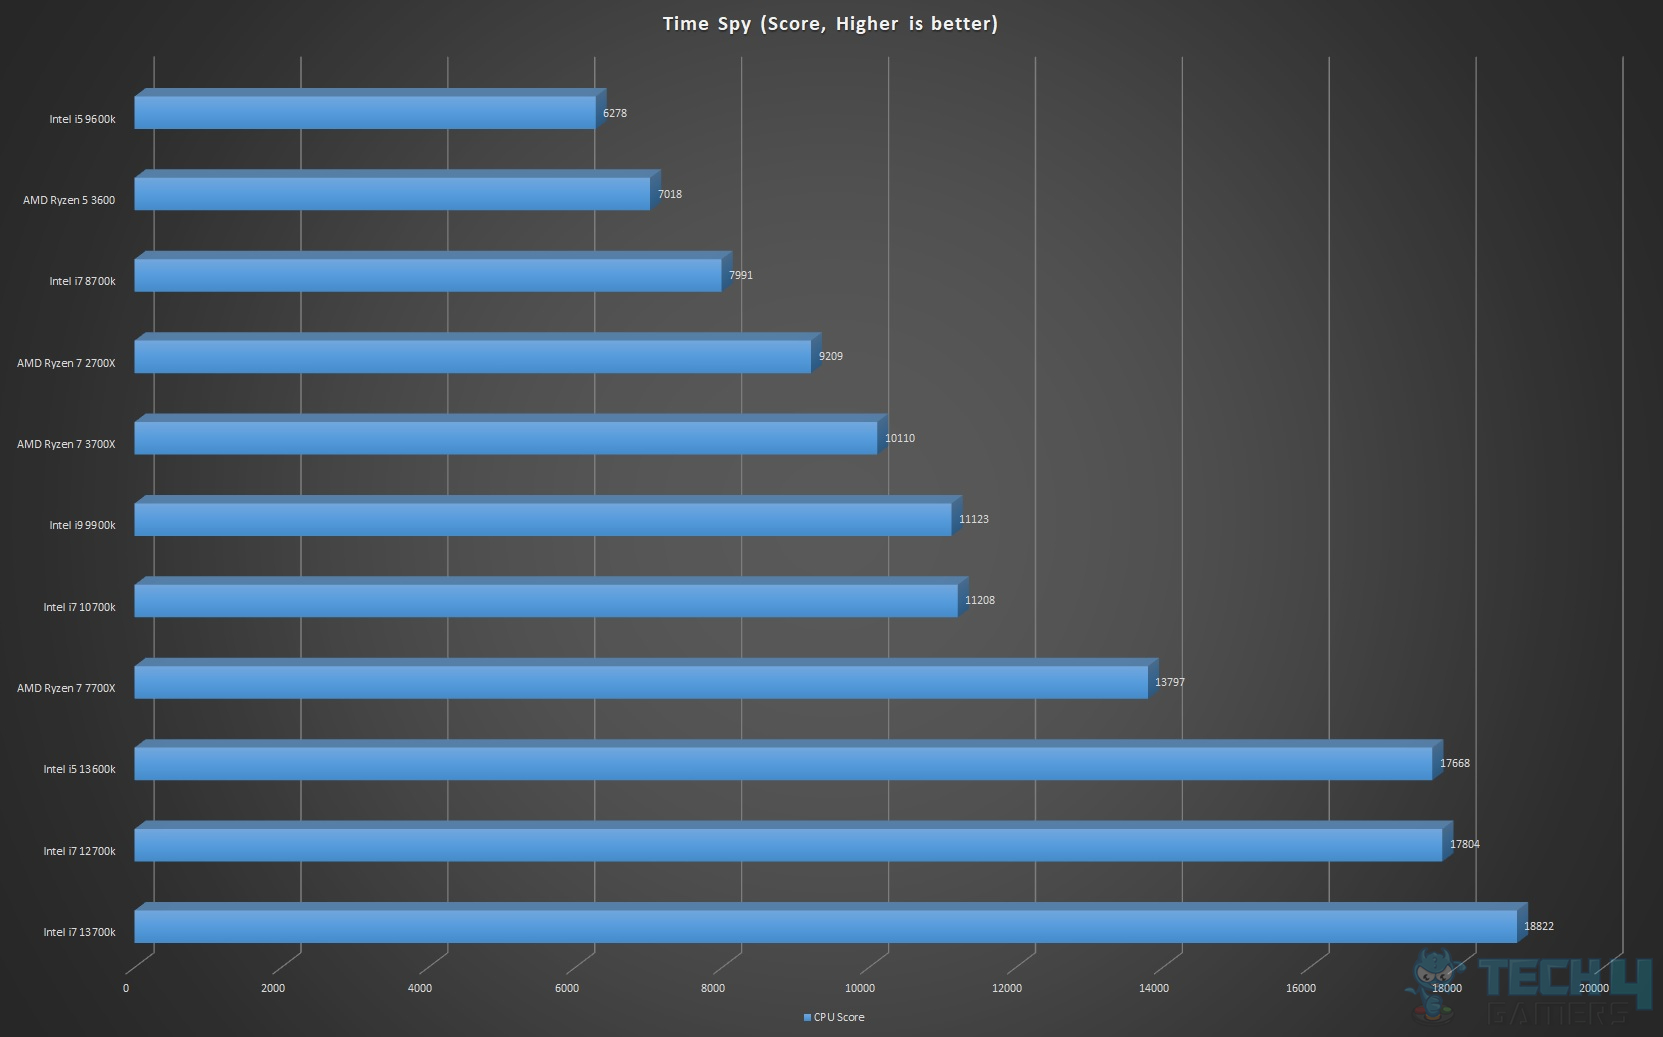
We have included the CPU score only to showcase the result coming from the CPU only and not the graphics card.
We have tested the games on 1080P and 1440P resolutions. The 2160P was dropped as we know that the higher resolutions are less CPU demanding than the lower resolutions.
1080P Gaming Performance
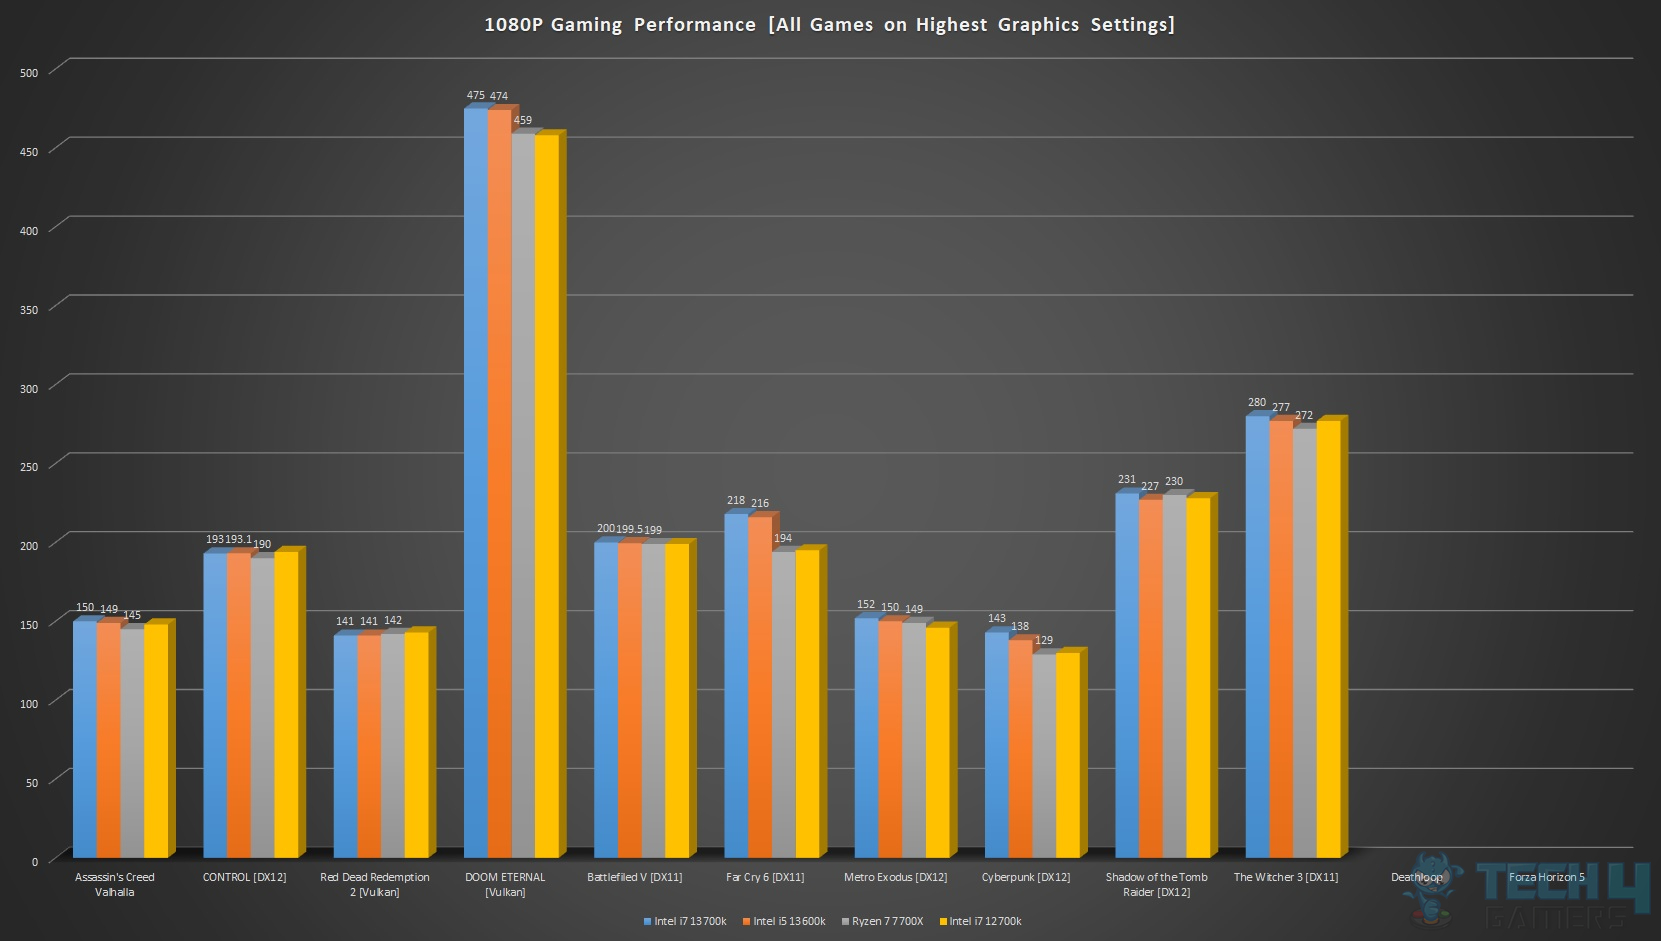
The core i7 13700k has shown a good performance all around.
1440P Gaming Performance
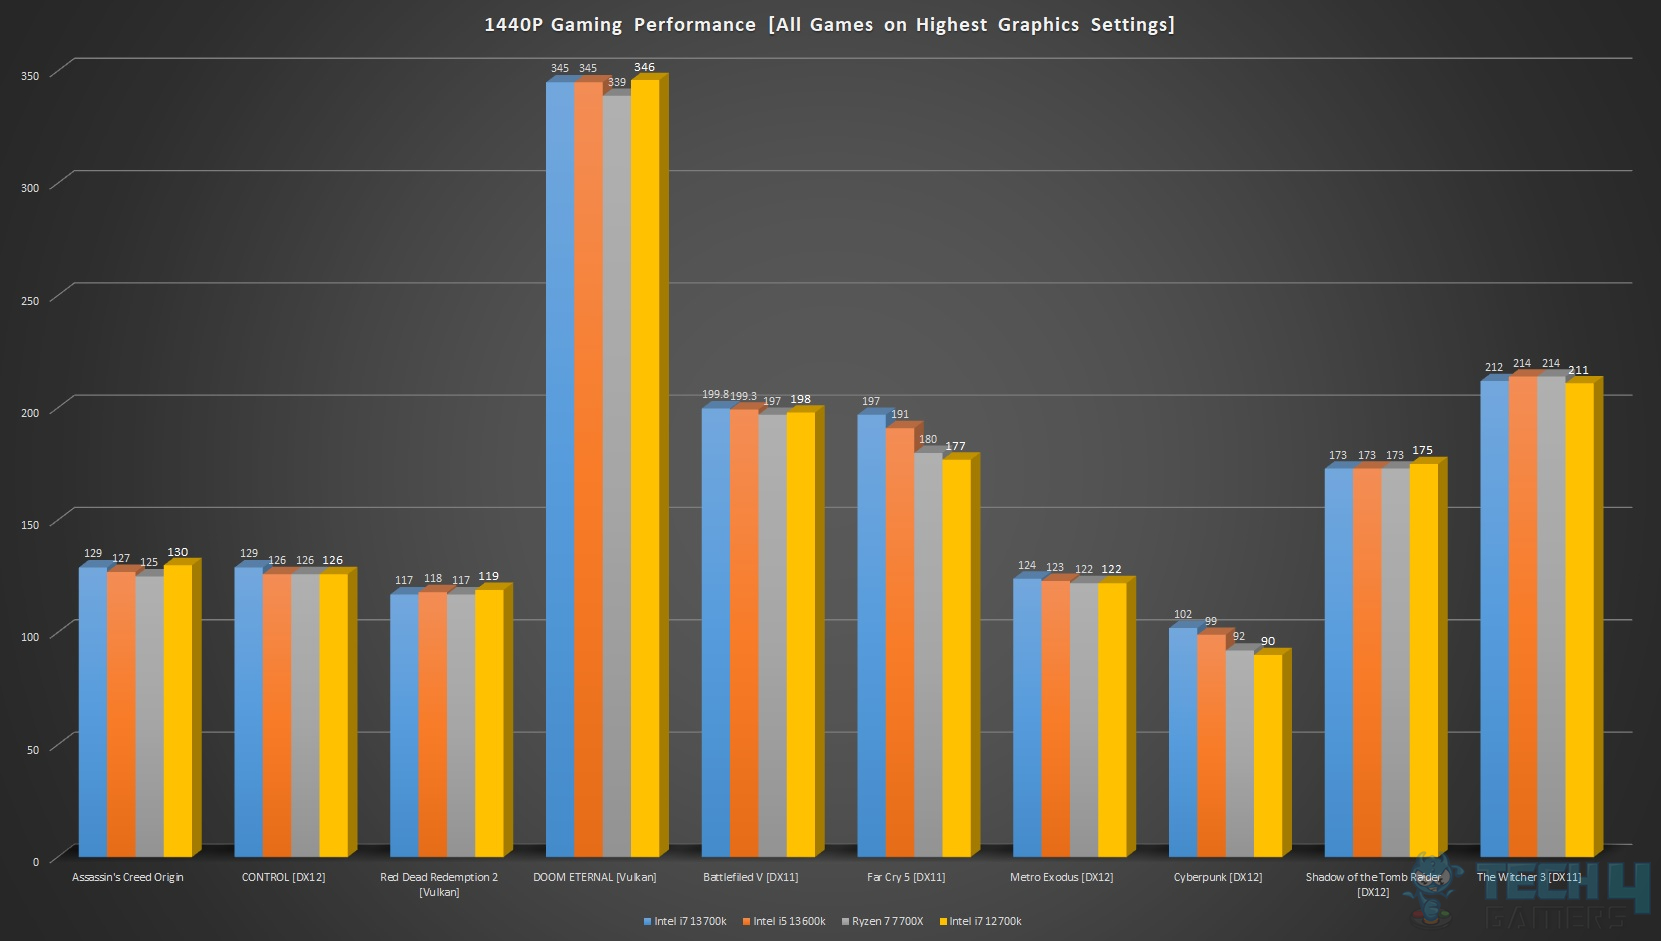
Almost a similar result here as well.
Frequency Behavior
The Intel i7 13700k has a base clock of 3.40GHz and 2.50GHz for the P-Cores and E-Cores, respectively. The turbo frequency is 5.3GHz for the P-Cores and 4.2GHz for the E-Cores. The Turbo Boost Max Technology 3 is 5.4GHz. Please, keep in mind that this turbo frequency is for a single core only, depending upon the load type, and there is a multitude of variables that could affect this turbo frequency. For example, the thermal headroom, power limit, cooling solution, thermal paste application, how good a motherboard is, etc., and the load type.
Our unit was boosting to 5.3GHz (P-Cores) and (4.2GHz E-Cores) out of the box. This is not it. The CPU actually maintained these clocks under multi-core and single-core loads using Blender, and Cinebench R23 runs.
The core i7 13700k managed to boost to 5.4GHz under the single-threaded load. We can confirm the turbo frequency and turbo boost 3 frequency.
Thermals and Power
We have tested the Intel i7 13700k on the GIGABYTE Z790 AORUS ELITE AX motherboard with the latest BIOS update. This is not a high-end motherboard but it still packs enough juice for the i5 and i7 CPUs. From the cooling perspective, we have set up a custom loop on the test bench when the CPU arrives for testing. The setup consists of:
- AlphaCool Eisblock XPX AURORA PRO Digital RGB – Full Brass
- AlphaCool Eisbecher AURORA with Apex VPP Pump
- AlphaCool NexXxos XT45 Full Copper SuperNova 1260mm Radiator
- AlphaCool Black Tube 16/10mm
- AlphaCool Straight Compression Fittings 16/10
- AlphaCool 45/90° Rotary Adapters
- AlphaCool Quick-Disconnect Fittings
- AlphaCool Clear Coolant
- 9x be quiet! Silent Wings 4 140mm PWM High-Speed Fans
The thermal paste used is AlphaCool SubZero, with a thermal conductivity rating of 16W-mK. In that, we have covered three aspects:
- Adequate Motherboard
- Powerful Cooling
- A high-grade thermal paste
We left the system idle for like 30 minutes and used HWInfo64 to monitor the thermals and power usage.
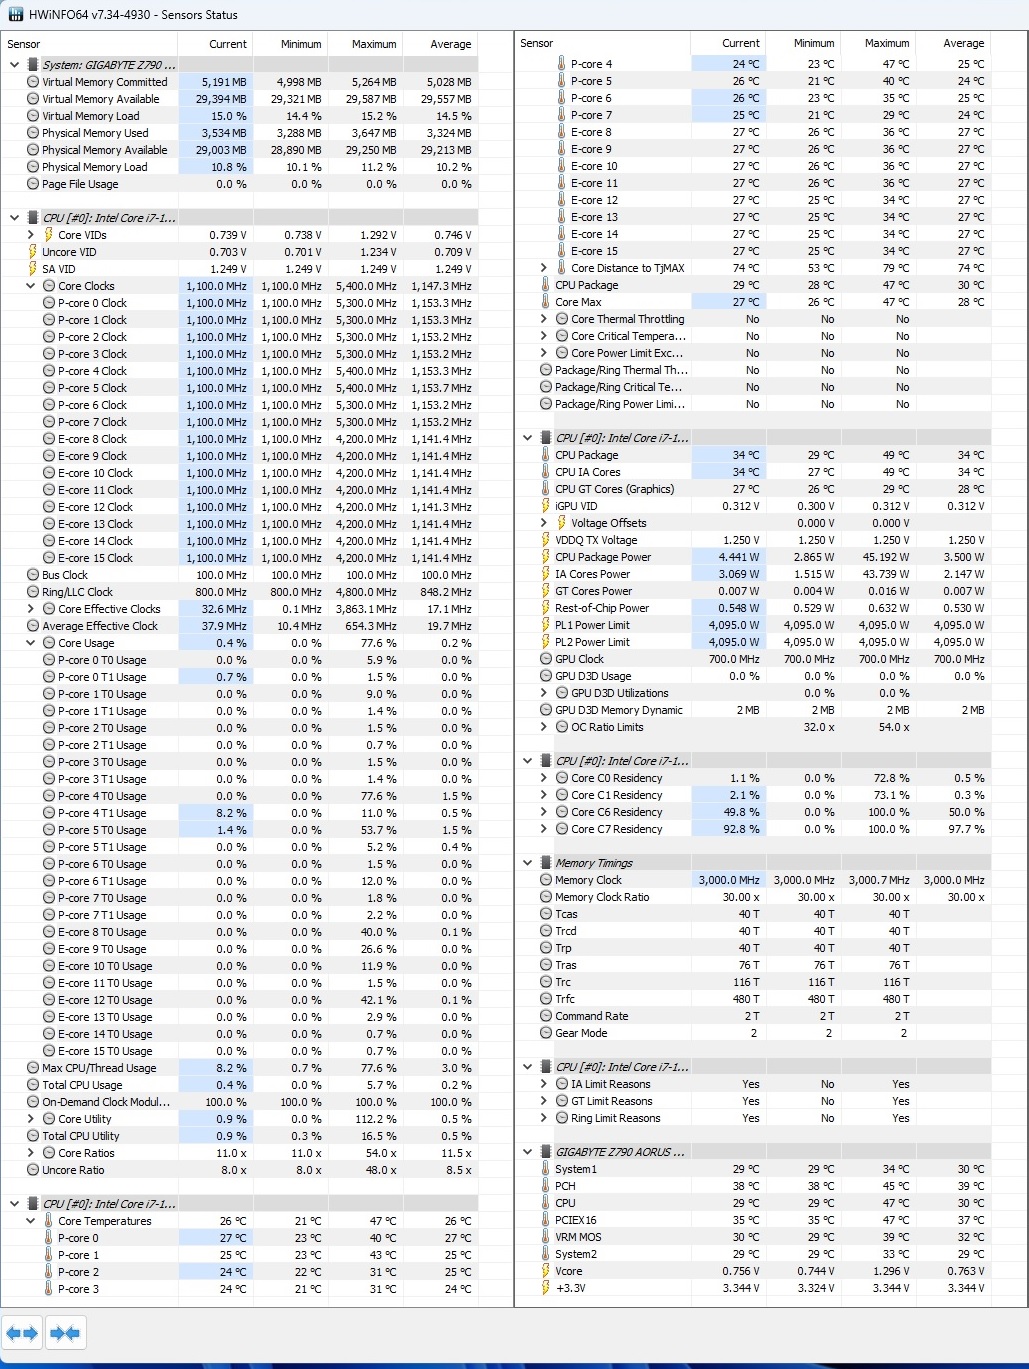
As can be seen in the above picture, the minimum package temperature was 28°C at an ambient of 19.9°C, and the package power was 2.865W.
The minimum frequency was 1.10GHz on any core during idling. The overall stats are good. Please keep in mind that this is a hybrid architecture. If you take the Core Temperature sensor into consideration, then the idling is at 21°C.
Next, we run a Cinebench R23 30-minute run on the CPU and monitor the stats using the HWInfo64.
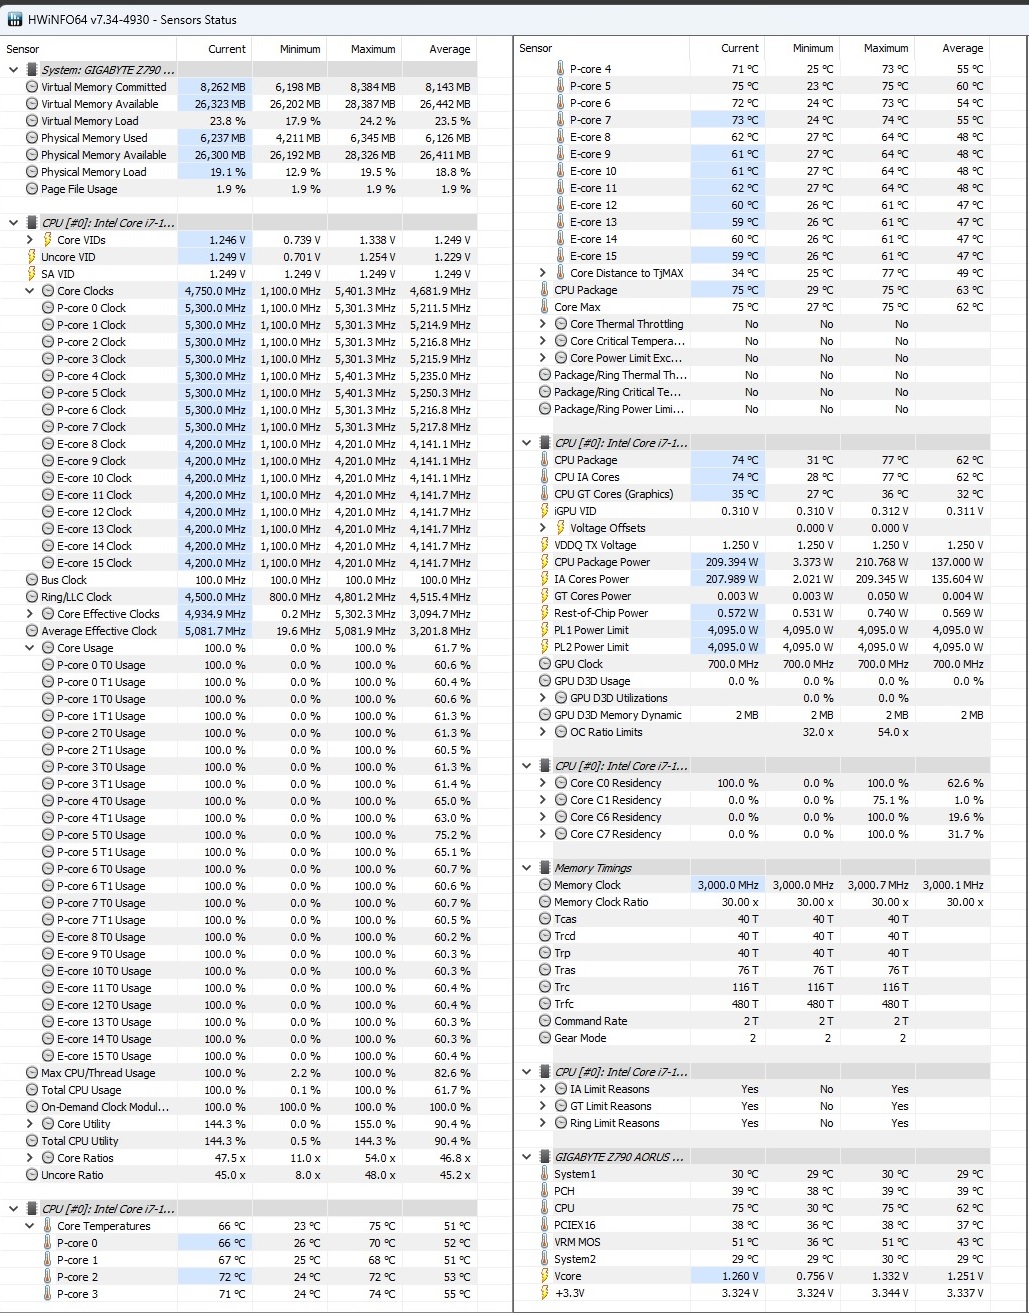
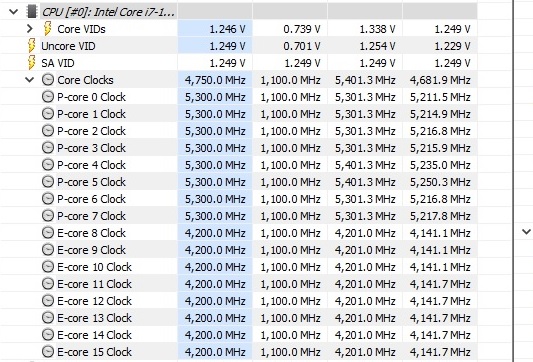
The temperature under load was 75°C.
The power draw on the CPU package was 210.768W. This is less than the stated 253W for turbo frequency operation. All P-Cores were operating at 5.3GHz continuous, and all E-Cores were at 4.2GHz continuous. This is an impressive performance.
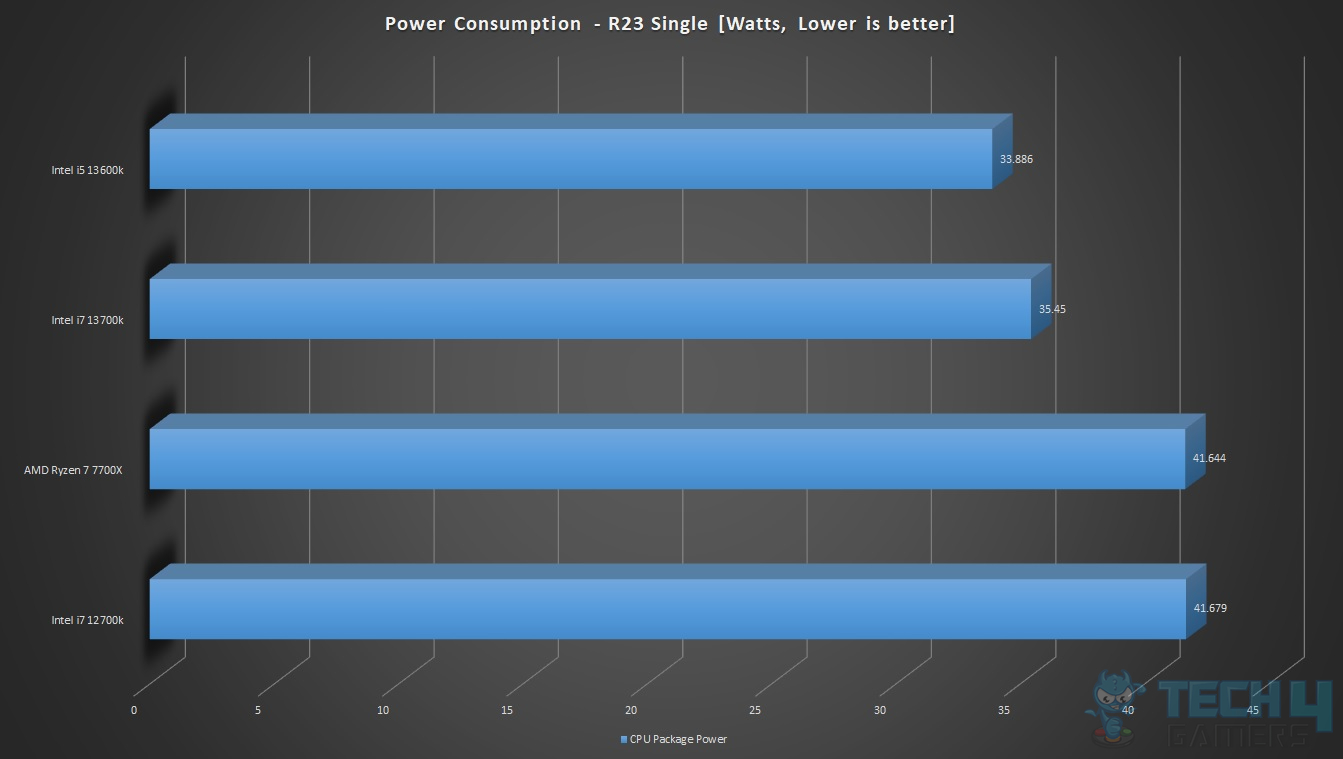
We also monitored the power usage on the single-core load using Cinebench R23. The CPU was drawing roughly 35.450W. Please note that single-core load does not use E-Cores on the Intel hybrid architecture (in Windows 11).
Comparative Performance At 4.0 GHz Clock
We have tested below mentioned SKUs by locking them at 4.0GHz all cores to see the performance gain, if any. This would be interesting, particularly for the core i7 12700k and 13700k:
- Core i5 13600k
- Core i7 12700k
- Core i7 13700k
- Ryzen 7 7700X
We have used Cinebench R23 runs to determine the relative score Multi-Core and Single-Core loads. The 1T or a single core load would give a better idea of IPC improvements, particularly for the core i7 12700k and i7 13700k. We left the E-Cores on the stock except on the core i7 13700k, where they were locked at 4.0GHz as well because they otherwise operate at 4.2GHz by default.
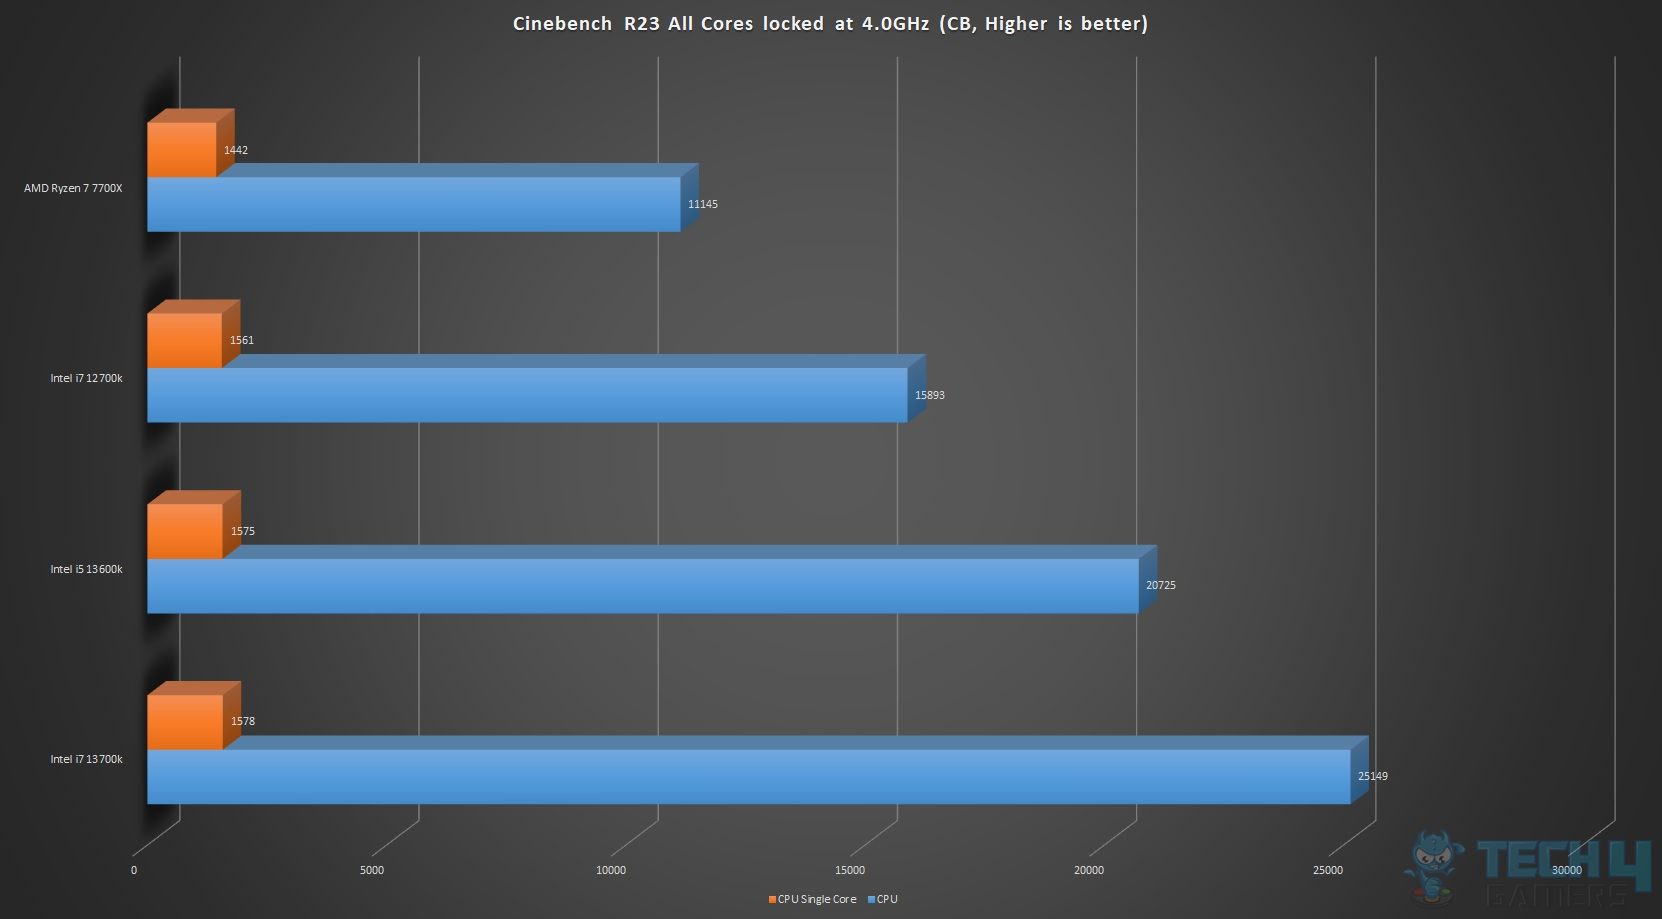
No surprise there, The Ryzen 7700X is at the fourth number. The core i7 13700k and core i5 1300k are almost neck to neck on a single-core run, but Multi-Core is where the core i7 13700k has the upper hand, and rightly so. Another trend that we can spot is the incremental difference between all these CPUs on the Multi-Core score.
The difference between the top 2, middle ones, and the middle to lowest one is roughly 4xxx. There is not a significant performance gap between the core i7 12700k and core i7 13700k in the single-core, but that difference is huge in the Multi-Core scores.
Overclocking
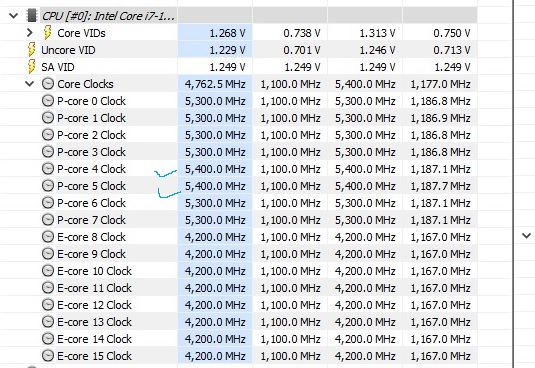
We started with P-Cores at 5.4GHz and E-Cores at 4.2GHz. For each change, we have tested the Cinebench R23 to see if there is any performance hit or gain. This was then tested further using games and other loads for stability. We settled at P-Cores operating at 5.7GHz and E-Cores at 4.6GHz. This is a good overclock on this CPU. The Vcore was set at approximately 1.350V.
The above picture shows the performance gain from this overclock in the Cinebench R23. We saw a performance gain of approximately 7.31%.
The CPU was drawing 272W package power approximately, and the temperature was 90°C. Please remember we are using a custom loop setup with a massive-size radiator. The results with the regular AIO or air cooler would be different, and you might actually go into thermal throttling with this overclock on a regular cooler.
Conclusion
Intel is continuing the hybrid architecture with the release of 13th gen Raptor Lake series desktop CPUs. The new generation is using “Raptor Cove” based P-Cores (Performance Cores), which is a key difference over the Alder-Lake series CPUs. This time around, Intel has increased the number of E-Cores or efficiency cores though the E-Cores are still based on the same design, Gracemont, as is in the Alder Lake series.
But Intel has upped the clock speeds and, among other differences, upped the size of the L2 cache. Plus, the new E-Cores are now grouped in what Intel calls Cluster, with each cluster sharing upped-sized L2 cache from 2MB to 4MB.
The new CPUs support dual-channel DDR5 and DDR4 memory. There are 2x 64-bit channels for DDR4 and 4x 32-bit channels for DDR5. The DDR5 support is now at 5600MT/s, and the DDR4 support is 3200MT/s.
We earlier tested the core i5 13600k. This time around, we have tested the core i7 13700k. This CPU has 8 P-Cores with 16 threads and 8 E-cores. The count of E-Cores is doubled compared to the core i7 12700k. One would say that the count of P-Cores is the same compared to core i7 12700k.
But there is more to it than meets the eye. The new “Raptor Cove” based P-Cores are more powerful and efficient than the “Gold Cove” P-Cores on Alder Lake. We have higher clock speeds, more fast cache, powerful software, and other platform-related improvements. The new P-Cores have a base clock of 3.40GHz with a turbo boost clock of 5.3GHz.
The E-Cores have a base clock of 2.50GHz with a turbo boost clock of 4.20GHz. The L2 cache size is 24MB, whereas the L3 cache size is 30 MB. The rated power on base clocks is 125W, whereas it is a whopping 253W on turbo clocks. The CPU supports a total of 128GB with support of DDR5 up to 5600MT/s and DDR4 support of up to 3200MT/s. The CPU supports a dual-channel design with 89.6 GB/s memory bandwidth. The CPU has 20x PCIe lanes and supports Gen 5 and Gen 4. The DIM link is using 8 lanes and is based on DMI 2.0 revision.
This SKU has an in-built (iGPU) using Intel UHD Graphics 770. The base clock on the iGPU is 300MHz, and it has 32 processing units. The dynamic frequency range is up to 1.6GHz. The following output support is available:
- eDP 1.4b
- DP 14.a
- HDMI 2.1
The maximum supported resolution on HDMI is 4096×2160 @ 60Hz, and it is 7680×3200 @ 60Hz on DP 1.4. The eDP can support up to 5120×3200 resolution at 120Hz. The number of 4 display outputs is supported. CPU has Intel Quick Sync Video support as well as Clear Video HD Technology.
In our testing, we have seen the Intel core i7 13700k maintaining the boost clock of 5.3GHz on the P-Cores and 4.2GHz on the E-Cores under the heavy workload. We should point out that we have given an unfair advantage in the cooling to this CPU which was not available to us at the time of testing the AMD Ryzen 7 7700X.
We have used AlphaCool stuff for the DIY or custom loop setup using the gigantic 1260mm radiator with 9x 140mm fans. The Ryzen CPU also maintained the 5.1GHz across all cores under heavy load, and that was with the regular 360mm AIO. However, when we later on (after the testing and the content) employed the same cooling on the Ryzen CPU, it maintained 5.44GHz on all cores under heavy load. But keep in mind that the Intel core i7 13700k has 8x more efficient cores.
The core i7 13700k is supporting the Intel Thread Director. The core i7 13700k has Turbo Boost Max 3.0 enabled, which was not the case with the core i5 13600k. The Tj Max is set to 100°C. We have tested and compared this CPU against the Intel i7 12700k and AMD Ryzen 7 7700X. The core i7 13700k has a 24 thread count (8P+8E) as compared to a 20 thread count on core i7 12700k (8P+4E). Plus, the generation-related differences. The single core performance of the core i7 13700k is better overall compared to the other contenders.
Again using the TechPowerUp method of determining the energy efficiency, we have calculated the single-core and multi-core scores from the Cinebench R23 and divided the score with the package power draw of the CPUs during the run of this software.
| CPU | Energy Efficiency Score [Single-Core Load] |
| Intel Core i5 13600k | 59.28 |
| Intel Core i7 12700k | 44.98 |
| Intel Core i7 13700k | 59.77 |
| AMD Ryzen 7 7700X | 47.85 |
We can see that the Intel core i5 13600k and core i7 13700k have a similar score making them both good energy-efficient CPUs when it comes to the 1T load handling.
Now, it is time to look at multi-core load handling from the same perspective:
| CPU | Energy Efficiency Score [Multi-Core Load] |
| Intel Core i5 13600k | 136.27 |
| Intel Core i7 12700k | 115.55 |
| Intel Core i7 13700k | 147.95 |
| AMD Ryzen 7 7700X | 143.39 |
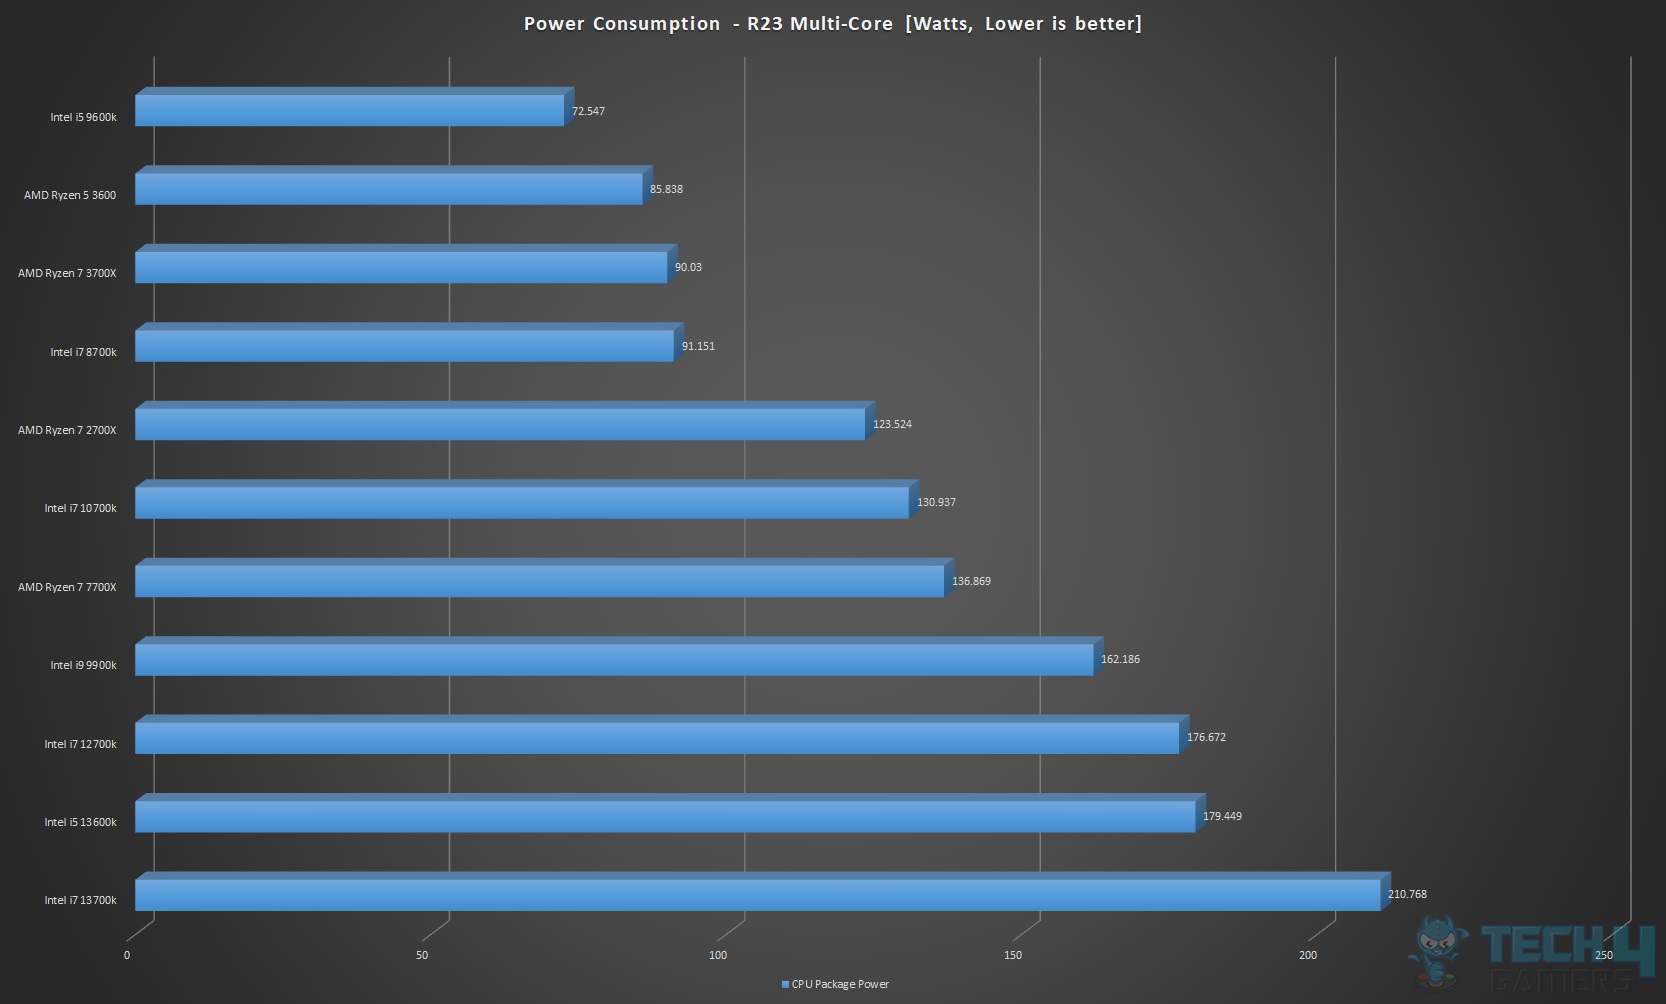
Although core i7 13700k has the most score in the list, it is a marginal gain over the Ryzen 7 7700X as we can see that Ryzen 7 7700X is almost hitting the level of core i7 13700k. Now, this will put things in perspective when it comes to how efficient a given CPU is. The core i5 13600k is drawing near 180W under heavy workload, and core i7 12700k is drawing near 177W, and the Ryzen 7 7700X is drawing 135W, for that matter. When you put in the power draw of the new core i7 13700k, it is drawing roughly 210W. Despite winning the battle, we can see that the blue camp is using more power compared to the red camp.
The gaming performance of the core i7 13700k is better overall. We have seen quite a performance gain in some titles however, in the others, the gaming performance is almost at par with the core i7 12700k. This would also depend on the build configuration and game type. Competitive gaming would get better performance from the new platform.
When it comes to cooling, this CPU runs warm. You would need a better cooling solution, say AIO, for that matter. Though how it would keep the temps is subjective. You would see a decent temperature in a single-threaded or where fewer cores are utilized however, with all P-Cores operating at 5.3GHz and E-Cores operating at 4.2GHz, under heavy workload, the temperatures would peak.
In our case, the maximum temperature under heavy workload was near 76°C at an ambient of approximately 20°C. Keep in mind that we are using a DIY setup with a gigantic radiator of 1260mm size and 9x 140mm fans on it. This should give you a clear idea of the temperature under a heavy workload.
We were able to push our CPU to 5.7GHz in all P-Cores and 4.6GHz in all E-Cores. This is impressive overclocking but one that we can never have with AIO or an air cooler. For that, you may be restricting to 5.5GHz all P-Cores or so. The best thing to do is do turbo ratio based overclocking with fewer clocks reaching the highest permissible clock and the rest of the clocks operating at 5.4GHz or so.
Of course, this would come down to the user’s specific requirement. The above would suit a gamer, and all-core overclocking would help other users. Options are there. One would need to play around for an optimal configuration.
One last thing under consideration is the platform’s viability. This is where Intel has the upper hand over the competition. As we mentioned in the content of core i5 13600k, the new 13th gen CPUs can be used on the 12th gen platform, for which a BIOS update is needed. This would save bucks for the users and would give them a boost in performance. On the other hand, the user can still use the DDR4 RAM on the new 700 series platform, as this platform has support for DDR5 and DDR4.
This is where the user can save money. Plus, the pricing of the new SKUs is also competitive. It has a better overall performance yet costs less, making it a win-win case. However, note that as per the architecture details, using the Gen 5 NVMe SSD and the graphics card at the same time on the topmost slots, the graphics card will operate at x8 speed, not x16. I am not sure what is the reason behind that, but overall this is a severe limitation that needs to be mentioned, as there is no such restriction on the AMD AM5 (X670) platform.
Was our article helpful? 👨💻
Thank you! Please share your positive feedback. 🔋
How could we improve this post? Please Help us. 😔


