

Apple stock (AAPL) – Get Apple Inc. Report is considered a buy by the majority of analysts that cover the name. According to TipRanks, more than 80% of Wall Street experts think that owning shares is a good idea, while only one analyst has a sell rating on the stock.
Among skeptics, one of the main arguments against owning AAPL is the elevated P/E ratio. But a closer look at the peer comparison suggests that Apple stock may be more affordable than many seem to believe.
Figure 1: Is Apple Stock Overvalued? What The Peer Comparison Says
Unsplash
(Read more from the Wall Street Memes: Apple Stock: Is The Rally Over? This Expert Says “Be Patient”)
Apple’s valuations: fair, too rich, or a bargain?
The following graph probably explains why so many value investors are cautious about Apple stock today. Notice what has happened to AAPL’s price-to-earnings (or P/E) ratio over the past 10 years:
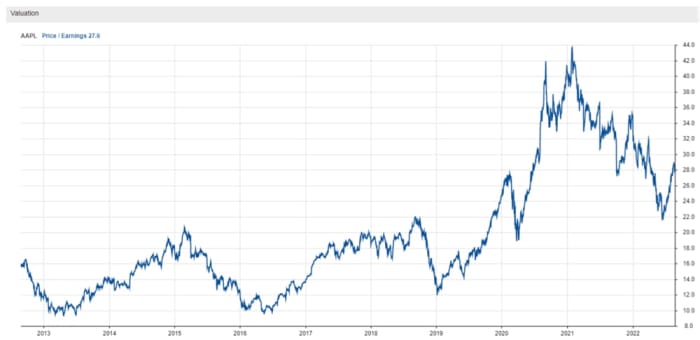
Figure 2: Apple’s valuation.
Stock Rover
Starting a couple of years after the launch of the original iPad, Apple’s P/E fluctuated between 10 and 20 times for a few years. Then, beginning in 2019, the valuation multiple skyrocketed to as high as 44 times early last year, settling now to just below 30 times.
The multiple expansion happened for a few reasons, the most relevant of which was probably Apple’s business model shift to higher-margin and more predictable services. The post-iPhone X success of Apple’s smartphone segment, along with the company’s generous cash return policy, probably helped too.
But tech companies, especially those in high growth stages of their lifecycles or whose “moats” are considered wide, tend to command high P/Es. Take a look at the following table comparing some of Apple’s key valuation metrics with those of peers selected by Stock Rover:
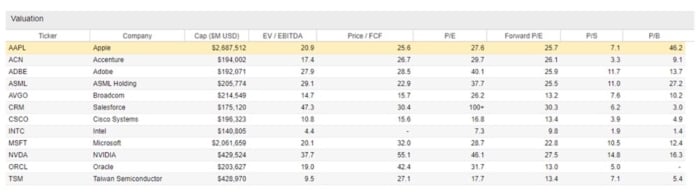
Figure 3: Apple peers key valuation metrics selected by Stock Rover.
Stock Rover
Starting with P/E, in the sixth column, notice how AAPL’s 27.6 times is actually much lower than NVIDIA’s 46.1 and Adobe’s 40.1 times, for example. Part of the reason for AAPL’s more de-risked valuation is the growth profile: while the Cupertino company is expected to increase EPS by 6% next year, NVIDIA and Adobe should deliver growth of 17% instead.
The only companies on the list with substantially lower P/E vs. Apple are Intel and Cisco, possibly Broadcom. But considering these companies and their industries’ much less encouraging growth profile, it is understandable that these stocks would trade more cheaply.
Let’s look beyond P/E. On a price-to-FCF (free cash flow) basis, Apple’s 25.6 times multiple seems even cheaper compared to the peer group. Only Broadcom and Cisco, at about 16 times, look substantially more de-risked.
Apple’s cash flow-based valuation metrics look good because the Cupertino company is particularly competent at turning earnings into hard cash. Tight control of working capital and capex is probably what best supports the argument.
Lastly, notice how Apple looks quite overvalued on a price-to-book basis. A multiple of 46.1 times, in fact, is an eye sore compared to Salesforce.com’s 3.0 times and Intel’s 1.4 times.
But here, the metric is deceivingly distorted. Because Apple buys so many of its shares via stock buybacks, the company’s equity size has been shrinking quickly over the years – which is not a bad thing at all. Since equity is the denominator in the P/B ratio, the multiple understandably looks too rich, on the surface.
My views on AAPL’s valuation
I still believe that Apple’s valuations are far from being a bargain. But at the same time, once I look at the peer group comparison, I find it hard to side with the bears as well. To me, AAPL’s P/E is fair and consistent with the robust business fundamentals of the company.
Ask Twitter
Apple’s P/E of about 27 times is still higher than the broad market multiple, but lower than those of several tech peers. What do you think of AAPL’s valuation multiple today?
Explore More Data And Graphs
Many of the graphs used by the Apple Maven are provided by Stock Rover. We have been impressed with the breadth and depth of information on markets, stocks and ETFs that this platform provides. Stock Rover also helps to set up detailed filters, track custom portfolios and measure their performance relative to a number of benchmarks.
To learn more, check out stockrover.com and get started for as low as $7.99 a month. The premium plus plan that we have will give you access to all the information that goes into our analysis and much more.
(Disclaimers: this is not investment advice. The author may be long one or more stocks mentioned in this report. Also, the article may contain affiliate links. These partnerships do not influence editorial content. Thanks for supporting Wall Street Memes)

