

- The rise in market inflation indicated that BTC holders were selling some of their assets.
- Data showed that the price could rise toward $72,000 before a major correction.
If the signals AMBCrypto got from Glassnode’s on-chain data are anything to go by, Bitcoin [BTC] could be set for a significant price decrease.
Leading this prediction is the LTH Market Inflation Rate. LTH stands for Long Term Holders in the market.
The LTH Market Inflation Rate uses the level of accumulation or distribution to determine Bitcoin’s next direction.
However, two lines exist on this chart, as shown below. Green represents the market inflation rate, while the manila color indicates the nominal inflation rate.
Investor belief does not equate their actions
In bull cycles, if the market inflation drops below the nominal inflation, it indicates that long-term holders are accumulating. As such, this could drive a price increase for Bitcoin.
On the other hand, the market inflation rate rising above the nominal rate suggests that holders are significantly adding to the sell pressure.
Hence, BTC could be on the verge of a notable fall. At press time, the metric formed the latter pattern.
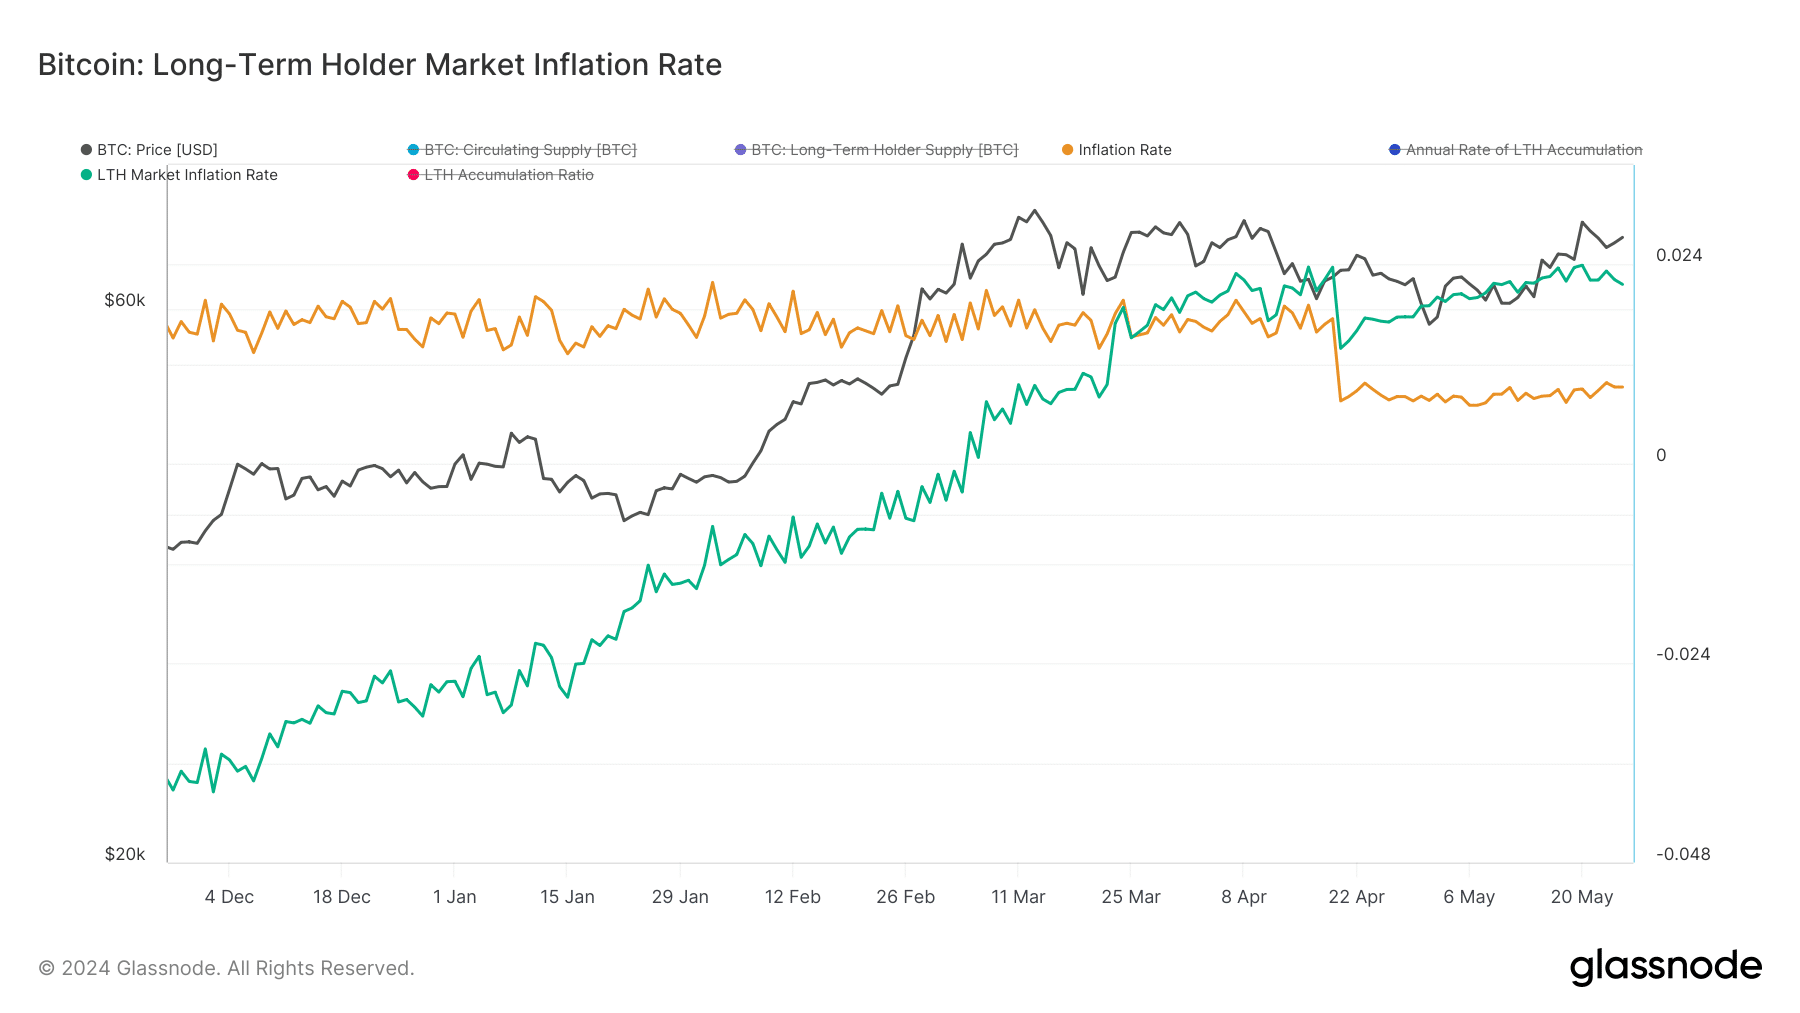
Source: Glassnode
Bitcoin changed hands at $69,164 at press time, representing a 2.98% increase in the last seven days.
But before concluding that holders might push BTC to the downside, AMBCrypto analyzed the sentiment holders have about the coin.
To do this, we looked at the LTH-NUPL. This metric is an acronym for Long Term Holder – Net Unrealized Profit/Loss. With this, one can have an idea of the behavior of long-term holders.
As of this writing, the LTH-NUPL was in the belief zone (green). This indicates that holders, who have held the coin for at least 155 days, are confident that in Bitcoin’s potential.
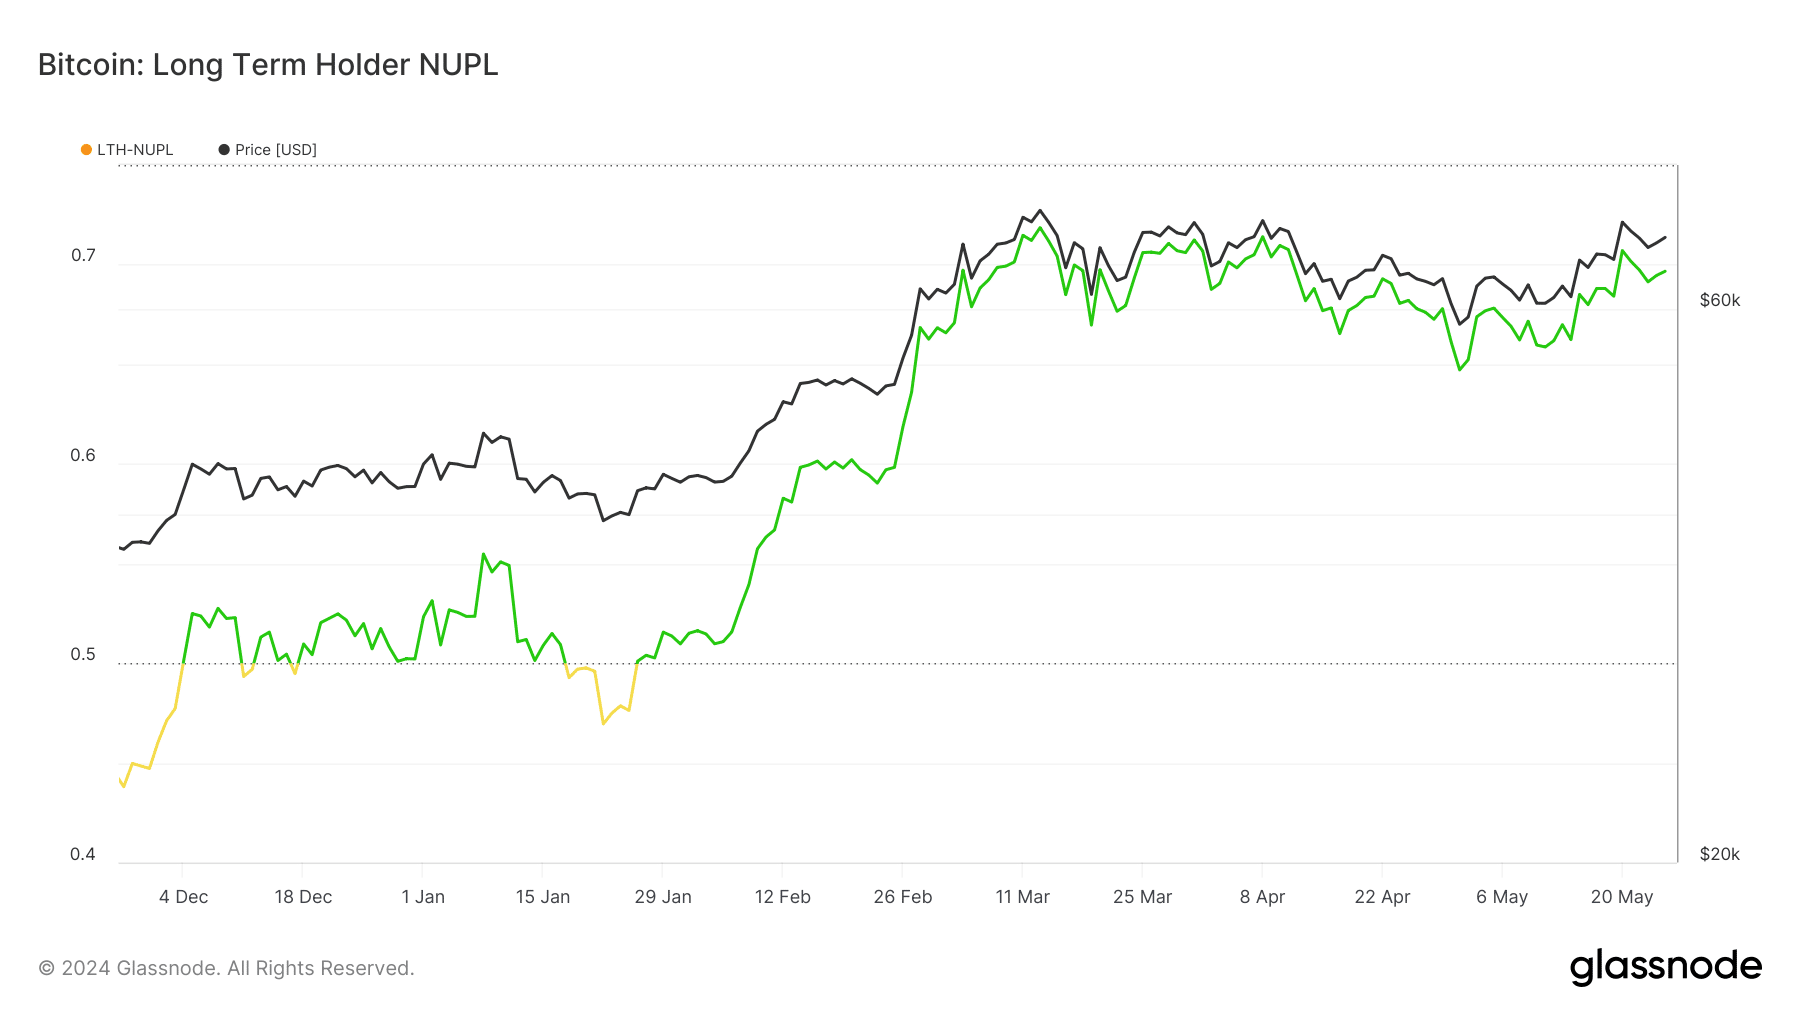
Source: Glassnode
However, this might not be for the short term, as the same set of people might contribute to BTC’s distribution.
In terms of price prediction, the liquidation heatmap provided insights into the coin’s movement.
$72K, then $63K
Liquidation heatmap helps traders to find the best liquidity positions. If liquidity is concentrated in an area, prices can move in that direction. However, high liquidity zones can also be resistance or support zones.
Using data from Hyblock, AMBCrypto identified a magnetic zone at $72,350, indicating that Bitcoin’s price could move toward that region.
However, the same zone could act as resistance for the coin. If BTC rises to the aforementioned price and gets rejected, it could spell doom for the cryptocurrency.
This is because the other major high-liquidity area was at $63,050.
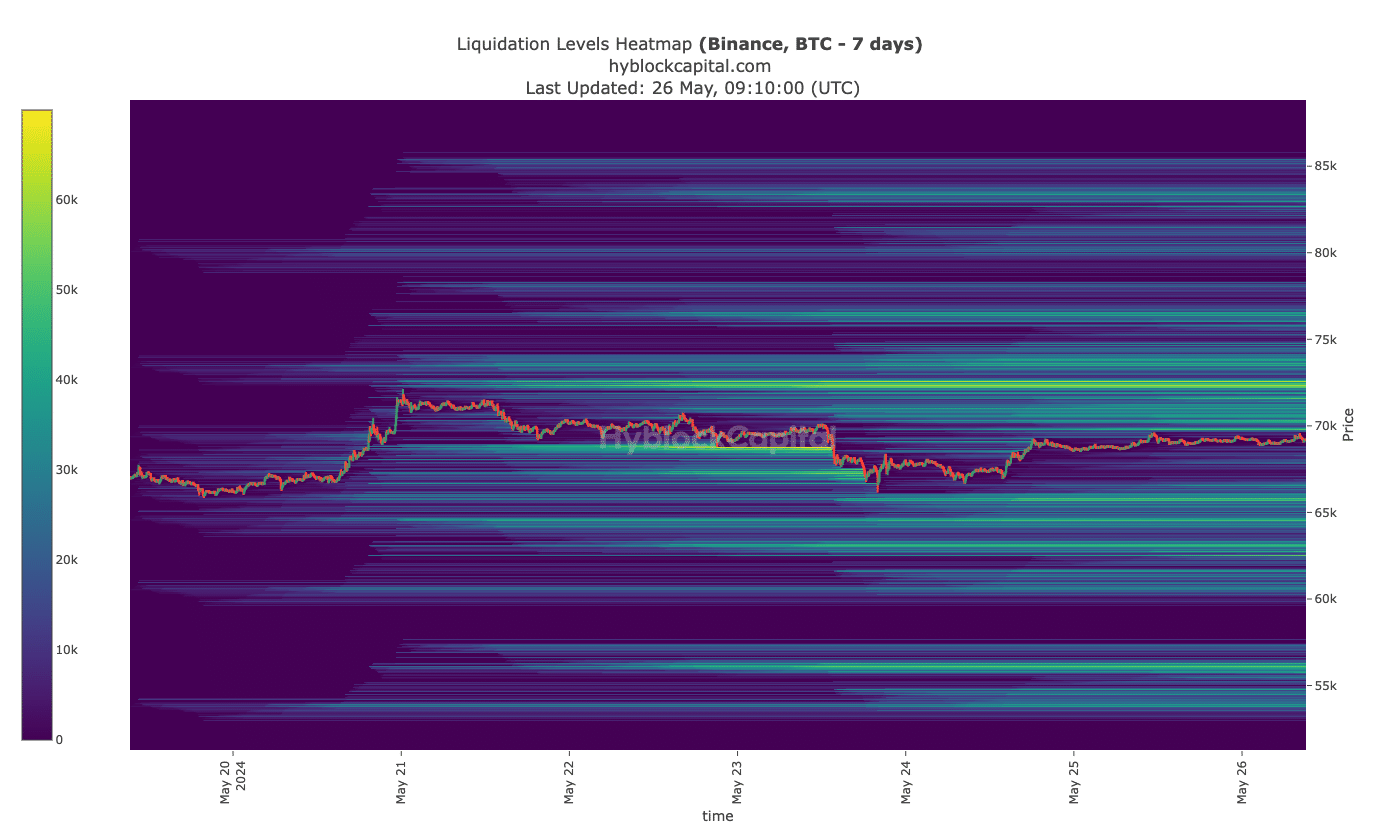
Source: Hyblock
Is your portfolio green? Check out the BTC Profit Calculator
Going by the indications above, Bitcoin’s price can increase. But when the correction appears, it could be difficult for the coin to rebound.
Should the coin lose hold of $63,050, the next decline could send BTC to $56,200. However, if this does not happen, Bitcoin might bounce toward $70,000 one more time.


 Miners Reached Record Total Market Cap of $22.8B in June, JPMorgan (JPM) Says")