
The Bitcoin price began Friday, August 16 from beneath the $57,000 level, following a sudden 7% fall on Thursday. While the premier cryptocurrency is showing good signs of recovery, a prominent crypto analyst has explained how the latest price decline may have pushed the BTC price into a bearish phase.
Bitcoin MVRV Drops Below 1-Year SMA – Impact On Price?
In a post on the X platform, popular crypto analyst Ali Martinez shared that the Bitcoin price has experienced a shift in its cycle following the latest price dip. This on-chain revelation is based on the Glassnode MVRV (Market Value to Realized Value) Momentum indicator, which serves as a tool for identifying macro market trends.
The MVRV Momentum indicator primarily consists of the MVRV ratio and the 1-year simple moving average (SMA). When the MVRV ratio breaks above this SMA, it indicates a transition into the bull market. Meanwhile, a break below the 1-year simple moving average signals a shift to the bearish phase.
Typically, strong breaches above the MVRV 1-year SMA suggest that large volumes of Bitcoin were acquired below the current price, showing that the holders are now in profit. On the flip side, when there is a strong break beneath the moving average, it indicates that large volumes of BTC were purchased above the current price, with the holders in the red.
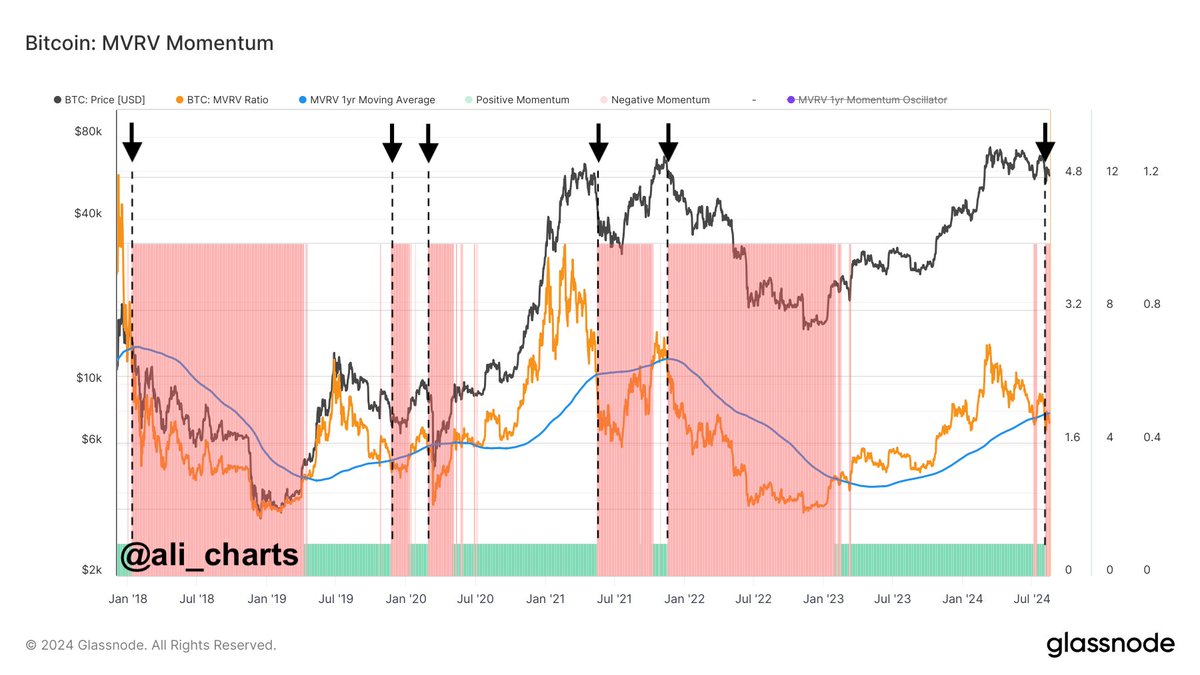
A chart showing the Bitcoin price and the MVRV momentum indicator | Source: Ali_charts/X
According to Martinez, the BTC cycle transitioned to a bearish phase after the Bitcoin price slumped below $61,500. This latest significant break of the MVRV ratio beneath the SMA shows that a significant amount of BTC was acquired above $61,500. However, the coins are now in loss, which may potentially lead to heavy distribution by investors who want to cut back their losses.
When a large number of investors are in the red, there is an increased pressure to sell, which could put further downward pressure on the Bitcoin price. Ultimately, this could lead to a situation where falling prices result in more asset offloading, thereby strengthening the momentum of the bearish phase.
Bitcoin Price At A Glance
As of this writing, the price of Bitcoin continues to hover around $59,000, reflecting a 2.5% increase in the past 24 hours. Nevertheless, the premier cryptocurrency is down by nearly 3% on the weekly timeframe, according to data from CoinGecko.

The price of Bitcoin hovers around the $59,000 level on the daily timeframe | Source: BTCUSDT chart on TradingView
Featured image from iStock, chart from TradingView


