Chipmaker Marvell Technology (MRVL) was rated a new “buy” (outperform) by a sell-side firm Wednesday. Semiconductor manufacturers have struggled in the past year so we need to check to see if the worst is behind them.
In our October 11 review of MRVL we wrote that “MRVL could experience a short-term bounce at any time but the trends in place suggest further declines in the weeks ahead. Our target is the $33-$29 area.”
Let’s check out the charts of MRVL again.
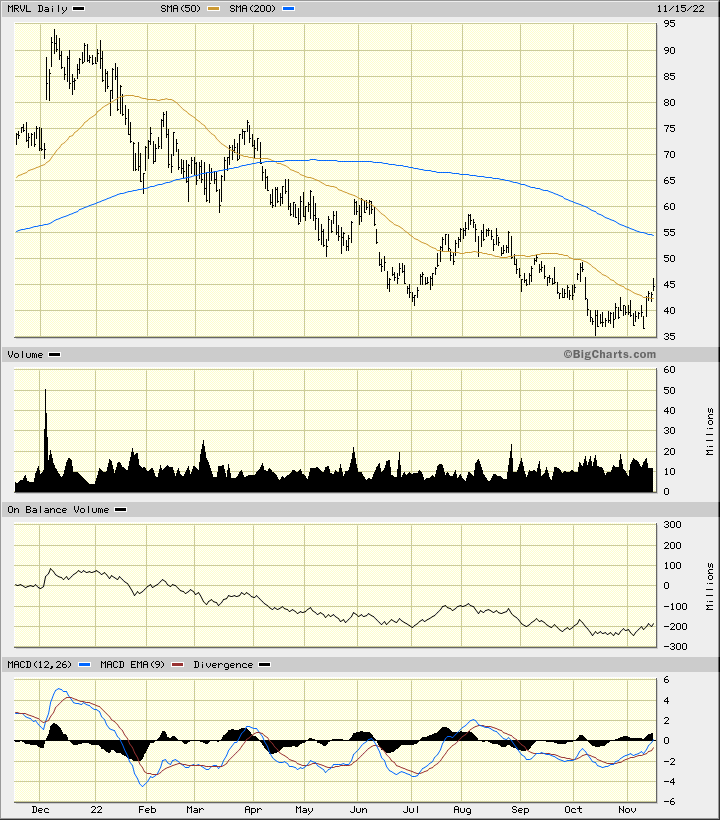
In the daily bar chart of MRVL, below, we can see that while the stock did not reach our price target range it has stayed relatively weak. Prices have firmed recently to move above the 50-day moving average line. The 200-day moving average line remains in a downward trend which intersects around $55.
The On-Balance-Volume (OBV) line shows weakness into October but then some slight improvement in November. The trend-following Moving Average Convergence Divergence (MACD) oscillator is just below the zero line and thus close to a new buy signal.

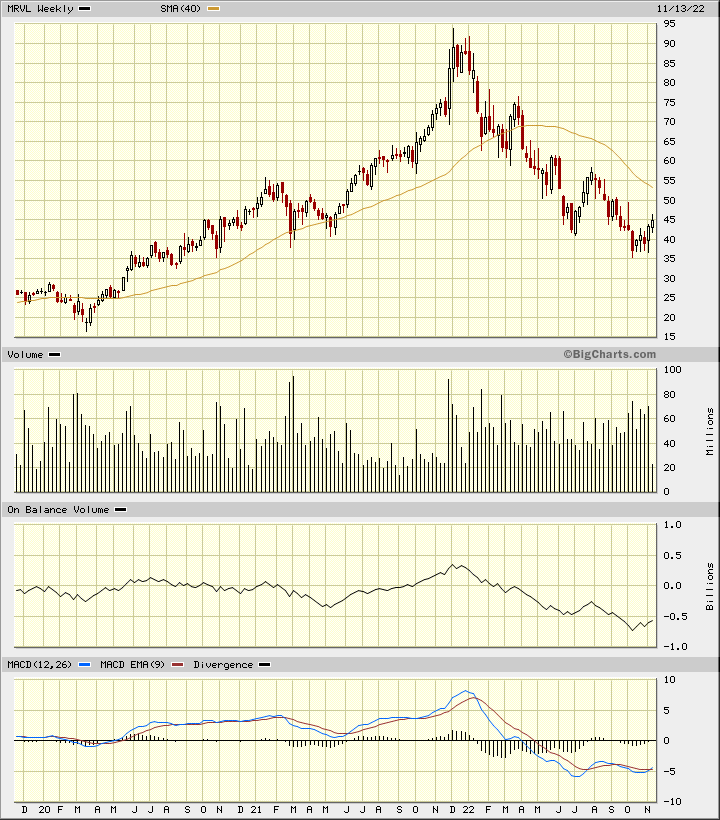
In the weekly Japanese candlestick chart of MRVL, below, we see a mixed picture. The chart below shows some lower shadows for MRVL in October. Lower shadows tell us that the lows are being rejected by traders and that tends to be a positive development. The 40-week moving average line still has a negative slope but this is a lagging indicator.
The weekly OBV line shows only minor improvement so far. The MACD oscillator made a slightly higher high in October versus July even though prices made a lower low. This is a bullish divergence and now the indicator is close to a cover shorts buy signal.

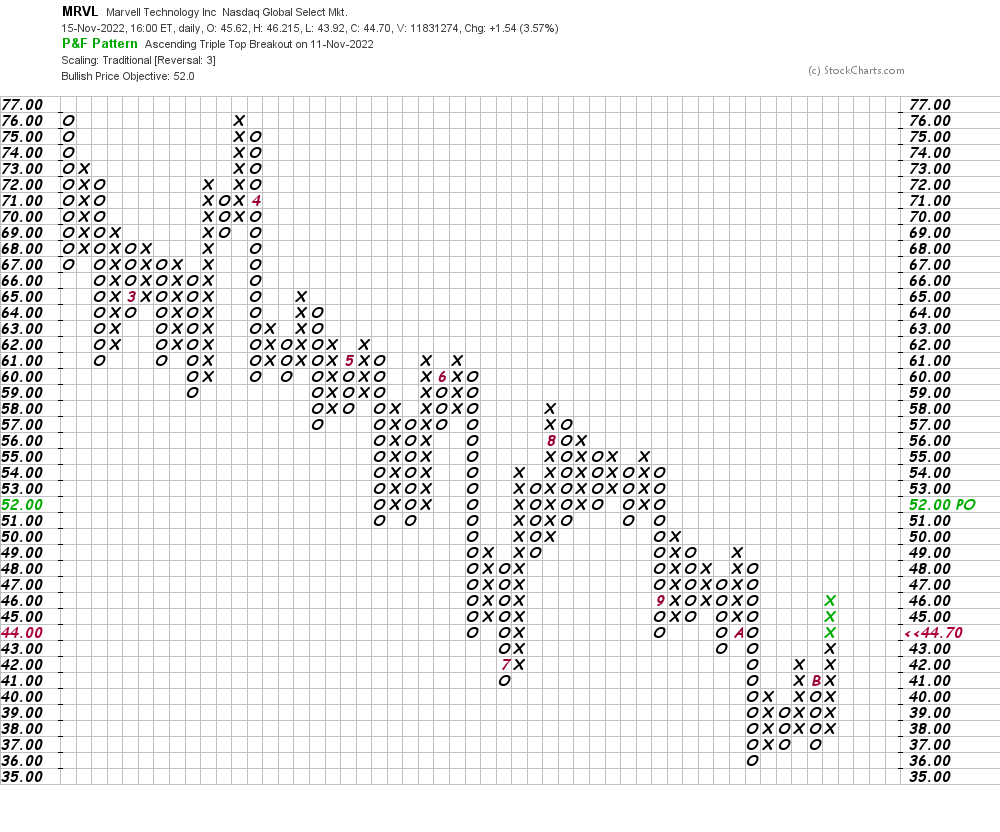
In this daily Point and Figure chart of MRVL, below, we can see an upside price target in the $52 area.

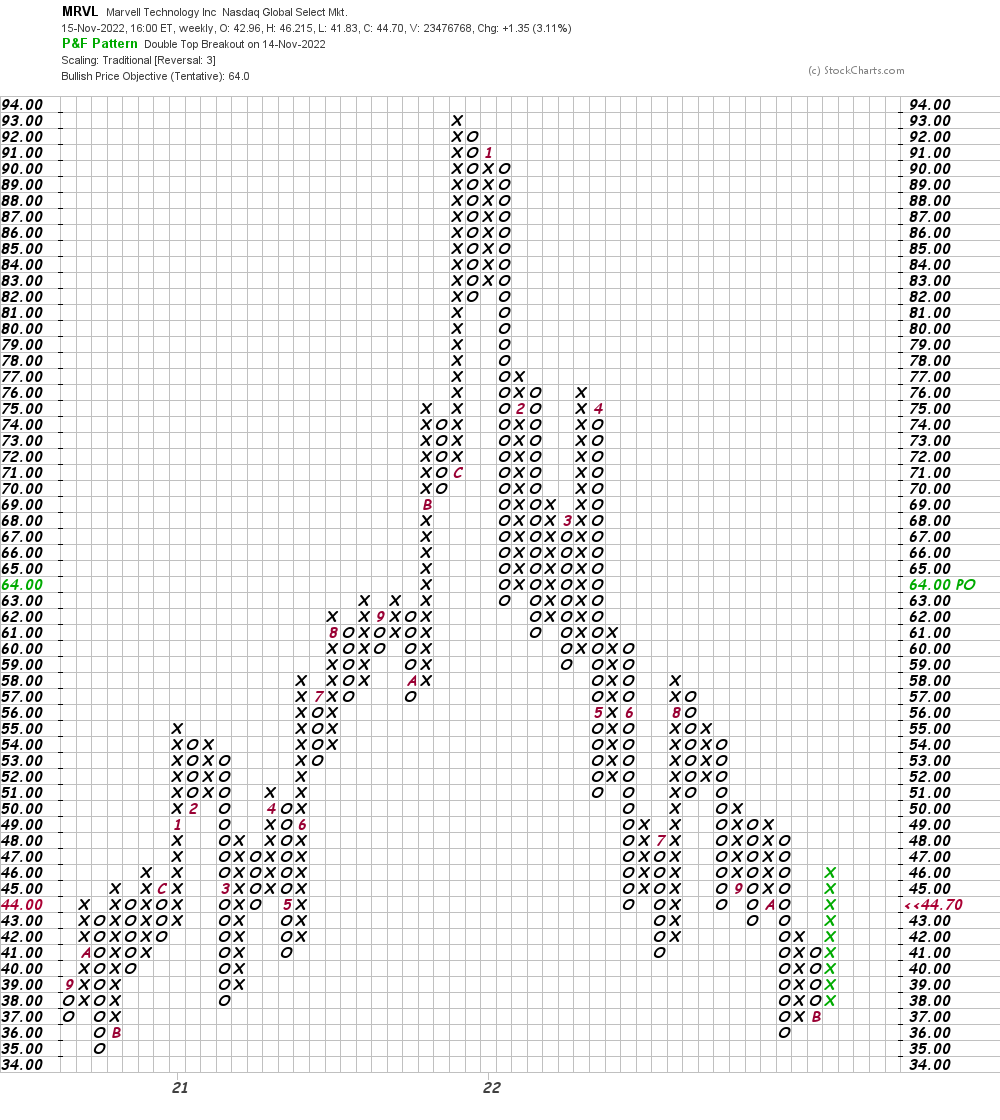
In this weekly Point and Figure chart of MRVL, below, we can see a price target in the $64 area.

Get an email alert each time I write an article for Real Money. Click the “+Follow” next to my byline to this article.


